

 |
市場調查報告書
商品編碼
2125749
電動汽車電池負極材料:市場佔有率分析、產業趨勢與統計及成長預測(2026-2031)Electric Vehicle Battery Anode - Market Share Analysis, Industry Trends & Statistics, Growth Forecasts (2026 - 2031) |
||||||

※ 本網頁內容可能與最新版本有所差異。詳細情況請與我們聯繫。
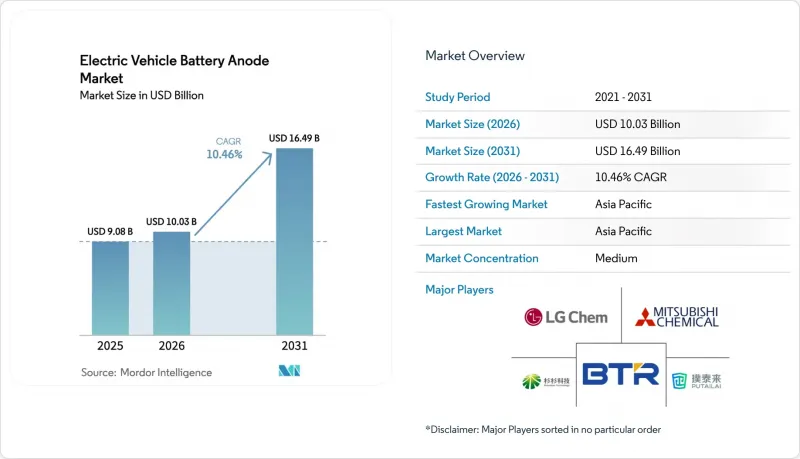
據 Mordor Intelligence 稱,電動車電池負極市場預計到 2026 年價值 100.3 億美元,高於 2025 年的 90.8 億美元,預計到 2031 年將達到 164.9 億美元。
預計 2026 年至 2031 年的複合年成長率為 10.46%。
本報告按電池材料類型(石墨、矽增強石墨、高矽、其他)、電池形狀(圓柱形、棱柱形、軟包型)、車輛類型(乘用車、輕型商用車、中型和重型卡車、巴士和長途客車、摩托車和三輪車、其他)以及地區(北美、歐洲、亞太地區、南美、中東和非洲)進行分類。
全球電動汽車電池負極市場趨勢及洞察
全球電動車產量激增
2024年,全球輕型電動車(EV)產量將達到1,400萬輛,較去年同期成長25%。這將需要約420吉瓦時(GWh)的電池容量和46.2萬噸負極材料。中國電動乘用車產量為950萬輛,而歐洲和北美加起來的產量僅320萬輛。電池組的平均容量從2020年的60千瓦時(kWh)增加到2024年的80千瓦時,每輛車的負極材料用量增加了33%。商用車的電氣化進一步擴大了需求。戴姆勒卡車和沃爾沃為其8級卡車指定了540千瓦時的電池組,每個電池組包含600公斤負極材料。東南亞摩托車銷量在2024年達到2,000萬輛,石墨消耗量已達8萬噸,預計2027年這數字將會翻倍。
政府獎勵和在地採購規則對電池材料的影響
《通貨膨脹抑制法案》規定,電池組件必須在北美或與LG能源解決方案公司簽訂自由貿易協定(FTA)的國家生產。為此,LG能源解決方案公司正在密西根州投資56億美元建造一座負極材料複合材料工廠,該工廠計劃於2026年運作。歐洲的《關鍵原料法案》旨在2030年實現40%的國內加工比例,而Syrah Resources公司位於路易斯安那州的合成石墨工廠正在建設中,並獲得了歐洲投資銀行(EIB)提供的2億歐元貸款擔保。韓國的K-Battery計畫已撥款20.5兆韓元用於負極材料的在地化生產,而印度的生產關聯激勵計畫(PLI)提供20%的資本補貼,這正在推動Epsilon Advanced Materials公司在古吉拉突邦建設的年產1萬噸電池項目。
矽體積膨脹和循環壽命相關的挑戰
純矽在鋰化過程中體積膨脹三倍,導致SEI(固體電解質界面)出現裂紋,使得第一代複合材料的循環壽命僅為500次,遠低於汽車製造商承諾的1500次循環。奈米結構和碳殼可以緩解應力,但材料成本從石墨的15美元/公斤飆升至矽奈米線的45美元/公斤。添加5%至10%的矽可提高8%的能量密度,但向400瓦時/公斤電池組的過渡仍然緩慢。固體電解質可望抑制膨脹,但商業化大規模生產預計仍需5-7年時間。
細分市場分析
預計到2025年,石墨將保持92.95%的銷售佔有率,而高矽負極材料預計將以33.2%的複合年成長率成長,成為所有材料中成長率最高的。天然石墨主要用於成本需求較高的摩托車應用,而合成石墨在循環次數要求較高的應用中則享有30%的溢價。預計到2031年,高矽電動汽車電池負極的市場規模將達到27.6億美元,佔該細分市場銷售額的16.74%。用於鈉離子電池的硬碳負極和用於快充車輛的鈦酸鋰負極仍屬於佔比不到3%的小眾市場,但其複合年成長率在18%至22%之間。歐洲碳邊境調節機制(CBAM)將對高排放的合成石墨進行處罰,迫使供應商轉向使用可再生能源的爐窯。
汽車製造商的籌資策略截然不同。他們使用成本最低的石墨生產大眾車型,而為了在高階車型上獲得續航里程優勢,則願意承擔更高的矽成本。 Westwater Resources公司位於阿拉巴馬州的礦場和Epsilon公司位於古吉拉突邦的工廠,都體現了美國和印度政策框架下的在地採購。
區域分析
預計到2025年,亞太地區將佔全球石墨銷售額的63.10%,年複合成長率(CAGR)為11.65%。光是中國湖南和江西兩省每年就加工40萬噸天然石墨,韓國正投資154億美元擴大合成石墨產能。日本則專注於技術研發,三菱化學為Panasonic提供了一條年產能1.5萬噸的生產線。在印度,隨著塔塔汽車擴大生產規模,預計2030年,印度石墨消費量將成長兩倍,達到4.5萬噸。預計到2025年,北美將佔據18.35%的市場佔有率,年複合成長率為12.98%,這主要得益於《第45X條》規定的每公斤10美元的稅收抵免以及加拿大拉克德伊爾礦的原料供應。預計到2031年,北美電動車電池負極材料市場規模將達41.2億美元。墨西哥繼續保持其組裝中心的地位,從美國進口負極材料以滿足美墨加協定(USMCA)的規定。預計到2025年,歐洲將佔據15.25%的市場佔有率,並維持12.55%的成長率,主要是由於《關鍵原料法案》和碳邊境調節機制(CBAM)對從亞洲進口材料徵收的合規成本所致。席勒公司位於路易斯安那州的工廠和諾斯沃特公司的回收循環系統總合可處理8.8萬噸原料,但仍無法滿足市場需求。南美洲和非洲是原料出口地,光是莫三比克的巴拉馬礦就佔全球天然石墨貿易的8%。
亞洲仍然佔據最大的市場佔有率,但中國對塗料生產能力的實際否決權確保了全球供應在 2027 年後其他生產線投入運作之前仍將處於脆弱狀態。
其他好處
- Excel格式的市場預測(ME)表
- 3個月的分析師支持
目錄
第1章:引言
- 研究假設和市場定義
- 調查範圍
第2章:調查方法
第3章執行摘要
第4章 市場狀況
- 市場概覽
- 市場促進因素
- 全球電動車產量激增
- 政府獎勵措施和在地採購規則對電池材料的影響
- 合成石墨產能的提高導致成本曲線下降
- 中國對石墨出口的限制促進了供應鏈多元化
- OEM廠商正向4680/「第四代」圓柱形電池過渡,並採用高矽複合材料負極。
- 由於電池形狀的轉變(從矩形到大型圓柱形),負極設計規範發生了變化。
- 市場限制因素
- 矽體積膨脹和循環壽命相關的挑戰
- 合成石墨的ESG和碳足跡審查
- 人們對再生材料供應過剩的擔憂抑制了對原生材料的需求。
- 儘管地緣政治風險不斷上升,但負極塗層工藝仍有 97% 集中在中國。
- 供應鏈分析
- 監理情勢
- 技術展望
- 波特五力模型
- 投資與資金籌措分析
- 專利趨勢(矽、石墨、LTO)
第5章 市場規模與成長預測
- 依電池材料類型
- 石墨
- 矽增強石墨(矽含量最高10%)
- 高矽(Si含量≥10%)和SiOx
- 鈦酸鋰(LTO)
- 其他先進材料(硬碳、碳奈米管摻雜材料、石墨烯)
- 細胞類型
- 圓柱形
- 矩形的
- 小袋
- 按車輛類型
- 搭乘用車
- 輕型商用車
- 中型和大型卡車
- 巴士和長途汽車
- 二輪車/三輪車
- 非公路和特種用途電動車
- 按地區
- 北美洲
- 美國
- 加拿大
- 墨西哥
- 歐洲
- 德國
- 英國
- 法國
- 義大利
- 西班牙
- 北歐國家
- 俄羅斯
- 其他歐洲國家
- 亞太地區
- 中國
- 印度
- 日本
- 韓國
- ASEAN
- 澳洲和紐西蘭
- 其他亞太國家
- 南美洲
- 巴西
- 阿根廷
- 其他南美國家
- 中東和非洲
- 沙烏地阿拉伯
- 南非
- 其他中東和非洲國家
- 北美洲
第6章 競爭情勢
- 市場集中度
- 策略趨勢(併購、聯盟、購電協議)
- 市場佔有率分析(主要公司的市場排名和佔有率)
- 公司簡介
- Mitsubishi Chemical Group
- BTR New Material Group
- Shanshan Corporation
- Putailai New Energy(PTL)
- LG Chem Ltd/LG Energy Solution
- Tokai Carbon Co. Ltd
- Nippon Carbon Co. Ltd
- Resonac Holdings(Showa Denko)
- Targray Industries Inc.
- NEI Corporation
- Nexeon Ltd
- Sionic Energy
- Sila Nanotechnologies
- Group14 Technologies
- POSCO Future M
- Syrah Resources Ltd
- NOVONIX Ltd
- Amprius Technologies
- JFE Chemical Corporation
- Hunan Zeto New Energy
第7章 市場機會與未來展望
According to Mordor Intelligence, electric vehicle battery anode market size in 2026 is estimated at USD 10.03 billion, growing from 2025 value of USD 9.08 billion with 2031 projections showing USD 16.49 billion, growing at 10.46% CAGR over 2026-2031.
This report is Segmented by Battery Material Type (Graphite, Silicon-Enhanced Graphite, High-Silicon, and More), Cell Format (Cylindrical, Prismatic, and Pouch), Vehicle Type (Passenger Cars, Light Commercial Vehicles, Medium and Heavy Trucks, Buses and Coaches, Two and Three-Wheelers, and More), and Geography (North America, Europe, Asia-Pacific, South America, and Middle East and Africa).
Global Electric Vehicle Battery Anode Market Trends and Insights
Surging EV Production Volumes Worldwide
Global light-duty EV output hit 14 million units in 2024, a 25% year-on-year rise that required roughly 420 GWh of batteries and 462,000 metric tons of anode material. China produced 9.5 million passenger EVs, whereas Europe and North America combined for 3.2 million. Average pack capacities climbed from 60 kWh in 2020 to 80 kWh in 2024, lifting anode intensity per vehicle by 33%. Commercial-vehicle electrification amplifies demand: Daimler Truck and Volvo specify 540 kWh packs for Class 8 models, each containing 600 kg of anode material. Two-wheeler sales in Southeast Asia reached 20 million electric units in 2024 and already consume 80,000 t of graphite, a figure set to double by 2027.
Government Incentives & Local-Content Rules for Battery Materials
The Inflation Reduction Act requires that battery components originate from North America or FTA partners, prompting LG Energy Solution to invest USD 5.6 billion in a Michigan anode complex scheduled for 2026. Europe's Critical Raw Materials Act targets 40% domestic processing by 2030; Syrah's Louisiana synthetic-graphite plant advanced under a EUR 200 million EIB loan guarantee. South Korea's K-Battery scheme allocates KRW 20.5 trillion to localize anodes, while India's PLI program offers 20% capital subsidies, catalyzing Epsilon Advanced Materials' 10,000 t Gujarat project.
Silicon's Volumetric-Expansion & Cycle-Life Challenges
Pure silicon expands threefold during lithiation, fracturing the SEI and limiting first-generation composites to 500 cycles, well below automaker warranties of 1,500 cycles. Nano-structuring and carbon shells mitigate stress but raise material costs from USD 15/kg for graphite to USD 45/kg for silicon nanowires. Silicon blends of 5%-10% uplift energy density 8% yet delay the jump to 400 Wh/kg packs. Solid-state electrolytes could restrain swelling, but commercial volumes remain five to seven years away.
Other drivers and restraints analyzed in the detailed report include:
- China's Graphite Export Controls Triggering Supply-Chain Diversification
- OEM Shift to High-Si Composite Anodes for 4680 Cells
- Anode-Coating Stage Still 97% China-Centric
For complete list of drivers and restraints, kindly check the Table Of Contents.
Segment Analysis
Graphite retained a 92.95% revenue share in 2025, while high-silicon anodes will grow at a 33.2% CAGR, the fastest of all materials. Natural graphite addresses cost-sensitive two-wheelers, whereas synthetic graphite commands a 30% premium in high-cycle applications. The electric vehicle battery anode market size for high-silicon formulations is forecast to reach USD 2.76 billion by 2031, equal to 16.74% of the segment revenue. Hard-carbon anodes for sodium-ion cells and lithium-titanate anodes for fast-charging fleets remain sub-3% niches but post 18%-22% CAGRs. Europe's Carbon Border Adjustment Mechanism will penalize high-emission synthetic graphite, pushing suppliers toward renewable-powered furnaces.
Automakers split sourcing strategies: mass-market platforms pursue cost-optimized graphite, while premium models absorb silicon premiums for range advantages. Westwater's Alabama mine and Epsilon's Gujarat plant illustrate feedstock localization under U.S. and Indian policy umbrellas.
Complete Report Scope:
- By Battery Material Type
- Graphite
- Silicon-Enhanced Graphite (Up to 10 % Si)
- High-Silicon (Above 10 % Si) and SiOx
- Lithium Titanate (LTO)
- Other Advanced (Hard-Carbon, CNT-Doped, Graphene)
- By Cell Format
- Cylindrical
- Prismatic
- Pouch
- By Vehicle Type
- Passenger Cars
- Light Commercial Vehicles
- Medium and Heavy Trucks
- Buses and Coaches
- Two and Three-wheelers
- Off-Highway and Specialty EVs
- By Geography
- North America
- United States
- Canada
- Mexico
- Europe
- Germany
- United Kingdom
- France
- Italy
- Spain
- NORDIC Countries
- Russia
- Rest of Europe
- Asia-Pacific
- China
- India
- Japan
- South Korea
- ASEAN Countries
- Australia and New Zealand
- Rest of Asia Pacific
- South America
- Brazil
- Argentina
- Rest of South America
- Middle East and Africa
- Saudi Arabia
- South Africa
- Rest of Middle East and Africa
- North America
Geography Analysis
Asia-Pacific accounted for 63.10% of revenue in 2025 and is projected to grow at a 11.65% CAGR. China's Hunan and Jiangxi provinces alone process 400,000 t/yr of natural graphite, while South Korea spends USD 15.4 billion to add synthetic capacity. Japan focuses on technology, with Mitsubishi Chemical's 15,000 t line feeding Panasonic. India's consumption triples to 45,000 t by 2030 as Tata Motors scales output. North America held 18.35% in 2025 and will post a 12.98% CAGR, driven by Section 45X's USD 10/kg credits and feedstock from Canada's Lac des Iles mine. The electric vehicle battery anode market size in North America is projected to reach USD 4.12 billion by 2031. Mexico remains an assembly hub, importing U.S. anodes to meet USMCA rules. Europe captured 15.25% in 2025 and grows at 12.55% as the Critical Raw Materials Act and CBAM add compliance costs to Asian imports. Syrah's Louisiana plant and Northvolt's recycling loop cover 88,000 t, still short of demand. South America and Africa export feedstock; Mozambique's Balama mine alone fills 8% of global natural graphite trade.
Asia retains the largest share, yet China's effective veto over coating capacity ensures global supply vulnerability until alternative lines are commission after 2027.
- Mitsubishi Chemical Group
- BTR New Material Group
- Shanshan Corporation
- Putailai New Energy (PTL)
- LG Chem Ltd / LG Energy Solution
- Tokai Carbon Co. Ltd
- Nippon Carbon Co. Ltd
- Resonac Holdings (Showa Denko)
- Targray Industries Inc.
- NEI Corporation
- Nexeon Ltd
- Sionic Energy
- Sila Nanotechnologies
- Group14 Technologies
- POSCO Future M
- Syrah Resources Ltd
- NOVONIX Ltd
- Amprius Technologies
- JFE Chemical Corporation
- Hunan Zeto New Energy
Additional Benefits:
- The market estimate (ME) sheet in Excel format
- 3 months of analyst support
TABLE OF CONTENTS
1 Introduction
- 1.1 Study Assumptions & Market Definition
- 1.2 Scope of the Study
2 Research Methodology
3 Executive Summary
4 Market Landscape
- 4.1 Market Overview
- 4.2 Market Drivers
- 4.2.1 Surging EV production volumes worldwide
- 4.2.2 Government incentives & local-content rules for battery materials
- 4.2.3 Synthetic-graphite capacity build-out lowering cost curves
- 4.2.4 China's graphite export controls triggering supply-chain diversification
- 4.2.5 OEM shift to high-Si composite anodes for 4680/"Gen 4" cylindrical cells
- 4.2.6 Cell-format migration (prismatic to large-cylindrical) altering anode design specs
- 4.3 Market Restraints
- 4.3.1 Silicon's volumetric-expansion & cycle-life challenges
- 4.3.2 ESG & carbon-footprint scrutiny on synthetic graphite
- 4.3.3 Impending recycling over-capacity curbing virgin-material demand
- 4.3.4 Anode-coating stage still 97 % China-centri; Heightened geopolitical risk
- 4.4 Supply-Chain Analysis
- 4.5 Regulatory Landscape
- 4.6 Technological Outlook
- 4.7 Porter's Five Forces
- 4.7.1 Bargaining Power of Suppliers
- 4.7.2 Bargaining Power of Buyers
- 4.7.3 Threat of New Entrants
- 4.7.4 Threat of Substitutes
- 4.7.5 Intensity of Rivalry
- 4.8 Investment and Funding Analysis
- 4.9 Patent Landscape (Si, Graphite, LTO)
5 Market Size & Growth Forecasts
- 5.1 By Battery Material Type
- 5.1.1 Graphite
- 5.1.2 Silicon-Enhanced Graphite (Up to 10 % Si)
- 5.1.3 High-Silicon (Above 10 % Si) and SiOx
- 5.1.4 Lithium Titanate (LTO)
- 5.1.5 Other Advanced (Hard-Carbon, CNT-Doped, Graphene)
- 5.2 By Cell Format
- 5.2.1 Cylindrical
- 5.2.2 Prismatic
- 5.2.3 Pouch
- 5.3 By Vehicle Type
- 5.3.1 Passenger Cars
- 5.3.2 Light Commercial Vehicles
- 5.3.3 Medium and Heavy Trucks
- 5.3.4 Buses and Coaches
- 5.3.5 Two and Three-wheelers
- 5.3.6 Off-Highway and Specialty EVs
- 5.4 By Geography
- 5.4.1 North America
- 5.4.1.1 United States
- 5.4.1.2 Canada
- 5.4.1.3 Mexico
- 5.4.2 Europe
- 5.4.2.1 Germany
- 5.4.2.2 United Kingdom
- 5.4.2.3 France
- 5.4.2.4 Italy
- 5.4.2.5 Spain
- 5.4.2.6 NORDIC Countries
- 5.4.2.7 Russia
- 5.4.2.8 Rest of Europe
- 5.4.3 Asia-Pacific
- 5.4.3.1 China
- 5.4.3.2 India
- 5.4.3.3 Japan
- 5.4.3.4 South Korea
- 5.4.3.5 ASEAN Countries
- 5.4.3.6 Australia and New Zealand
- 5.4.3.7 Rest of Asia Pacific
- 5.4.4 South America
- 5.4.4.1 Brazil
- 5.4.4.2 Argentina
- 5.4.4.3 Rest of South America
- 5.4.5 Middle East and Africa
- 5.4.5.1 Saudi Arabia
- 5.4.5.2 South Africa
- 5.4.5.3 Rest of Middle East and Africa
- 5.4.1 North America
6 Competitive Landscape
- 6.1 Market Concentration
- 6.2 Strategic Moves (M&A, Partnerships, PPAs)
- 6.3 Market Share Analysis (Market Rank/Share for key companies)
- 6.4 Company Profiles (includes Global level Overview, Market level overview, Core Segments, Financials as available, Strategic Information, Products & Services, and Recent Developments)
- 6.4.1 Mitsubishi Chemical Group
- 6.4.2 BTR New Material Group
- 6.4.3 Shanshan Corporation
- 6.4.4 Putailai New Energy (PTL)
- 6.4.5 LG Chem Ltd / LG Energy Solution
- 6.4.6 Tokai Carbon Co. Ltd
- 6.4.7 Nippon Carbon Co. Ltd
- 6.4.8 Resonac Holdings (Showa Denko)
- 6.4.9 Targray Industries Inc.
- 6.4.10 NEI Corporation
- 6.4.11 Nexeon Ltd
- 6.4.12 Sionic Energy
- 6.4.13 Sila Nanotechnologies
- 6.4.14 Group14 Technologies
- 6.4.15 POSCO Future M
- 6.4.16 Syrah Resources Ltd
- 6.4.17 NOVONIX Ltd
- 6.4.18 Amprius Technologies
- 6.4.19 JFE Chemical Corporation
- 6.4.20 Hunan Zeto New Energy
7 Market Opportunities & Future Outlook
- 7.1 White-Space & Unmet-Need Assessment

 電動車電池陽極市場-全球產業規模、佔有率、趨勢、機會和預測(按電池類型、材料類型、地區和競爭細分,2020-2030 年)
 中國電動汽車電池陽極:市場佔有率分析、產業趨勢/統計、成長預測(2025-2030)亞太地區電動汽車電池陽極:市場佔有率分析、產業趨勢與成長預測(2025-2030)東協電動車電池陽極:市場佔有率分析、產業趨勢、成長預測(2025-2030)歐洲電動車電池負極:市場佔有率分析、產業趨勢/統計、成長預測(2025-2030)美國電動汽車電池負極:市場佔有率分析、產業趨勢及成長預測(2025-2030)義大利電動汽車電池負極:市場佔有率分析、產業趨勢、成長預測(2025-2030)英國電動車電池負極:市場佔有率分析、產業趨勢及成長預測(2025-2030)