


 |
市場調查報告書
商品編碼
2125644
環境諮詢:市場佔有率分析、產業趨勢與統計、成長預測(2026-2031)Environmental Consulting - Market Share Analysis, Industry Trends & Statistics, Growth Forecasts (2026 - 2031) |
||||||

※ 本網頁內容可能與最新版本有所差異。詳細情況請與我們聯繫。
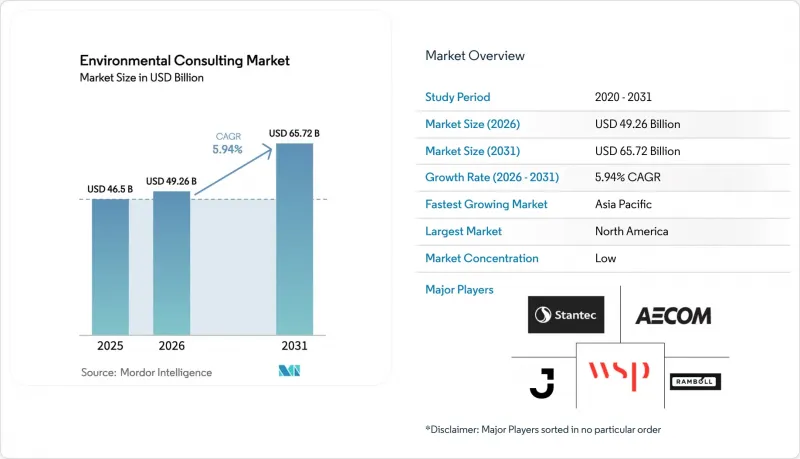
2025 年環境諮詢市場價值 465 億美元,預計到 2031 年將達到 657.2 億美元,而 2026 年為 492.6 億美元,預測期(2026-2031 年)複合年成長率為 5.94%。
本報告按服務類型(氣候變遷諮詢、環境健康安全、環境影響評估、水和污水管理等)、最終用戶產業(能源電力、礦業和金屬、公共部門、製造業等)以及地區進行細分。市場預測以美元計價。
全球環境諮詢市場趨勢與洞察
經合組織和二十國集團國家氣候政策的合規義務
氣候變遷法規的統一化正促使諮詢需求從一次性項目轉向標準化、可重複的服務模式。經合組織更新後的環境績效評估報告呼籲制定量化的脫碳路線圖,而碳邊境調節機制的引入則催生了對跨境供應鏈檢驗的需求。諮詢公司透過在多個司法管轄區部署單一的調查方法,降低了客製化成本並擴大了基本客群。隨著合規性從自願轉向強制,服務流程變得更加可預測,從而能夠進行長期資源規劃並投資於數位化交付平台。
企業淨零排放及ESG資訊揭露義務
歐盟的《企業永續發展報告指令》將於2024年起適用於超過5萬家公司,強制要求揭露比以往自願性指南更為詳細的環境資訊。許多公司缺乏內部專業知識來使其業務活動與分類標準保持一致,導致諮詢訂單出現數年的延誤。美國證券交易委員會(SEC)和其他監管機構正在考慮類似的規則,這在全球範圍內引發了類似的需求模式。因此,環境諮詢市場的關係正在從短期合規工作轉向持續的策略夥伴關係關係,包括情境建模和品質保證準備。
框架協議導致持續的費用壓力
企業買家正透過簽訂包含年度成本削減條款的多年期合約來整合供應商。常規合規工作日趨同質化,迫使顧問公司多元化經營專業化、高價值的細分領域,例如全氟烷基物質 (PFAS) 治理和「自然友善」會計。大型公司試圖透過規模經濟和交叉銷售來維持利潤率,而小規模的精品顧問公司則根據其獨特的技術專長設定高價。
細分市場分析
到2025年,環境影響評估將佔環境諮詢市場的30.25%,反映出其在各主要經濟領域的專案授權中發揮著舉足輕重的作用。儘管環境影響評估規模龐大,但標準化的數位化工作流程縮短了現場工作週期,從而對收費水平造成了壓力。同時,受資訊揭露要求(即持續參與而非基於專案的工作)的推動,ESG報告和永續發展策略預計將以6.12%的複合年成長率成長。隨著轉型路徑建模成為董事會層面的優先事項,氣候變遷諮詢市場正在擴張,諮詢顧問也正在確立其在資本配置方面的策略顧問地位。
水和污水管理產業正受益於基礎設施獎勵策略和新的污染物法規,例如美國環保署改進的鉛和銅法規,這些措施將在2030年前創造價值450億美元的可實施項目。專門從事全氟烷基物質(PFAS)修復的顧問公司正在承接需要水文地質學專業知識和複雜處理設計能力的複雜多年專案。同時,人工智慧驅動的污染場地評估正在縮短傳統的現場調查時間,並在數據分析和遙感探測解譯方面開闢新的收入來源。
區域分析
預計到2025年,北美將佔據環境諮詢市場35.53%的佔有率,這主要得益於對影響評估和修復的穩定需求,以及諸如《國家環境政策法案》(NEPA)等成熟的法規的支持。聯邦政府的基礎設施建設方案透過增加專注於氣候適應能力、水系統和電網更新的長期項目,提升了收入前景。各州正在醞釀的氣候資訊揭露法案也進一步拓展了諮詢計畫管道。
預計到2031年,亞太地區將以6.31%的複合年成長率推動區域成長。中國的《生態環境法(草案)》統一了分散的法規,並鼓勵工業企業尋求標準化的諮詢支援。印度的可再生能源目標以及透過「印度製造」計畫擴大製造業規模,增加了對環境授權的需求;與此同時,東南亞國家正在引入碳定價和ESG(環境、社會和治理)報告框架。擁有本地法規專業知識和全球技術資源的顧問公司正在獲得先發優勢。
在歐洲,歐盟分類法和企業永續發展報告指令維持了強勁的發展勢頭,這兩項法規將數千家公司的資訊揭露義務制度化。顧問公司正將其經驗應用於採用類似框架的司法管轄區,從而將歐洲的專業知識轉化為全球競爭優勢。在中東和非洲地區,一些地區受益於大型企劃和新的水資源短缺應對措施,實現了強勁成長,但監管執法力度不足正在減緩市場發展勢頭。拉丁美洲受益於不斷擴大的採礦投資和可再生能源發展,但仍面臨政治不穩定和冗長的核准流程。
其他好處:
- Excel格式的市場預測(ME)表
- 3個月的分析師支持
目錄
第1章:引言
- 研究假設和市場定義
- 調查範圍
第2章:調查方法
第3章執行摘要
第4章 市場狀況
- 市場概覽
- 市場促進因素
- 經合組織和二十國集團國家氣候政策的合規義務
- 公司必須遵守淨零排放和ESG資訊揭露規定。
- 綠色債券和轉型債券的成長需要第三方檢驗。
- 工業脫碳基金與諮詢費掛鉤。
- 人工智慧驅動的快速場地特徵評估工具可縮短實質審查時間。
- 一種「對自然有利」的影響核算框架已經出現。
- 市場限制因素
- 框架協議導致持續的費用壓力
- 新興市場大型基礎設施項目授權延誤
- 合格的水文地質學家和毒理學家短缺
- 客戶遷移至內部數位化EHS平台
- 監理情勢
- 技術展望
- 波特五力分析
- 宏觀經濟衝擊的影響
第5章 市場規模與成長預測
- 按服務類型
- 氣候變遷諮詢
- EHS
- 環境影響評估
- 用水和污水管理
- ESG報告與永續發展策略
- 其他服務類型
- 按最終用戶行業分類
- 能源與電力
- 採礦和金屬
- 公部門
- 製造業
- 製藥
- 其他終端使用者產業(建築/基礎設施、交通運輸等)
- 按地區
- 北美洲
- 美國
- 加拿大
- 墨西哥
- 南美洲
- 巴西
- 阿根廷
- 其他南美國家
- 歐洲
- 德國
- 英國
- 法國
- 義大利
- 西班牙
- 波蘭
- 俄羅斯
- 其他歐洲國家
- 亞太地區
- 中國
- 印度
- 日本
- 韓國
- 澳洲
- 其他亞太國家
- 中東和非洲
- 中東
- 沙烏地阿拉伯
- 阿拉伯聯合大公國
- 土耳其
- 其他中東國家
- 非洲
- 南非
- 奈及利亞
- 埃及
- 其他非洲國家
- 中東
- 北美洲
第6章 競爭情勢
- 市場集中度
- 策略趨勢
- 市佔率分析
- 公司簡介
- Jacobs Solutions Inc.
- AECOM
- WSP Global Inc.
- Tetra Tech, Inc.
- Stantec Inc.
- Ramboll Group A/S
- ERM International Group Limited
- Arup Group Limited
- GHD Group Pty Ltd
- Sweco AB
- Arcadis NV
- John Wood Group PLC(Wood)
- SNC-Lavalin Group Inc.(AtkinsRealis)
- HDR, Inc.
- SLR Consulting Limited
- Antea Group NV
- Mott MacDonald Group Limited
- Montrose Environmental Group, Inc.
- Brown and Caldwell, Inc.
- Worley Limited
- ICF International, Inc.
- EA Engineering, Science and Technology, Inc., PBC
- Cardno Limited
- Golder Associates Ltd.
第7章 市場機會與未來展望
According to Mordor Intelligence, the environmental consulting market size was valued at USD 46.50 billion in 2025 and estimated to grow from USD 49.26 billion in 2026 to reach USD 65.72 billion by 2031, at a CAGR of 5.94% during the forecast period (2026-2031).
This report is Segmented by Service Type (Climate Change Consulting, EHS, Environmental Impact Assessment, Water and Wastewater Management, and More), End-User Industry (Energy and Power, Mining and Metals, Public Sector, Manufacturing, and More), and Geography. The Market Forecasts are Provided in Terms of Value (USD).
Global Environmental Consulting Market Trends and Insights
Mandatory Climate-Policy Compliance in OECD and G20 Economies
Converging climate rules transform consulting demand into a standardized, repeatable service line rather than episodic project work. Updated OECD Environmental Performance Reviews require quantified decarbonization pathways, while carbon-border adjustment mechanisms introduce supply-chain verification needs that transcend national boundaries.Consulting firms deploy single methodological frameworks across multiple jurisdictions, lowering customization costs and enlarging their client base. As compliance shifts from voluntary to mandatory, service pipelines become more predictable, enabling long-term resource planning and investment in digital delivery platforms.
Corporate Net-Zero and ESG Disclosure Mandates
The EU Corporate Sustainability Reporting Directive applies to more than 50,000 companies starting in 2024, compelling detailed environmental disclosures that exceed prior voluntary guidelines. Many firms lack in-house expertise to map operations to taxonomy criteria, producing a multi-year backlog of advisory assignments. Similar rules under consideration by the U.S. Securities and Exchange Commission and other regulators extend the same demand pattern globally. Consequently, environmental consulting market relationships migrate from short-term compliance engagements to continuous strategic partnerships that include scenario modeling and assurance readiness.
Persistent Fee-Pressure from Framework Contracts
Corporate buyers consolidate vendors under multiyear frameworks that embed annual cost-down clauses. Routine compliance tasks become commoditized, forcing consultants to diversify toward specialized, high-value niches such as PFAS remediation or nature-positive accounting. Larger firms leverage scale and cross-selling to defend margins, whereas smaller boutiques rely on unique technical depth to command premium rates.
Other drivers and restraints analyzed in the detailed report include:
- Growth of Green and Transition Bonds Requiring 3rd-Party Verification
- Industrial Decarbonization Funds Tied to Advisory Spend
- Delayed Permitting for Large Infrastructure in Emerging Markets
For complete list of drivers and restraints, kindly check the Table Of Contents.
Segment Analysis
Environmental Impact Assessment captured 30.25% of the environmental consulting market in 2025, reflecting its entrenched role in project permitting across every major economy. Despite its scale, fee rates face pressure as standardized digital workflows shorten field programs. Conversely, ESG Reporting and Sustainability Strategy is forecast to increase at a 6.12% CAGR, propelled by mandatory disclosure rules that necessitate continuous rather than project-based engagement. The environmental consulting market size for climate-change consulting accelerates as transition pathway modeling becomes a board-level priority, positioning consultants as strategic advisors on capital allocation.
Water and wastewater management benefits from infrastructure stimulus and new contaminant regulations such as the EPA Lead and Copper Rule Improvements, which unlock USD 45 billion of addressable projects through 2030. Consultants specializing in PFAS remediation secure complex, multi-year assignments requiring hydrogeological expertise and advanced treatment design. Meanwhile, AI-driven contaminated-site assessment compresses traditional fieldwork yet opens new revenue streams in data analytics and remote sensing interpretation.
Complete Report Scope:
- By Service Type
- Climate Change Consulting
- EHS
- Environmental Impact Assessment
- Water and Wastewater Management
- ESG Reporting and Sustainability Strategy
- Other Service Types (Includes Contaminated Site Assessment)
- By End-User Industry
- Energy and Power
- Mining and Metals
- Public Sector
- Manufacturing
- Pharmaceuticals
- Other End-user Industries (Construction and Infrastructure, Transportation, etc.)
- By Geography
- North America
- United States
- Canada
- Mexico
- South America
- Brazil
- Argentina
- Rest of South America
- Europe
- Germany
- United Kingdom
- France
- Italy
- Spain
- Poland
- Russia
- Rest of Europe
- Asia Pacific
- China
- India
- Japan
- South Korea
- Australia
- Rest of Asia Pacific
- Middle East and Africa
- Middle East
- Saudi Arabia
- United Arab Emirates
- Turkey
- Rest of Middle East
- Africa
- South Africa
- Nigeria
- Egypt
- Rest of Africa
- Middle East
- North America
Geography Analysis
North America held 35.53% of environmental consulting market share in 2025, leveraging mature rules such as the National Environmental Policy Act that underpin steady demand for impact assessments and remediation. Federal infrastructure packages add long-cycle projects focused on climate resilience, water systems, and grid renewal, enhancing revenue visibility. Emerging state-level climate disclosure bills further amplify advisory pipelines.
Asia-Pacific leads regional growth at a 6.31% CAGR through 2031. China's draft Ecological and Environmental Code consolidates fragmented regulations, compelling industrial operators to seek standardized consulting support. India's renewable-energy targets and Make-in-India manufacturing expansion elevate demand for environmental permitting, while Southeast Asian countries adopt carbon-pricing and ESG reporting frameworks. Consultants with local regulatory fluency and global technical resources gain first-mover advantage.
Europe maintains robust activity through the EU Taxonomy and Corporate Sustainability Reporting Directive, which institutionalize disclosure obligations for thousands of firms. Consultants export their experience to jurisdictions adopting similar frameworks, transforming European expertise into a global competitive asset. Middle East and Africa present pockets of high growth tied to megaprojects and emerging water scarcity solutions, though uneven regulatory enforcement tempers market velocity. Latin America benefits from mining investments and renewable build-out but continues to battle political volatility and elongated permitting.
- Jacobs Solutions Inc.
- AECOM
- WSP Global Inc.
- Tetra Tech, Inc.
- Stantec Inc.
- Ramboll Group A/S
- ERM International Group Limited
- Arup Group Limited
- GHD Group Pty Ltd
- Sweco AB
- Arcadis N.V.
- John Wood Group PLC (Wood)
- SNC-Lavalin Group Inc. (AtkinsRealis)
- HDR, Inc.
- SLR Consulting Limited
- Antea Group N.V.
- Mott MacDonald Group Limited
- Montrose Environmental Group, Inc.
- Brown and Caldwell, Inc.
- Worley Limited
- ICF International, Inc.
- EA Engineering, Science, and Technology, Inc., PBC
- Cardno Limited
- Golder Associates Ltd.
Additional Benefits:
- The market estimate (ME) sheet in Excel format
- 3 months of analyst support
TABLE OF CONTENTS
1 INTRODUCTION
- 1.1 Study Assumptions and Market Definition
- 1.2 Scope of the Study
2 RESEARCH METHODOLOGY
3 EXECUTIVE SUMMARY
4 MARKET LANDSCAPE
- 4.1 Market Overview
- 4.2 Market Drivers
- 4.2.1 Mandatory Climate-Policy Compliance in OECD and G20 Economies
- 4.2.2 Corporate Net-Zero and ESG Disclosure Mandates
- 4.2.3 Growth of Green and Transition Bonds Requiring 3rd-Party Verification
- 4.2.4 Industrial Decarbonisation Funds Tied to Advisory Spend
- 4.2.5 AI-Enabled Rapid Site-Characterisation Tools Cut Due-Diligence Time
- 4.2.6 "Nature-Positive" Impact Accounting Frameworks Emerge
- 4.3 Market Restraints
- 4.3.1 Persistent Fee-Pressure from Framework Contracts
- 4.3.2 Delayed Permitting for Large Infrastructure in Emerging Markets
- 4.3.3 Scarcity of Licensed Hydro-geologists and Toxicologists
- 4.3.4 Client Shift to In-House Digital EHS Platforms
- 4.4 Regulatory Landscape
- 4.5 Technological Outlook
- 4.6 Porter's Five Forces Analysis
- 4.6.1 Threat of New Entrants
- 4.6.2 Bargaining Power of Suppliers
- 4.6.3 Bargaining Power of Buyers
- 4.6.4 Threat of Substitutes
- 4.6.5 Intensity of Competitive Rivalry
- 4.7 Impact of Macroeconomic Shocks
5 MARKET SIZE AND GROWTH FORECASTS (VALUE)
- 5.1 By Service Type
- 5.1.1 Climate Change Consulting
- 5.1.2 EHS
- 5.1.3 Environmental Impact Assessment
- 5.1.4 Water and Wastewater Management
- 5.1.5 ESG Reporting and Sustainability Strategy
- 5.1.6 Other Service Types (Includes Contaminated Site Assessment)
- 5.2 By End-User Industry
- 5.2.1 Energy and Power
- 5.2.2 Mining and Metals
- 5.2.3 Public Sector
- 5.2.4 Manufacturing
- 5.2.5 Pharmaceuticals
- 5.2.6 Other End-user Industries (Construction and Infrastructure, Transportation, etc.)
- 5.3 By Geography
- 5.3.1 North America
- 5.3.1.1 United States
- 5.3.1.2 Canada
- 5.3.1.3 Mexico
- 5.3.2 South America
- 5.3.2.1 Brazil
- 5.3.2.2 Argentina
- 5.3.2.3 Rest of South America
- 5.3.3 Europe
- 5.3.3.1 Germany
- 5.3.3.2 United Kingdom
- 5.3.3.3 France
- 5.3.3.4 Italy
- 5.3.3.5 Spain
- 5.3.3.6 Poland
- 5.3.3.7 Russia
- 5.3.3.8 Rest of Europe
- 5.3.4 Asia Pacific
- 5.3.4.1 China
- 5.3.4.2 India
- 5.3.4.3 Japan
- 5.3.4.4 South Korea
- 5.3.4.5 Australia
- 5.3.4.6 Rest of Asia Pacific
- 5.3.5 Middle East and Africa
- 5.3.5.1 Middle East
- 5.3.5.1.1 Saudi Arabia
- 5.3.5.1.2 United Arab Emirates
- 5.3.5.1.3 Turkey
- 5.3.5.1.4 Rest of Middle East
- 5.3.5.2 Africa
- 5.3.5.2.1 South Africa
- 5.3.5.2.2 Nigeria
- 5.3.5.2.3 Egypt
- 5.3.5.2.4 Rest of Africa
- 5.3.5.1 Middle East
- 5.3.1 North America
6 COMPETITIVE LANDSCAPE
- 6.1 Market Concentration
- 6.2 Strategic Moves
- 6.3 Market Share Analysis
- 6.4 Company Profiles (includes Global level Overview, Market level overview, Core Segments, Financials as available, Strategic Information, Market Rank/Share for key companies, Products and Services, and Recent Developments)
- 6.4.1 Jacobs Solutions Inc.
- 6.4.2 AECOM
- 6.4.3 WSP Global Inc.
- 6.4.4 Tetra Tech, Inc.
- 6.4.5 Stantec Inc.
- 6.4.6 Ramboll Group A/S
- 6.4.7 ERM International Group Limited
- 6.4.8 Arup Group Limited
- 6.4.9 GHD Group Pty Ltd
- 6.4.10 Sweco AB
- 6.4.11 Arcadis N.V.
- 6.4.12 John Wood Group PLC (Wood)
- 6.4.13 SNC-Lavalin Group Inc. (AtkinsRealis)
- 6.4.14 HDR, Inc.
- 6.4.15 SLR Consulting Limited
- 6.4.16 Antea Group N.V.
- 6.4.17 Mott MacDonald Group Limited
- 6.4.18 Montrose Environmental Group, Inc.
- 6.4.19 Brown and Caldwell, Inc.
- 6.4.20 Worley Limited
- 6.4.21 ICF International, Inc.
- 6.4.22 EA Engineering, Science, and Technology, Inc., PBC
- 6.4.23 Cardno Limited
- 6.4.24 Golder Associates Ltd.
7 MARKET OPPORTUNITIES AND FUTURE OUTLOOK
- 7.1 White-Space and Unmet-Need Assessment

 環境諮詢服務市場-2026-2032年全球市場預測
 建築與自然環境諮詢市場規模、佔有率及成長分析:依服務類型、最終用途、組織規模、通路與地區分類-2026-2033年產業預測
 2026年全球健康、安全與環境(HSE)諮詢與培訓服務市場報告2026年全球建築與自然環境諮詢市場報告2026年全球環境管理、合規和實質審查市場報告2026年全球環境諮詢服務市場報告海洋環境模擬設備市場:按設備類型、模擬環境、技術和最終用戶分類,全球預測(2026-2032)
 全球監理實質審查市場展望、詳細分析及至2032年預測地質諮詢服務市場:依服務類型、產業垂直領域、市場技術、應用與客戶類型分類-全球預測,2026-2032年醫療保健實質審查服務市場按服務類型、交付模式、應用、產業和最終用戶分類,全球預測(2026-2032年)