


 |
市場調查報告書
商品編碼
2125503
硬碟機(HDD):市場佔有率分析、產業趨勢與統計資料、成長預測(2026-2031)Hard Disk Drive (HDD) - Market Share Analysis, Industry Trends & Statistics, Growth Forecasts (2026 - 2031) |
||||||

※ 本網頁內容可能與最新版本有所差異。詳細情況請與我們聯繫。
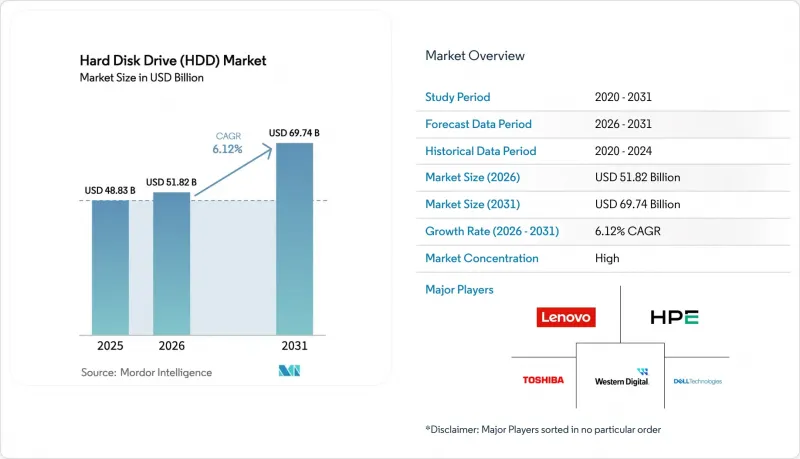
根據 Mordor Intelligence 估計,到 2026 年,硬碟 (HDD) 市值將達到 518.2 億美元,高於 2025 年的 488.3 億美元,預計到 2031 年將達到 697.4 億美元。
預計 2026 年至 2031 年的複合年成長率為 6.12%。
本報告外形規格(2.5吋、3.5吋、其他)、應用領域(行動/可攜式、消費級桌面/遊戲、其他)、儲存容量(5TB)、介面(SATA、SAS、PCIe/NVMe)、終端用戶產業(IT/通訊、其他)、錄製技術(CMR/PMR、SMR、HAMR/能量輔助)和地區進行細分。市場預測以美元計價。
全球硬碟 (HDD) 市場趨勢與洞察
對超大規模和雲端儲存容量的需求日益成長
到2024年底,超大規模資料中心的數量將達到1,136個,預計到2030年將成長三倍,因為人工智慧加速器正在重塑運算環境。儲存將占主要雲端服務供應商2025年資本支出計畫的約五分之一,數十億美元將投資於超高容量機架,這將使硬碟在冷層部署中佔據主導地位。西部數據預測,從2024年到2028年,硬碟的出貨量(Exabyte)將成長23%,主要得益於HAMR技術帶來的記錄密度提升。美國佔超大規模部署容量的54%,但當地的電力限制更有利於每Terabyte能源效率更高的硬碟。目前,分離式架構將運算和儲存分開,硬碟處理海量冷資料池,而固態硬碟則管理對熱資料的存取。
在近線工作負載方面,固態硬碟相比固態硬碟具有每TB成本優勢
希捷報告稱,其在2024會計年度出貨的398EBExabyte硬碟,每Terabyte的成本將達到15美元,與企業級固態硬碟相比,成本差異預計仍保持在2.5倍左右。在Terabyte容量範圍內,此價格差異擴大到約3-4倍,進一步鞏固了硬碟在成本敏感型冷資料儲存領域的市場主導地位。儘管快閃記憶體製造商透過3D NAND的微型化不斷降低每Terabyte的成本,但由於壽命和寫入成本的限制,硬碟在連續式工作負載的總體擁有成本(TCO)方面仍然更具優勢。企業負責人正擴大採用混合策略,將高效能固態硬碟與大規模容量硬碟結合,以最佳化支出並滿足服務水準目標。
SSD 每 TB 成本的快速下降以及企業級快閃記憶體的整體擁有成本優勢。
快閃記憶體廠商目前正在生產232層3D NAND快閃記憶體,每位元成本逐季下降。 Pure Storage從超大規模資料中心業者營運商獲得的訂單凸顯了這樣一個場景:考慮到節能、散熱和安裝空間方面的節省,閃存在總體擁有成本方面變得極具吸引力。 61.44TB企業級固態硬碟的訂單雖然價格昂貴,但也預示著容量方面的融合趨勢。 QLC NAND快閃記憶體有望進一步降低每個位元成本,但其壽命限制使其僅適用於讀取密集型工作負載。隨著企業負責人日益採用整體採購觀點,機械硬碟必須繼續以超過快閃記憶體的速度提升容量,才能縮小與快閃記憶體的成本差距。
細分市場分析
預計到2025年,3.5吋硬碟產品將佔總銷售量的65.62%,並在2031年以9.29%的複合年成長率超越整體硬碟市場。其大尺寸盤片在每機架容量方面表現卓越,使其成為超大規模資料中心營運商的關鍵選擇,因為這些資料中心的占地面積成本預計高達每平方英尺數千美元。預計到2031年,3.5吋硬碟市場規模將超過452億美元。 HAMR和UltraSMR技術的進步正使供應商能夠制定在同一機殼內實現40TB容量的藍圖,從而進一步提升該領域的規模經濟效益。
尺寸較小的 2.5 吋硬碟適用於筆記型電腦和小型伺服器,但隨著固態硬碟 (SSD) 的日益普及,其成長前景有限。 1.8 吋以下的外形規格應用於小眾消費性電子產品和工業設備。採用 3.5 吋平台的高密度 JBOD底盤在冷端架構中保持了成本優勢,因為它可以用更少的硬碟位元實現Exabyte級容量。希捷近期在日本市場以消費級價格推出 20TB 和 24TB 的 BarraCuda 產品,凸顯了其對大容量 3.5 吋產品的持續投入。
預計到2025年,近線企業環境將占到總出貨量的44.10%,複合年成長率(CAGR)為9.52%,在關鍵工作負載中成長率最高。雲端架構師正在將不斷成長的AI訓練集整合到低成本、高密度的儲存層中,這使得硬碟(HDD)市場在Petabyte級叢集集中繼續佔據核心地位。麥肯錫預測的冷數據激增將推動HDD在近線應用中的市佔率成長,這與HDD在連續式寫入和經濟儲存方面的優勢相吻合。
消費性桌上型電腦和遊戲電腦正穩定地向固態硬碟 (SSD) 遷移,1TB 以下入門級 SSD 的需求正在下降。另一方面,監控陣列和 NAS 設備的需求仍然強勁,因為它們的寫入模式和容量需求非常適合磁性媒體。儘管企業資料中心團隊仍在繼續部署 SSD 和 HDD 共存的解耦模型,但預計未來十年近線層 SSD 的絕對成長率(Exabyte單位)將最高。
區域分析
亞太地區預計在2025年佔全球銷售額的36.10%,並預計到2031年將以6.84%的複合年成長率成長。中國和日本正透過擴建超大規模資料中心和向國內原始設備製造商(OEM)供貨來支撐區域需求,而泰國在西部數據公司於2024年8月獲批6.93億美元的擴建計劃後,繼續保持其作為製造地的地位。在印度,受電子商務和在家工作趨勢持續成長的推動,2024年第二季出貨量較上季成長Exabyte%。東南亞各地智慧城市預算,包括馬來西亞170億美元的資料中心和監控項目,進一步推動了該地區對EB級數據的需求。
北美擁有全球第二大市場規模,這主要得益於美國超大規模營運商,它們佔據了全球54%的雲端容量。儘管貿易政策造成了成本的不確定性,但提案的激勵措施有望鼓勵國內組裝並縮短供應鏈。維吉尼亞資料中心走廊周邊日益嚴峻的電網壓力促使設計人員優先考慮每Terabyte的能效,這使得硬碟(HDD)市場相對於全Flash陣列更具優勢。加拿大和墨西哥則在土地、再生能源和跨境物流方面發揮支持作用。
在歐洲,儘管資料主權要求嚴格,企業仍能持續進行資料更新。德國和英國正在部署冷層叢集以滿足合規性資料保留要求,而法國的公共部門雲端工作負載也在不斷擴展。該地區對循環經濟的重視與供應商的回收計劃相輔相成;例如,西部數據計劃在2024年從價值5萬英鎊的廢棄硬碟中回收稀土元素。長期的碳排放稅討論可能會影響儲存技術的選擇。硬碟製造商正在強調,與競爭性儲存媒體相比,他們的產品在整個生命週期中二氧化碳排放量更低。
其他好處
- Excel格式的市場預測(ME)表
- 3個月的分析師支持
目錄
第1章:引言
- 研究假設和市場定義
- 調查範圍
第2章:調查方法
第3章執行摘要
第4章 市場狀況
- 市場概覽
- 市場促進因素
- 對超大規模和雲端儲存容量的需求不斷成長
- 在近線工作負載方面,固態硬碟相比固態硬碟具有每TB成本優勢
- 隨著智慧城市的發展,影像監控數據量不斷增加。
- 引入人工智慧驅動的冷數據層級結構化方法
- 高容量HAMR藍圖的目標是支援高達50TB的硬碟
- 透過循環經濟回收計畫降低物料清單成本
- 市場限制因素
- SSD 每 TB 成本的快速下降以及企業級快閃記憶體的整體擁有成本優勢。
- 供應商高度集中和供應鏈中斷
- 未來對高能耗硬碟生產碳排放稅
- 機架密度限制有利於基於快閃記憶體的架構
- 價值供應鏈分析
- 監理情勢
- 技術展望
- 波特五力分析
- 宏觀經濟影響評估
第5章 市場規模與成長預測
- 按外形規格
- 2.5英寸
- 3.5英寸
- 其他(小於 1.8 英寸,企業級 JBOD)
- 透過使用
- 行動/可攜式
- 消費級桌上遊戲
- NAS/SOHO
- 企業資料中心
- 近線冷數據
- 智慧城市監測
- 按儲存容量
- 小於1TB
- 1~3TB
- 3~5TB
- 超過5TB
- 透過介面
- SATA
- SAS
- PCIe/NVMe(U.2、U.3)
- 按最終用戶行業分類
- IT/通訊
- 家用電器OEM廠商
- 雲端超大規模供應商
- 工業視訊監控
- 政府/國防
- 透過記錄技術
- CMR/PMR
- SMR
- HAMR能量輔助系統
- 按地區
- 北美洲
- 美國
- 加拿大
- 墨西哥
- 歐洲
- 德國
- 英國
- 法國
- 俄羅斯
- 其他歐洲國家
- 亞太地區
- 中國
- 日本
- 印度
- 韓國
- 澳洲
- 其他亞太國家
- 中東和非洲
- 中東
- 沙烏地阿拉伯
- 阿拉伯聯合大公國
- 其他中東國家
- 非洲
- 南非
- 埃及
- 其他非洲地區
- 中東
- 南美洲
- 巴西
- 阿根廷
- 南美洲其他地區
- 北美洲
第6章 競爭情勢
- 市場集中度
- 策略趨勢
- 市佔率分析
- 公司簡介
- Western Digital Corporation
- Toshiba Electronic Devices & Storage Corporation
- Hewlett Packard Enterprise Company
- Dell Technologies Inc.
- Lenovo Group Limited
- Huawei Technologies Co., Ltd.
- Transcend Information Inc.
- ADATA Technology Co., Ltd.
- Buffalo Inc.
- Nidec Corporation
- Showa Denko KK
- Hoya Corporation
- NetApp Inc.
- Pure Storage Inc.
- Samsung Electronics Co., Ltd.(external HDD brand)
- Micron Technology Inc.(external storage systems)
- Violin Systems LLC
- Synology Inc.
- QNAP Systems Inc.
- LaCie SAS(Seagate brand)
第7章 市場機會與未來展望
According to Mordor Intelligence, hard disk drive market size in 2026 is estimated at USD 51.82 billion, growing from 2025 value of USD 48.83 billion with 2031 projections showing USD 69.74 billion, growing at 6.12% CAGR over 2026-2031.
This report is Segmented by Form Factor (2. 5-Inch, 3. 5-Inch, Others), Application (Mobile/Portable, Consumer Desktop and Gaming, and More), Storage Capacity (5TB), Interface (SATA, SAS, PCIe/NVMe), End-User Industry (IT and Telecommunications, and More), Recording Technology (CMR/PMR, SMR, HAMR and Energy-Assisted), and Geography. The Market Forecasts are Provided in Terms of Value (USD).
Global Hard Disk Drive (HDD) Market Trends and Insights
Rising Demand for Hyperscale and Cloud Storage Capacity
Hyperscale data-center count reached 1,136 at year-end 2024 and is projected to triple by 2030 as AI accelerators reshape computing footprints. Storage represents roughly one-fifth of the 2025 capex plans of major cloud operators, channeling billions into very-large-capacity racks that favor the Hard Disk Drive market for cold-tier deployments. Exabyte shipments of HDDs are forecast by Western Digital to grow at 23% between 2024 and 2028, driven primarily by HAMR-enabled density gains. The United States holds 54% of installed hyperscale capacity, yet local power constraints reward drives that deliver superior watts-per-terabyte performance. Disaggregated architectures now separate compute from storage, letting HDDs handle vast cold data pools while SSDs manage hot data access.
Cost/TB Advantage Over SSDs in Near-line Workloads
Seagate reported achieving USD 15 per terabyte across 398 exabytes shipped in fiscal 2024, preserving an estimated 2.5X cost gap against enterprise SSDs. At 30 TB capacity points, the price delta widens to roughly 3-4X, reinforcing the Hard Disk Drive market in cost-sensitive cold-data tiers. Flash manufacturers continue lowering dollars-per-terabyte through 3D NAND scaling, yet endurance and write-cost constraints keep total-cost-of-ownership favorable to drives for sequential-heavy workloads. Enterprise buyers increasingly articulate hybrid strategies that blend high-performance SSD tiers with large pools of HDD capacity to optimize spend and service-level objectives.
Rapid SSD $/TB Declines and Enterprise Flash TCO Gains
Flash vendors now produce 232-layer 3D NAND, pushing bit costs lower each quarter. Pure Storage's design wins at hyperscalers highlight scenarios where flash achieves compelling total cost when energy, cooling, and floor space savings are lumped into the equation. The arrival of 61.44 TB enterprise SSDs signals capacity convergence, albeit at a premium price. QLC NAND promises further dollar-per-bit gains, yet endurance constraints confine such products to read-heavy workloads. As corporate buyers increasingly adopt a holistic procurement lens, HDDs must continue to elevate capacity faster than flash narrows its cost gap.
Other drivers and restraints analyzed in the detailed report include:
- Growth of Video-Surveillance Data for Smart-City Roll-outs
- AI-Driven Cold-Data Tiering Adoption
- Extreme Supplier Concentration and Supply-Chain Shocks
For complete list of drivers and restraints, kindly check the Table Of Contents.
Segment Analysis
3.5-inch units delivered 65.62% revenue in 2025, outpacing the overall Hard Disk Drive market with a 9.29% CAGR to 2031. Their large platters enable superior gigabytes-per-rack metrics, critical for hyperscale operators that price floor space in thousands of dollars per square foot. The Hard Disk Drive market size for 3.5-inch products is projected to eclipse USD 45.2 billion by 2031. HAMR and UltraSMR advances let vendors roadmap 40 TB on the same envelope, reinforcing the segment's scale economics.
Smaller 2.5-inch drives cater to notebooks and compact servers but face SSD substitution, limiting growth prospects. Sub-1.8-inch form factors occupy niche consumer electronics and industrial gear. High-density JBOD chassis relying on 3.5-inch platforms retain cost leadership in cold-tier architectures because fewer spindles meet exabyte targets. Seagate's recent Japan launch of 20 TB and 24 TB BarraCuda SKUs at consumer-friendly pricing underscores continued investment in the high-capacity 3.5-inch roadmap.
Near-line enterprise environments garnered 44.10% of 2025 shipments and will grow at a 9.52% CAGR, the fastest among major workloads. Cloud architects funnel expanding AI training sets onto low-cost, high-density tiers, keeping the Hard Disk Drive market central to petabyte-scale clusters. The Hard Disk Drive market share for near-line roles benefits from the cold-data swell forecast by McKinsey, which aligns with drives' sequential write and economical retention strengths.
Consumer desktop and gaming PCs move steadily to SSD, trimming unit demand for entry drives below 1 TB. Surveillance arrays and NAS devices remain resilient because write patterns and capacity needs suit magnetic media. Enterprise data-center teams continue adopting disaggregated models where SSD and HDD coexist, but the near-line layer commands the highest absolute exabyte growth through the decade.
Complete Report Scope:
- By Form Factor
- 2.5-inch
- 3.5-inch
- Others (<1.8-inch, Enterprise JBOD)
- By Application
- Mobile/Portable
- Consumer Desktop and Gaming
- NAS and SOHO
- Enterprise and Data-Center
- Near-line / Cold-Data
- Surveillance and Smart-City
- By Storage Capacity
- <1 TB
- 1 - 3 TB
- 3 - 5 TB
- >5 TB
- By Interface
- SATA
- SAS
- PCIe / NVMe (U.2, U.3)
- By End-User Industry
- IT and Telecommunications
- Consumer Electronics OEMs
- Cloud and Hyperscale Providers
- Industrial and Video-Surveillance
- Government and Defence
- By Recording Technology
- CMR / PMR
- SMR
- HAMR and Energy-Assisted
- By Geography
- North America
- United States
- Canada
- Mexico
- Europe
- Germany
- United Kingdom
- France
- Russia
- Rest of Europe
- Asia-Pacific
- China
- Japan
- India
- South Korea
- Australia
- Rest of Asia-Pacific
- Middle East and Africa
- Middle East
- Saudi Arabia
- United Arab Emirates
- Rest of Middle East
- Africa
- South Africa
- Egypt
- Rest of Africa
- Middle East
- South America
- Brazil
- Argentina
- Rest of South America
- North America
Geography Analysis
Asia-Pacific commanded 36.10% of global revenue in 2025 and is growing at a 6.84% CAGR through 2031. China and Japan anchor regional demand through hyperscale build-outs and domestic OEM shipments, while Thailand continues as a manufacturing hub with Western Digital's USD 693 million expansion approved in August 2024. India's retail drive volumes expanded 12% quarter-over-quarter in Q2 2024 as e-commerce and home-office trends persisted. Smart-city budgets across Southeast Asia, including Malaysia's USD 17 billion data-center and surveillance programs, intensify regional exabyte uptake.
North America is the second-largest territory, propelled by U.S. hyperscale operators that hold 54% of installed cloud capacity. Trade-policy headwinds inject cost uncertainty, though proposed incentives encourage domestic assembly that could shorten supply chains. Growing power-grid constraints around Virginia's data-center corridor steer architects toward watts-per-terabyte efficiencies that favor the Hard Disk Drive market versus all-flash arrays. Canada and Mexico play supportive roles by providing land, renewable electricity, and cross-border logistics advantages.
Europe maintains consistent enterprise replacement cycles amid stringent data-sovereignty mandates. Germany and the United Kingdom deploy cold-tier clusters to meet compliance retention windows, while France expands public-sector cloud workloads. The region's circular-economy focus dovetails with vendor recycling programs, such as Western Digital's recovery of rare-earth elements from 50,000 pounds of retired drives in 2024. Long-term carbon tax discussions may influence recording-technology choices as HDD makers showcase lower lifecycle CO2 than competing storage media.
- Western Digital Corporation
- Toshiba Electronic Devices & Storage Corporation
- Hewlett Packard Enterprise Company
- Dell Technologies Inc.
- Lenovo Group Limited
- Huawei Technologies Co., Ltd.
- Transcend Information Inc.
- ADATA Technology Co., Ltd.
- Buffalo Inc.
- Nidec Corporation
- Showa Denko K.K.
- Hoya Corporation
- NetApp Inc.
- Pure Storage Inc.
- Samsung Electronics Co., Ltd. (external HDD brand)
- Micron Technology Inc. (external storage systems)
- Violin Systems LLC
- Synology Inc.
- QNAP Systems Inc.
- LaCie S.A.S. (Seagate brand)
Additional Benefits:
- The market estimate (ME) sheet in Excel format
- 3 months of analyst support
TABLE OF CONTENTS
1 INTRODUCTION
- 1.1 Study Assumptions and Market Definition
- 1.2 Scope of the Study
2 RESEARCH METHODOLOGY
3 EXECUTIVE SUMMARY
4 MARKET LANDSCAPE
- 4.1 Market Overview
- 4.2 Market Drivers
- 4.2.1 Rising demand for hyperscale and cloud storage capacity
- 4.2.2 Cost/TB advantage over SSDs in near-line workloads
- 4.2.3 Growth of video-surveillance data for smart-city roll-outs
- 4.2.4 AI-driven cold-data tiering adoption
- 4.2.5 Large-capacity HAMR roadmap up to 50 TB drives
- 4.2.6 Circular-economy recycling programs lowering BOM costs
- 4.3 Market Restraints
- 4.3.1 Rapid SSD $/TB declines and enterprise flash TCO gains
- 4.3.2 Extreme supplier concentration and supply-chain shocks
- 4.3.3 Prospective carbon taxes on energy-intensive HDD output
- 4.3.4 Rack-density limits favouring flash-based architectures
- 4.4 Value / Supply-Chain Analysis
- 4.5 Regulatory Landscape
- 4.6 Technological Outlook
- 4.7 Porter's Five Forces Analysis
- 4.7.1 Threat of New Entrants
- 4.7.2 Bargaining Power of Buyers
- 4.7.3 Bargaining Power of Suppliers
- 4.7.4 Threat of Substitutes
- 4.7.5 Intensity of Competitive Rivalry
- 4.8 Macroeconomic Impact Assessment
5 MARKET SIZE AND GROWTH FORECASTS (VALUE)
- 5.1 By Form Factor
- 5.1.1 2.5-inch
- 5.1.2 3.5-inch
- 5.1.3 Others (<1.8-inch, Enterprise JBOD)
- 5.2 By Application
- 5.2.1 Mobile/Portable
- 5.2.2 Consumer Desktop and Gaming
- 5.2.3 NAS and SOHO
- 5.2.4 Enterprise and Data-Center
- 5.2.5 Near-line / Cold-Data
- 5.2.6 Surveillance and Smart-City
- 5.3 By Storage Capacity
- 5.3.1 <1 TB
- 5.3.2 1 - 3 TB
- 5.3.3 3 - 5 TB
- 5.3.4 >5 TB
- 5.4 By Interface
- 5.4.1 SATA
- 5.4.2 SAS
- 5.4.3 PCIe / NVMe (U.2, U.3)
- 5.5 By End-User Industry
- 5.5.1 IT and Telecommunications
- 5.5.2 Consumer Electronics OEMs
- 5.5.3 Cloud and Hyperscale Providers
- 5.5.4 Industrial and Video-Surveillance
- 5.5.5 Government and Defence
- 5.6 By Recording Technology
- 5.6.1 CMR / PMR
- 5.6.2 SMR
- 5.6.3 HAMR and Energy-Assisted
- 5.7 By Geography
- 5.7.1 North America
- 5.7.1.1 United States
- 5.7.1.2 Canada
- 5.7.1.3 Mexico
- 5.7.2 Europe
- 5.7.2.1 Germany
- 5.7.2.2 United Kingdom
- 5.7.2.3 France
- 5.7.2.4 Russia
- 5.7.2.5 Rest of Europe
- 5.7.3 Asia-Pacific
- 5.7.3.1 China
- 5.7.3.2 Japan
- 5.7.3.3 India
- 5.7.3.4 South Korea
- 5.7.3.5 Australia
- 5.7.3.6 Rest of Asia-Pacific
- 5.7.4 Middle East and Africa
- 5.7.4.1 Middle East
- 5.7.4.1.1 Saudi Arabia
- 5.7.4.1.2 United Arab Emirates
- 5.7.4.1.3 Rest of Middle East
- 5.7.4.2 Africa
- 5.7.4.2.1 South Africa
- 5.7.4.2.2 Egypt
- 5.7.4.2.3 Rest of Africa
- 5.7.4.1 Middle East
- 5.7.5 South America
- 5.7.5.1 Brazil
- 5.7.5.2 Argentina
- 5.7.5.3 Rest of South America
- 5.7.1 North America
6 COMPETITIVE LANDSCAPE
- 6.1 Market Concentration
- 6.2 Strategic Moves
- 6.3 Market Share Analysis
- 6.4 Company Profiles (includes Global level Overview, Market level overview, Core Segments, Financials as available, Strategic Information, Market Rank/Share, Products and Services, Recent Developments)
- 6.4.1 Western Digital Corporation
- 6.4.2 Toshiba Electronic Devices & Storage Corporation
- 6.4.3 Hewlett Packard Enterprise Company
- 6.4.4 Dell Technologies Inc.
- 6.4.5 Lenovo Group Limited
- 6.4.6 Huawei Technologies Co., Ltd.
- 6.4.7 Transcend Information Inc.
- 6.4.8 ADATA Technology Co., Ltd.
- 6.4.9 Buffalo Inc.
- 6.4.10 Nidec Corporation
- 6.4.11 Showa Denko K.K.
- 6.4.12 Hoya Corporation
- 6.4.13 NetApp Inc.
- 6.4.14 Pure Storage Inc.
- 6.4.15 Samsung Electronics Co., Ltd. (external HDD brand)
- 6.4.16 Micron Technology Inc. (external storage systems)
- 6.4.17 Violin Systems LLC
- 6.4.18 Synology Inc.
- 6.4.19 QNAP Systems Inc.
- 6.4.20 LaCie S.A.S. (Seagate brand)
7 Market Opportunities & Future Outlook
- 7.1 White-space & Unmet-need Assessment

 近線硬碟市場規模、佔有率和成長分析:按儲存容量、介面、外形尺寸、最終用戶、應用和地區分類-2026-2033年產業預測
 硬碟機 (HDD) 和固態硬碟 (SSD) 產業:市場分析與加工趨勢
 硬碟市場-2026-2032年全球市場預測
 2026-2030年全球外接硬碟市場
 外接硬碟市場-全球產業規模、佔有率、趨勢、機會、預測:按容量、最終用戶、應用、地區和競爭格局分類,2021-2031年
 2026年全球外置磁碟系統市場報告
 全球硬碟市場-策略分析與預測(2026-2031)
 可刻錄光碟市場分析及預測(至2035年):依類型、產品、技術、組件、應用、材質、製程及最終用戶分類硬碟機市場分析及預測(至2035年):依類型、產品類型、技術、組件、應用、形狀、材質、設備及最終用戶分類硬碟市場 - 全球產業規模、佔有率、趨勢、機會和預測:按類別、類型、性別、最終用戶、地區和競爭格局分類,2021-2031年