


 |
市場調查報告書
商品編碼
2125490
灌裝機:市場佔有率分析、產業趨勢與統計、成長預測(2026-2031)Filling Machines - Market Share Analysis, Industry Trends & Statistics, Growth Forecasts (2026 - 2031) |
||||||

※ 本網頁內容可能與最新版本有所差異。詳細情況請與我們聯繫。
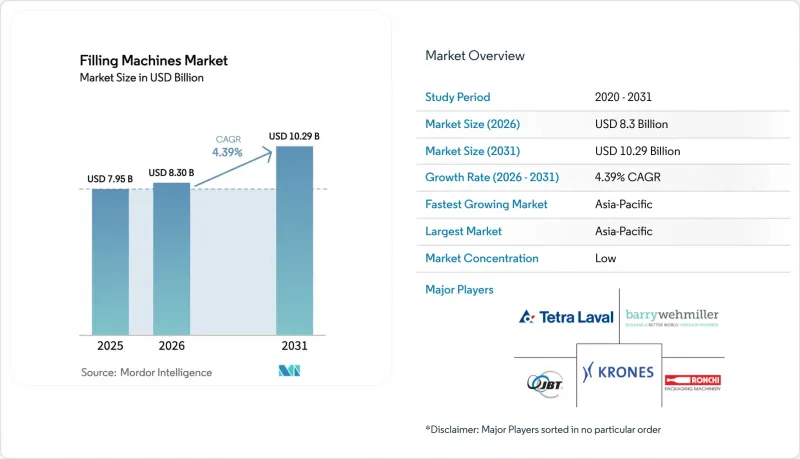
據 Mordor Intelligence 稱,2025 年灌裝機市值為 79.5 億美元,預計到 2031 年將達到 102.9 億美元,而 2026 年為 83 億美元,預測期(2026-2031 年)的複合年成長率為 4.39%。
本報告按設備類型(無菌設備、旋轉式設備及其他)、自動化程度(全自動、半自動及其他)、容器類型(瓶裝、罐裝及其他)、填充技術(重力式、活塞式及其他)、終端用戶行業(食品飲料、醫藥及生技藥品及其他)以及地區(北美、歐洲及其他)進行細分。市場預測以美元計價。
全球灌裝機市場趨勢及洞察
高速、衛生生產線對即飲飲料的需求不斷成長。
預計到2032年,即飲飲料市場規模將達到1兆美元,這將迫使裝瓶商部署產能超過每小時10萬瓶且不影響無菌性的生產線(《乳製品》雜誌)。由於乳製品即飲產品含有熱敏蛋白和功能性添加劑,填充線需要採用層流填充和即時沖洗技術。低糖和無乳糖產品對黏度提出了挑戰,而活塞泵和質量流量計系統可以自動調節流量,從而解決這個問題。克朗斯公司最近向Nu-Pure Beverages公司交付了一條PET填充生產線,該生產線將填充、封蓋和檢測功能整合到一個機架中,從而節省了安裝空間。消費者對便利性和高品質營養的需求不斷成長,這持續推動著對模組化系統的投資,這些系統能夠在多種即飲配方之間快速切換,同時將微生物數量控制在可接受的限值以下。
擴大無菌技術的應用範圍以延長保存期限
2024年,隨著製藥和食品公司尋求透過常溫儲存解決方案將冷鏈成本降低高達40%(FDA),無菌填充技術的應用加速發展。 Emergent BioSolutions公司採用了SA25機器人工作單元,可隔離產品、容器和操作人員,從而實現靈活處理不同尺寸的管瓶並提高無菌性。 FDA更新的指南強調了計量泵的精度和滅菌驗證的重要性,促使供應商採用無需手套的隔離器,這不僅提高了生技藥品的加工能力,還顯著降低了人為干預的風險。食品品牌也利用類似的無菌原理,提供保存期限長達12個月的無防腐劑果汁,顯示各行業的無菌設計正在趨於融合。
高性能灌裝系統需要大量的初始資本投資。
最先進的無菌灌裝機造價可能超過500萬美元,而合格費用可能高達專案預算的25%,這對新興市場的中小型企業和加工商來說無疑是一筆沉重的負擔。一次性包裝袋雖然降低了清潔成本,但每年耗材費用高達六位數。契約製造生產商承擔了大部分資本投資,但產能仍無法滿足需求,導致前置作業時間過長。
細分市場分析
旋轉式填充平台憑藉其在碳酸飲料和非碳酸飲料生產線中久經考驗的高運轉率,預計到2025年將佔據灌裝機市場23.10%的佔有率。下游工藝,例如生物製藥和無防腐劑果汁等需要氣密灌裝單元的環節,預計到2031年,無菌填充單元的複合年成長率將達到7.12%。無菌灌裝機市場預計將持續擴張,供應商正專注於研發獨立的機器人技術。供應商將活塞式、品質流量控制以及時間和壓力控制模組整合到單一底盤中,使工廠能夠柔軟性在早上生產低黏度運動飲料,在晚上生產高黏度冰沙。
儘管容積式活塞填充機仍是醬料和乳霜填充的主流方式,但以1%為增量進行淨重填充的藥品填充技術正日益普及。利樂公司的「A1 1100」灌裝機結合了無菌屏障和7排驅動系統,實現了每小時4萬包的生產速度。此外,粉末填充機與液體生產線的整合,使得合約研發生產機構(CDMO)無需新建無塵室即可實現收入來源多元化。
到2025年,半自動灌裝機將佔據灌裝機市場57.80%的佔有率,在資本投資限制和操作員控制之間取得平衡。然而,受薪資上漲和驗證工程師短缺的推動,全自動灌裝機正以5.42%的複合年成長率快速擴張。隨著人工智慧驅動的自我診斷功能的引入,全自動流水線填充機的市場規模預計將進一步擴大,因為這些功能可以顯著減少停機時間。物聯網連接的人機介面(HMI)可將資料直接傳輸到企業的品管系統,進而減少人工記錄。對於需要熟練操作的精細化妝品和中試規模的藥品批次,手動桌上型灌裝機仍然必不可少。
混合系統現在整合了協作機器人,可以將物品裝載到托盤上並貼上可追溯標籤,從而將人類的靈巧性和機器的重複性相結合。隨著監管審計轉向線上,工廠需要自動產生審計追蹤記錄,軟體功能正成為競標的關鍵標準。
區域分析
預計到2025年,亞太地區將佔全球銷售額的39.20%,年複合成長率達8.42%。這主要得益於中國和印度對常溫乳製品和疫苗灌裝及包裝工廠的投資。越南和印尼也正在擴大飲料產能,自由貿易協定吸引了許多跨國代工灌裝企業。當地原始設備製造商(OEM)目前正從歐洲合作夥伴處獲得伺服的授權,從而降低了入門級設備的成本,並提升了區域競爭力。
北美地區銷售額排名第二,主要得益於高利潤率的生物製藥、精釀飲料以及為降低供應風險而採取的生產回流措施。美國《通貨膨脹控制法案》提供的津貼正用於資助無菌注射器生產線,而加拿大乳製品合作社則正在升級包裝袋填充機,為其配備能源回收CIP循環系統。隨著將硬體、軟體和備件整合到訂閱模式中的預測性維護合約的日益普及,預計北美灌裝機市場將穩步成長。
歐洲仍然是創新中心,德國、義大利和瑞典的供應商正在出口與數位隔離器和可回收包裝相容的罐裝填充機。歐盟的「綠色交易」正在加速低碳馬達和封閉回路型水系統的普及。在東歐,自有品牌產品的出口商正從老舊的重力式生產線過渡到伺服驅動的淨重式填充平台。雖然中東、非洲和南美洲的裝機量相對滯後,但乳製品、果汁和藥品二級包裝領域對入門級旋轉式灌裝機的需求正呈現兩位數的成長。
其他好處
- Excel格式的市場預測(ME)表
- 3個月的分析師支持
目錄
第1章:引言
- 研究假設和市場定義
- 調查範圍
第2章:調查方法
第3章執行摘要
第4章 市場狀況
- 市場概覽
- 市場促進因素
- 高速、衛生生產線對即飲飲料的需求不斷成長。
- 擴大無菌技術的應用範圍以延長保存期限
- 引入自動化技術以彌補技術純熟勞工短缺的問題
- 更嚴格的食品安全法規要求對設備進行升級。
- 適用於多 SKU(直接面對消費者)品牌的快速轉型能力
- 透過人工智慧驅動的線上檢測提高預測性維護的投資報酬率
- 市場限制因素
- 高性能灌裝系統需要大量的初始資本投資。
- 複雜的驗證和合規負擔因地區而異。
- 藥用級一次性部件的供應波動
- 由於驗證工程師短缺,生產線部署延誤。
- 供應鏈分析
- 監理情勢
- 技術展望
- 波特五力分析
- 投資分析
第5章 市場規模與成長預測
- 依設備類型
- 無菌
- 旋轉式
- 容積式(活塞式/重力式)
- 淨重類型
- 其他設備類型
- 按自動化級別
- 全自動
- 半自動
- 手動/手持式
- 按最終用戶行業分類
- 飲食
- 藥品和生技藥品
- 化妝品和個人護理
- 化學品和工業
- 其他
- 按容器類型
- 瓶子
- 能
- 小袋
- 管式墨水匣
- 管瓶和注射器
- 其他容器類型
- 灌裝技術
- 重力
- 活塞
- 時間壓力
- 質量流量計
- 真空
- 螺旋鑽(粉末)
- 按地區
- 北美洲
- 美國
- 加拿大
- 墨西哥
- 歐洲
- 德國
- 英國
- 法國
- 義大利
- 西班牙
- 俄羅斯
- 其他歐洲國家
- 亞太地區
- 中國
- 印度
- 日本
- 韓國
- 澳洲和紐西蘭
- 其他亞太國家
- 中東和非洲
- 中東
- 阿拉伯聯合大公國
- 沙烏地阿拉伯
- 土耳其
- 其他中東國家
- 非洲
- 南非
- 奈及利亞
- 埃及
- 其他非洲地區
- 中東
- 南美洲
- 巴西
- 阿根廷
- 南美洲其他地區
- 北美洲
第6章 競爭情勢
- 市場集中度
- 策略舉措和趨勢
- 市佔率分析
- 公司簡介
- Krones AG
- Tetra Laval Group
- Syntegon Technology GmbH
- KHS GmbH
- JBT Corporation
- Ronchi Mario SpA
- Barry-Wehmiller Companies Inc.
- Coesia Group
- GEA Group AG
- Serac Group
- IMA Group
- Shibuya Corporation
- Pro Mach Inc.
- Accutek Packaging Equipment
- Shemesh Automation
- US Bottlers Machinery
- Fuji Machinery Co. Ltd.
- OPTIMA Packaging Group
- Adelphi Group
第7章 市場機會與未來展望
According to Mordor Intelligence, the filling machines market size was valued at USD 7.95 billion in 2025 and estimated to grow from USD 8.3 billion in 2026 to reach USD 10.29 billion by 2031, at a CAGR of 4.39% during the forecast period (2026-2031).
This report is Segmented by Equipment Type (Aseptic, Rotary, and More), Automation Level (Fully-Automatic, Semi-Automatic, and More), Container Type (Bottles, Cans, and More), Filling Technology (Gravity, Piston, and More), End-User Industry (Food and Beverage, Pharmaceutical and Biologics, and More), and Geography (North America, Europe, and More). The Market Forecasts are Provided in Terms of Value (USD).
Global Filling Machines Market Trends and Insights
Growth of RTD Beverage Demand for High-Speed Hygienic Lines
RTD beverages are on a clear path toward USD 1 trillion by 2032, forcing bottlers to install lines that exceed 100,000 bottles per hour without compromising sterility, Dairy Foods. Dairy-based RTD products contain proteins and functional additives that are heat-sensitive, so lines must deliver laminar filling and instantaneous cleanup. Sugar-reduced and lactose-free variants raise viscosity challenges that piston-pump or mass-flow-meter systems solve by self-adjusting flow rates. Krones recently delivered a PET line to Nu-Pure Beverages that marries filling, capping, and inspection in one frame to save floor space. Consumer cravings for convenience, combined with premium nutrition trends, keep fuelling investment in modular systems capable of flipping between multiple RTD recipes while holding microbial counts below accepted limits.
Rising Adoption of Aseptic Technology for Shelf-Life Extension
Aseptic filling accelerated in 2024 as pharmaceutical and food companies looked to cut cold-chain costs by as much as 40% through ambient-storage solutions, FDA. Emergent BioSolutions adopted SA25 robotic workcells that isolate product, container, and operator, achieving flexible vial sizing and higher sterility assurance. Updated FDA guidance highlights metering pump accuracy and sterilization validation, prompting vendors to install gloveless isolators that slash intervention risk while speeding biologic throughput. Food brands use the same aseptic principles to offer preservative-free juices with a 12-month shelf life, signaling cross-sector design convergence.
High Upfront CAPEX for Advanced Filling Systems
Cutting-edge aseptic fillers can top USD 5 million, with qualification adding 25% to project budgets, straining SMEs and emerging-market processors. Single-use bags lower cleanup costs but impose six-figure annual consumable bills. Contract manufacturers shoulder much of this capex, but capacity still lags demand, sustaining long lead times.
Other drivers and restraints analyzed in the detailed report include:
- Automation Uptake to Offset Skilled-Labor Shortages
- Stricter Food-Safety Regulations Mandating Equipment Upgrades
- Complex Region-Specific Validation and Compliance Burden
For complete list of drivers and restraints, kindly check the Table Of Contents.
Segment Analysis
Rotary platforms delivered 23.10% of the 2025 filling machines market share, owing to proven uptime in carbonated and still beverage lines. Downstream, aseptic units post the headline 7.12% CAGR to 2031 as biologics and preservative-free juices demand hermetically sealed dosing cells. The filling machines market size for aseptic units is expected to grow, underscoring supplier focus on isolated robotics. Suppliers blend piston, mass-flow, and time-pressure modules within one chassis, giving plants latitude to process water-like sports drinks in the morning and high-viscosity smoothies by night.
Volumetric piston fillers persist in sauces and creams, while net-weight systems gain favor for 1% pharma dosing. Tetra Pak's A1 1100 merges aseptic barriers with 7-row drives to deliver 40,000 packs per hour Tetra Pak. Powder fillers are now grafted onto liquid lines, letting CDMOs diversify revenue without adding new cleanrooms.
Semi-automatic machines held 57.80% of the filling machines market share in 2025 by balancing capital restraint with operator control. Yet full automation races at 5.42% CAGR, nudged by wage inflation and validation-engineer shortages. The filling machines market size for fully automatic lines is projected to widen, aided by AI self-diagnostics that slash downtime. IoT-linked HMIs feed data directly into enterprise quality systems, trimming human paperwork. Manual tabletop units remain indispensable for fragile cosmetics and pilot-scale pharma batches that need human finesse.
Hybrid systems now embed cobots that load trays or apply traceable labels, marrying manual dexterity with machine repeatability. As regulatory audits migrate online, factories push for auto-generated audit trails, turning software capability into a core tender criterion.
Complete Report Scope:
- By Equipment Type
- Aseptic
- Rotary
- Volumetric (Piston / Gravity)
- Net-Weight
- Other Equipment Types
- By Automation Level
- Fully-Automatic
- Semi-Automatic
- Manual / Hand-held
- By End-User Industry
- Food and Beverage
- Pharmaceutical and Biologics
- Cosmetics and Personal Care
- Chemicals and Industrial
- Others End-User Industries
- By Container Type
- Bottles
- Cans
- Pouches and Sachets
- Tubes and Cartridges
- Vials / Syringes
- Other Container Types
- By Filling Technology
- Gravity
- Piston
- Time-Pressure
- Mass / Flow-Meter
- Vacuum
- Auger (Powder)
- By Geography
- North America
- United States
- Canada
- Mexico
- Europe
- Germany
- United Kingdom
- France
- Italy
- Spain
- Russia
- Rest of Europe
- Asia-Pacific
- China
- India
- Japan
- South Korea
- Australia and New Zealand
- Rest of Asia-Pacific
- Middle East and Africa
- Middle East
- United Arab Emirates
- Saudi Arabia
- Turkey
- Rest of Middle East
- Africa
- South Africa
- Nigeria
- Egypt
- Rest of Africa
- Middle East
- South America
- Brazil
- Argentina
- Rest of South America
- North America
Geography Analysis
Asia-Pacific generated 39.20% of 2025 revenue and is growing at 8.42% CAGR, reflecting China and India's investments in shelf-stable dairy and vaccine fill-finish plants. Vietnam and Indonesia expand beverage capacity, aided by free-trade pacts that lure multinational co-packers. Local OEMs now license servo drives from European partners, trimming entry-level machine cost and boosting regional competitiveness.
North America sits second by value, supported by high-margin biologics, craft beverages, and reshoring commitments to cut supply risk. Grants under the US Inflation Reduction Act channel funds to aseptic syringe lines, while Canadian dairy co-ops renew pouch fillers with energy-recovery CIP loops. The filling machines market size for North America is forecast to climb steadily as predictive-maintenance contracts bundle hardware, software, and spares into subscription models.
Europe remains the innovation nucleus, with German, Italian, and Swedish vendors exporting digital isolators and recyclable-pack-ready can fillers. The EU Green Deal targets accelerate the deployment of low-carbon motors and closed-loop water systems. Eastern Europe is converting outdated gravity lines to servo-driven net-weight platforms to serve private-label exporters. Middle East & Africa and South America trail in installed base yet show double-digit demand for entry-level rotary units in dairy, juice, and pharma secondary packaging.
- Krones AG
- Tetra Laval Group
- Syntegon Technology GmbH
- KHS GmbH
- JBT Corporation
- Ronchi Mario S.p.A.
- Barry-Wehmiller Companies Inc.
- Coesia Group
- GEA Group AG
- Serac Group
- IMA Group
- Shibuya Corporation
- Pro Mach Inc.
- Accutek Packaging Equipment
- Shemesh Automation
- US Bottlers Machinery
- Fuji Machinery Co. Ltd.
- OPTIMA Packaging Group
- Adelphi Group
Additional Benefits:
- The market estimate (ME) sheet in Excel format
- 3 months of analyst support
TABLE OF CONTENTS
1 INTRODUCTION
- 1.1 Study Assumptions and Market Definition
- 1.2 Scope of the Study
2 RESEARCH METHODOLOGY
3 EXECUTIVE SUMMARY
4 MARKET LANDSCAPE
- 4.1 Market Overview
- 4.2 Market Drivers
- 4.2.1 Growth of RTD beverage demand for high-speed hygienic lines
- 4.2.2 Rising adoption of aseptic technology for shelf-life extension
- 4.2.3 Automation uptake to offset skilled-labor shortages
- 4.2.4 Stricter food-safety regulations mandating equipment upgrades
- 4.2.5 Quick-changeover agility for multi-SKU DTC brands
- 4.2.6 AI-enabled inline inspection driving predictive-maintenance ROI
- 4.3 Market Restraints
- 4.3.1 High upfront CAPEX for advanced filling systems
- 4.3.2 Complex region-specific validation and compliance burden
- 4.3.3 Supply volatility of pharma-grade single-use components
- 4.3.4 Shortage of validation engineers delaying line deployment
- 4.4 Supply-Chain Analysis
- 4.5 Regulatory Landscape
- 4.6 Technological Outlook
- 4.7 Porter's Five Forces Analysis
- 4.7.1 Bargaining Power of Suppliers
- 4.7.2 Bargaining Power of Buyers
- 4.7.3 Threat of New Entrants
- 4.7.4 Threat of Substitute Products
- 4.7.5 Intensity of Competitive Rivalry
- 4.8 Investment Analysis
5 MARKET SIZE AND GROWTH FORECASTS (VALUE)
- 5.1 By Equipment Type
- 5.1.1 Aseptic
- 5.1.2 Rotary
- 5.1.3 Volumetric (Piston / Gravity)
- 5.1.4 Net-Weight
- 5.1.5 Other Equipment Types
- 5.2 By Automation Level
- 5.2.1 Fully-Automatic
- 5.2.2 Semi-Automatic
- 5.2.3 Manual / Hand-held
- 5.3 By End-User Industry
- 5.3.1 Food and Beverage
- 5.3.2 Pharmaceutical and Biologics
- 5.3.3 Cosmetics and Personal Care
- 5.3.4 Chemicals and Industrial
- 5.3.5 Others End-User Industries
- 5.4 By Container Type
- 5.4.1 Bottles
- 5.4.2 Cans
- 5.4.3 Pouches and Sachets
- 5.4.4 Tubes and Cartridges
- 5.4.5 Vials / Syringes
- 5.4.6 Other Container Types
- 5.5 By Filling Technology
- 5.5.1 Gravity
- 5.5.2 Piston
- 5.5.3 Time-Pressure
- 5.5.4 Mass / Flow-Meter
- 5.5.5 Vacuum
- 5.5.6 Auger (Powder)
- 5.6 By Geography
- 5.6.1 North America
- 5.6.1.1 United States
- 5.6.1.2 Canada
- 5.6.1.3 Mexico
- 5.6.2 Europe
- 5.6.2.1 Germany
- 5.6.2.2 United Kingdom
- 5.6.2.3 France
- 5.6.2.4 Italy
- 5.6.2.5 Spain
- 5.6.2.6 Russia
- 5.6.2.7 Rest of Europe
- 5.6.3 Asia-Pacific
- 5.6.3.1 China
- 5.6.3.2 India
- 5.6.3.3 Japan
- 5.6.3.4 South Korea
- 5.6.3.5 Australia and New Zealand
- 5.6.3.6 Rest of Asia-Pacific
- 5.6.4 Middle East and Africa
- 5.6.4.1 Middle East
- 5.6.4.1.1 United Arab Emirates
- 5.6.4.1.2 Saudi Arabia
- 5.6.4.1.3 Turkey
- 5.6.4.1.4 Rest of Middle East
- 5.6.4.2 Africa
- 5.6.4.2.1 South Africa
- 5.6.4.2.2 Nigeria
- 5.6.4.2.3 Egypt
- 5.6.4.2.4 Rest of Africa
- 5.6.4.1 Middle East
- 5.6.5 South America
- 5.6.5.1 Brazil
- 5.6.5.2 Argentina
- 5.6.5.3 Rest of South America
- 5.6.1 North America
6 COMPETITIVE LANDSCAPE
- 6.1 Market Concentration
- 6.2 Strategic Moves and Developments
- 6.3 Market Share Analysis
- 6.4 Company Profiles (includes Global level Overview, Market level overview, Core Segments, Financials as available, Strategic Information, Market Rank/Share, Products and Services, Recent Developments)
- 6.4.1 Krones AG
- 6.4.2 Tetra Laval Group
- 6.4.3 Syntegon Technology GmbH
- 6.4.4 KHS GmbH
- 6.4.5 JBT Corporation
- 6.4.6 Ronchi Mario S.p.A.
- 6.4.7 Barry-Wehmiller Companies Inc.
- 6.4.8 Coesia Group
- 6.4.9 GEA Group AG
- 6.4.10 Serac Group
- 6.4.11 IMA Group
- 6.4.12 Shibuya Corporation
- 6.4.13 Pro Mach Inc.
- 6.4.14 Accutek Packaging Equipment
- 6.4.15 Shemesh Automation
- 6.4.16 US Bottlers Machinery
- 6.4.17 Fuji Machinery Co. Ltd.
- 6.4.18 OPTIMA Packaging Group
- 6.4.19 Adelphi Group
7 MARKET OPPORTUNITIES AND FUTURE OUTLOOK
- 7.1 White-space and Unmet-Need Assessment

 灌裝設備市場:2026-2032年全球市場預測(依產品類型、技術、容器形狀、容器材質、機器方向、填充頭數量、最終用途產業和製程類型分類)
 灌裝設備市場 - 全球產業規模、佔有率、趨勢、機會、預測:按銷售類型、工藝類型、產品類型、最終用戶產業、地區和競爭格局分類,2021-2031年
 灌裝設備市場規模、佔有率、趨勢和預測:按銷售形式、工藝形式、產品類型、最終用途行業和地區分類,2026-2034 年
 灌裝機市場:依設備類型、產品類型和地區分類
 全球氣霧劑灌裝機市場規模、佔有率、趨勢及成長分析報告(2026-2034年)全自動軟管灌裝機市場:按機器類型、軟管材料、產量、驅動系統、最終用戶分類,全球預測(2026-2032年)熱封管灌裝設備市場:依灌裝技術、設備類型、自動化程度、管材、終端用戶產業分類,全球預測(2026-2032年)
 墨盒分配器市場規模、佔有率和成長分析:按精度、分配方式、控制機制、墨盒容量、應用、地區和產業預測,2026-2033年
 墨盒灌裝機市場規模、佔有率和成長分析:按自動化程度、填充技術、墨盒類型、填充能力、終端用戶產業和地區分類 - 2026-2033 年產業預測
 2034年全球灌裝機市場機會與策略