


 |
市場調查報告書
商品編碼
2125409
視訊編碼器:市場佔有率分析、產業趨勢與統計、成長預測(2026-2031)Video Encoder - Market Share Analysis, Industry Trends & Statistics, Growth Forecasts (2026 - 2031) |
||||||

※ 本網頁內容可能與最新版本有所差異。詳細情況請與我們聯繫。
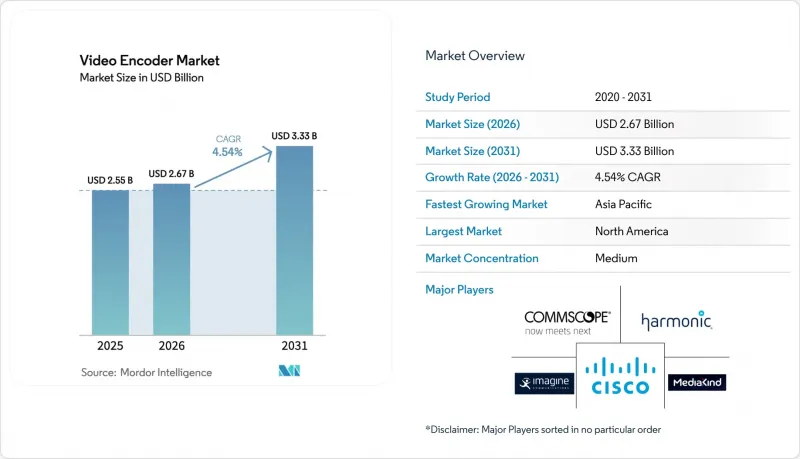
根據 Mordor Intelligence 預測,視訊編碼器市場規模將從 2025 年的 25.5 億美元成長到 2026 年的 26.7 億美元,然後在 2031 年達到 33.3 億美元,2026 年至 2031 年的複合年成長率為 4.54%。
本報告按編碼器類型(硬體、軟體、雲端/SaaS)、編碼標準(H.264/AVC、H.265/HEVC、AV1 等)、應用領域(付費電視、廣播和數位地面廣播 (DTT)、OTT 和直播、遠端教育和企業網路直播等)、最終用戶行業(媒體和娛樂、企業和公司等)以及地區進行細分。市場預測以美元 (USD) 為單位。
全球視訊編碼器市場趨勢及洞察
多螢幕和OTT影片串流越來越受歡迎。
OTT平台最佳化了向智慧型手機、平板電腦和聯網電視的傳輸,通常會為每段內容創建多達15個自適應比特率配置文件,以確保流暢播放。 Netflix向AV1的過渡展現了先進壓縮技術的經濟價值,頻寬降低了30%,CDN成本也隨之降低。三星等廠商正在整合HDR10+支持,這要求內容擁有者維護更廣的色域,從而增加了對能夠同時處理HDR和SDR的高性能編碼器的需求。隨著智慧電視作業系統整合語音控制搜尋功能,逐幀播放功能需要額外的元資料,進一步增加了編碼工作量。這些因素共同推動了高效能編碼器在多螢幕環境中的應用。
5G網路的普及使得超高清直播成為可能。
日本和韓國的商用5G部署已實現了8K和4K60直播的現場測試,在移動車輛上實現了100Mbps的上行速度。廣播公司無需在遠端製作中使用衛星鏈路,從而降低了分發成本和搭建時間。低延遲邊緣節點可實現低於50毫秒的端到端延遲,這對於互動體育博彩和粉絲互動應用至關重要。中國移動在200個城市部署的基於5G的監控系統進一步證明,蜂巢回程傳輸可以取代大規模影像網路中的固定光纖。隨著行動通訊業者將高階影片服務商業化,能夠整合5G調變解調器和網路切片API的編碼器供應商將獲得先發優勢。
超低延遲硬體編碼器的高昂資本投資成本
延遲低於 20 毫秒的「端到端」編碼器單價在 5 萬至 20 萬美元之間,這使得小規模廣播公司難以提供互動或 VR 服務。基於 ASIC 的設計需要客製化晶片,且生產規模仍然有限,限制了規模經濟效益。電競賽事主辦單位通常會撥出六位數的預算專門用於多機位直播的編碼設備,這給中型賽事的利潤率帶來了壓力。隨著半導體人才轉向人工智慧推理和加密貨幣領域,專用視訊晶片的研發進展正在放緩,高價位的局面也將持續下去。
細分市場分析
預計到2025年,硬體設備將佔銷售額的53.74%,鞏固其在關鍵任務內容收集和分發領域的現有地位。然而,隨著廣播公司越來越重視營運支出(OPEX)的柔軟性而非資本支出(CAPEX)的限制,雲端/SaaS視訊編碼器市場預計將以5.88%的複合年成長率(CAGR)在所有類型中成長最快。對於那些需要即時擴展以逐集交付的「數位優先」工作室而言,雲端技術的採用率正在飆升;而企業園區則繼續使用基於商用現成(COTS)伺服器的軟體編碼器,以便IT人員能夠在內部管理工作負載。
在體育賽事直播領域,由於設備性能穩定可靠且支援SDI整合,它們仍然佔據主導地位。但混合架構正在興起,在這種架構中,現場設備將中間訊號傳送到雲端叢集進行大規模自適應碼率(ABR)打包。災害復原策略也擴大採用這種方法,無需複製整個設備叢集即可快速容錯移轉到雲端。能夠協調跨異質基礎設施轉碼的供應商,透過讓客戶擺脫對單一聯繫點的依賴,進一步擴大了其競爭優勢。
由於幾乎所有設備都支援 H.264/AVC,它仍然佔據影片編碼器市場 44.20% 的佔有率,但頻寬限制和版權成本正迫使營運商轉向其他技術。 VVC/H.266 對 8K 串流媒體至關重要,因為它與 HEVC 相比可以降低 50% 的位元率,並以 5.29% 的複合年成長率推動成長。另一方面,儘管 AV1 的計算複雜度仍然很高,但由於其免版稅的特性,它正吸引那些優先考慮成本可預測性的 OTT 服務商。
英特爾Arc Pro GPU具備原生解碼能力,蘋果iPhone 15的發表也推動了AV1相關視訊編碼器市場的發展。在此背景下,隨著矽晶片被整合到消費級設備中,經銷商正在加速採用AV1以降低CDN成本。在專業領域,AWS MediaConvert中的GPU加速VVC編碼正在消除傳統的效能瓶頸,使早期採用者能夠對4K HDR頻道進行即時測試。預計到2031年,多種轉碼器的使用仍將持續,因為內容擁有者需要應對許可風險和設備異質性問題。
區域分析
預計到2025年,北美將佔總收入的33.25%,這主要得益於成熟的廣播網路以及需要高品質超高清工作流程的主要串流服務總部設在北美。儘管對現有設施升級的投資超過了新建設,但隨著雲端運算經濟效益的提升,軟體定義轉型仍在繼續。
亞太地區視訊編碼器市場預計到2031年將以5.26%的複合年成長率成長,主要驅動力包括大規模智慧城市監控專案、5G的快速部署以及對多語言OTT內容庫日益成長的需求。本地電子和半導體製造生態系統正在縮短供應鏈並加速試點部署。
在歐洲,永續性正透過強制性的低功耗和嚴格的隱私保護來實現,這推動了高效轉碼器和敏感影像資料的本地處理技術的應用。隨著DVB和HbbTV的升級,區域公共廣播公司也在進行現代化改造,對混合工作流程產生了持續的需求。
其他好處:
- Excel格式的市場預測(ME)表
- 3個月的分析師支持
目錄
第1章:引言
- 研究假設和市場定義
- 調查範圍
第2章:調查方法
第3章執行摘要
第4章 市場狀況
- 市場概覽
- 市場促進因素
- 多螢幕和OTT影片串流越來越受歡迎。
- 5G網路的廣泛應用將使超高清直播成為可能。
- 從 AVC 過渡到高效率、免版稅的轉碼器(AV1)
- 降低廣播公司整體擁有成本的雲端原生編碼工作流程
- 對低延遲互動式影片。
- 政府資助緊急影像監控網路
- 市場限制因素
- 超低延遲硬體編碼器需要高額資本投入
- 專利聯盟分散和轉碼器版稅的不確定性
- 邊緣/可攜式應用場景中的功耗限制
- ASIC/FPGA組件的供應鏈風險
- 產業生態系分析
- 監理情勢
- 技術展望
- 視訊轉碼器的分析與發展
- VVC 批准和註冊公司名單
- 為VVC標準制定做出貢獻的公司名單
- 波特五力分析
第5章 市場規模與成長預測
- 按編碼器類型
- 硬體
- 軟體
- 雲/SaaS
- 透過編碼標準
- H.264/AVC
- H.265/HEVC
- AV1
- VVC/H.266
- 其他編碼標準
- 透過使用
- 付費電視
- 廣播和地面數位廣播(DTT)
- OTT和直播
- 安全監控
- 遠端教育和企業的網路直播
- 按最終用戶行業分類
- 媒體與娛樂
- 公司/企業
- 政府/國防
- 教育
- 衛生保健
- 按地區
- 北美洲
- 美國
- 加拿大
- 墨西哥
- 歐洲
- 德國
- 英國
- 法國
- 俄羅斯
- 其他歐洲國家
- 亞太地區
- 中國
- 日本
- 印度
- 韓國
- 澳洲
- 其他亞太國家
- 中東和非洲
- 中東
- 沙烏地阿拉伯
- 阿拉伯聯合大公國
- 其他中東國家
- 非洲
- 南非
- 埃及
- 其他非洲國家
- 中東
- 南美洲
- 巴西
- 阿根廷
- 其他南美國家
- 北美洲
第6章 競爭情勢
- 市場集中度
- 策略趨勢
- 市佔率分析
- 公司簡介
- Harmonic Inc.
- CommScope Holding Company, Inc.
- MediaKind Global, Inc.
- Cisco Systems, Inc.
- Imagine Communications Corp.
- Z3 Technology, LLC
- Ateme SA
- Adtec Digital, Inc.
- VITEC Holdings SAS
- Axis Communications AB
- AWS Elemental, Inc.
- Haivision Systems Inc.
- Telestream, LLC
- Matrox Electronic Systems Ltd.
- AJA Video Systems, Inc.
- Brightcove Inc.
- Synamedia Ltd.
- Bitmovin, Inc.
- Beamr Imaging Ltd.
- Teradek, LLC
第7章 市場機會與未來展望
According to Mordor Intelligence, the video encoder market size is expected to grow from USD 2.55 billion in 2025 to USD 2.67 billion in 2026 and is forecast to reach USD 3.33 billion by 2031 at 4.54% CAGR over 2026-2031.
This report is Segmented by Encoder Type (Hardware, Software, and Cloud/SaaS), Encoding Standard (H. 264/AVC, H. 265/HEVC, AV1, and More), Application (Pay-TV, Broadcast and DTT, OTT and Live Streaming, Remote Education and Corporate Webcasting, and More), End-User Industry (Media and Entertainment, Enterprise/Corporate, and More), and Geography. The Market Forecasts are Provided in Terms of Value (USD).
Global Video Encoder Market Trends and Insights
Rising popularity of multiscreen and OTT video consumption
OTT platforms optimize delivery across smartphones, tablets, and connected TVs, often producing 15 adaptive-bitrate profiles per asset to guarantee uninterrupted playback. Netflix's shift to AV1 brought 30% bandwidth savings and lower CDN costs, proving the economic value of advanced compression. Manufacturers such as Samsung embed HDR10+ support that pushes content owners to preserve wider color gamut, raising demand for high-performance encoders able to process HDR and SDR simultaneously. As more smart-TV operating systems integrate voice-controlled search, frame-accurate trick-play features require additional metadata, further enlarging encoding workloads. These factors collectively sustain premium encoder adoption for multiscreen environments.
Proliferation of 5G networks enabling UHD live streaming
Commercial 5G deployments in Japan and South Korea have already enabled field tests of 8K and 4K60 live feeds, delivering uplink speeds of 100 Mbps from moving vehicles. Broadcasters can now bypass satellite links for remote production, trimming contribution costs and setup times. Low-latency edge nodes bring end-to-end delays below 50 ms, critical for interactive sports betting and fan engagement applications. China Mobile's rollout of 5G-based surveillance across 200 cities further underscores how cellular backhaul can substitute fixed fiber in massive video networks. Encoder vendors capable of integrating 5G modems and network slicing APIs gain first-mover advantage as mobile operators commercialize premium video tiers.
High capex for ultra-low-latency hardware encoders
Encoders delivering sub-20 ms glass-to-glass latency cost USD 50,000-200,000 per unit, pricing smaller broadcasters out of interactive or VR offerings. ASIC-based designs demand bespoke silicon, and volumes remain niche, limiting economies of scale. E-sports tournament organizers frequently allocate six-figure budgets merely for encoding rigs across multi-camera broadcasts, squeezing margins for mid-tier events. With semiconductor talent diverted toward AI inference and crypto, advances in purpose-built video silicon slow, prolonging premium pricing.
Other drivers and restraints analyzed in the detailed report include:
- Migration from AVC to high-efficiency, royalty-free codecs (AV1)
- Cloud-native encoding workflows lowering TCO for broadcasters
- Fragmented patent pools and codec royalty uncertainties
For complete list of drivers and restraints, kindly check the Table Of Contents.
Segment Analysis
Hardware appliances represented 53.74% of 2025 revenue, underscoring their legacy foothold in mission-critical contribution and distribution. Yet the video encoder market size for cloud/SaaS offerings is projected to expand at a 5.88% CAGR, the fastest among all types, as broadcasters prioritize opex flexibility over capex lock-in. Cloud adoption surges among digital-first studios needing instantaneous scale for episodic releases, while software encoders on COTS servers continue serving corporate campuses where IT staff can manage workloads internally.
In live sports, appliances retain primacy owing to deterministic performance and SDI integration, but hybrid architectures emerge wherein on-site gear sends mezzanine feeds to cloud clusters for ABR packaging at scale. Disaster recovery strategies increasingly mirror this approach, allowing rapid failover to the cloud without duplicating entire appliance fleets. Vendors able to orchestrate transcodes across heterogeneous infrastructures widen competitive moats as customers avoid single-point dependencies.
H.264/AVC still commands 44.20% of the video encoder market share because of near-universal device support, yet bandwidth pressures and royalty costs push operators toward alternatives. VVC/H.266 leads growth at a 5.29% CAGR thanks to 50% bitrate savings over HEVC, pivotal for 8K streaming. Meanwhile, AV1's royalty-free proposition lures OTT services seeking predictable costs, even if computational complexity remains higher today.
The video encoder market size tied to AV1 receives a tailwind from Intel's Arc Pro GPUs and Apple's iPhone 15, both offering native decode. As such, silicon populates consumer devices, and distributors accelerate AV1 adoption to reduce CDN bills. In the professional realm, GPU-accelerated VVC encoding within AWS MediaConvert removes prior performance bottlenecks, convincing early adopters to test live trials for 4K HDR channels. Multi-codec ladders will persist through 2031 as content owners hedge against licensing risks and device heterogeneity.
Complete Report Scope:
- By Encoder Type
- Hardware
- Software
- Cloud / SaaS
- By Encoding Standard
- H.264 / AVC
- H.265 / HEVC
- AV1
- VVC / H.266
- Other Encoding Standard
- By Application
- Pay-TV
- Broadcast and DTT
- OTT and Live Streaming
- Security and Surveillance
- Remote Education and Corporate Webcasting
- By End-user Industry
- Media and Entertainment
- Enterprise / Corporate
- Government and Defence
- Education
- Healthcare
- By Geography
- North America
- United States
- Canada
- Mexico
- Europe
- Germany
- United Kingdom
- France
- Russia
- Rest of Europe
- Asia-Pacific
- China
- Japan
- India
- South Korea
- Australia
- Rest of Asia-Pacific
- Middle East and Africa
- Middle East
- Saudi Arabia
- United Arab Emirates
- Rest of Middle East
- Africa
- South Africa
- Egypt
- Rest of Africa
- Middle East
- South America
- Brazil
- Argentina
- Rest of South America
- North America
Geography Analysis
North America generated 33.25% of revenue in 2025, underpinned by entrenched broadcast networks and the headquarters of major streaming services that demand premium UHD workflows. Replacement investment outweighs greenfield builds, yet software-defined transformations continue as cloud economics improve.
Asia-Pacific's video encoder market size is on a 5.26% CAGR path to 2031, buoyed by massive smart-city surveillance projects, rapid 5G densification, and growing appetite for multilingual OTT catalogs. Local manufacturing ecosystems for electronics and semiconductors shorten supply chains and accelerate pilot deployments.
Europe pursues sustainability by mandating lower power envelopes and enforcing privacy protections, prompting adoption of efficient codecs and on-premises processing for sensitive footage. Regional public broadcasters modernize in step with DVB and HbbTV updates, forming steady demand for hybrid workflows.
- Harmonic Inc.
- CommScope Holding Company, Inc.
- MediaKind Global, Inc.
- Cisco Systems, Inc.
- Imagine Communications Corp.
- Z3 Technology, LLC
- Ateme S.A.
- Adtec Digital, Inc.
- VITEC Holdings S.A.S.
- Axis Communications AB
- AWS Elemental, Inc.
- Haivision Systems Inc.
- Telestream, LLC
- Matrox Electronic Systems Ltd.
- AJA Video Systems, Inc.
- Brightcove Inc.
- Synamedia Ltd.
- Bitmovin, Inc.
- Beamr Imaging Ltd.
- Teradek, LLC
Additional Benefits:
- The market estimate (ME) sheet in Excel format
- 3 months of analyst support
TABLE OF CONTENTS
1 INTRODUCTION
- 1.1 Study Assumptions and Market Definition
- 1.2 Scope of the Study
2 RESEARCH METHODOLOGY
3 EXECUTIVE SUMMARY
4 MARKET LANDSCAPE
- 4.1 Market Overview
- 4.2 Market Drivers
- 4.2.1 Rising popularity of multiscreen and OTT video consumption
- 4.2.2 Proliferation of 5G networks enabling UHD live streaming
- 4.2.3 Migration from AVC to high-efficiency, royalty-free codecs (AV1)
- 4.2.4 Cloud-native encoding workflows lowering TCO for broadcasters
- 4.2.5 Edge encoding demand for low-latency interactive video
- 4.2.6 Government funding for emergency video surveillance networks
- 4.3 Market Restraints
- 4.3.1 High capex for ultra-low-latency hardware encoders
- 4.3.2 Fragmented patent pools and codec royalty uncertainties
- 4.3.3 Power-consumption limits in edge/portable use-cases
- 4.3.4 Supply-chain risks for ASIC/FPGA components
- 4.4 Industry Ecosystem Analysis
- 4.5 Regulatory Landscape
- 4.6 Technological Outlook
- 4.6.1 Analysis of Video Codecs and Their Evolution
- 4.6.2 List of VVC-Approved and Incorporated Companies
- 4.6.3 List of Companies Contributing to the VVC Standard
- 4.7 Porter's Five Forces Analysis
- 4.7.1 Bargaining Power of Suppliers
- 4.7.2 Bargaining Power of Buyers
- 4.7.3 Threat of New Entrants
- 4.7.4 Threat of Substitutes
- 4.7.5 Intensity of Competitive Rivalry
5 MARKET SIZE AND GROWTH FORECASTS (VALUE)
- 5.1 By Encoder Type
- 5.1.1 Hardware
- 5.1.2 Software
- 5.1.3 Cloud / SaaS
- 5.2 By Encoding Standard
- 5.2.1 H.264 / AVC
- 5.2.2 H.265 / HEVC
- 5.2.3 AV1
- 5.2.4 VVC / H.266
- 5.2.5 Other Encoding Standard
- 5.3 By Application
- 5.3.1 Pay-TV
- 5.3.2 Broadcast and DTT
- 5.3.3 OTT and Live Streaming
- 5.3.4 Security and Surveillance
- 5.3.5 Remote Education and Corporate Webcasting
- 5.4 By End-user Industry
- 5.4.1 Media and Entertainment
- 5.4.2 Enterprise / Corporate
- 5.4.3 Government and Defence
- 5.4.4 Education
- 5.4.5 Healthcare
- 5.5 By Geography
- 5.5.1 North America
- 5.5.1.1 United States
- 5.5.1.2 Canada
- 5.5.1.3 Mexico
- 5.5.2 Europe
- 5.5.2.1 Germany
- 5.5.2.2 United Kingdom
- 5.5.2.3 France
- 5.5.2.4 Russia
- 5.5.2.5 Rest of Europe
- 5.5.3 Asia-Pacific
- 5.5.3.1 China
- 5.5.3.2 Japan
- 5.5.3.3 India
- 5.5.3.4 South Korea
- 5.5.3.5 Australia
- 5.5.3.6 Rest of Asia-Pacific
- 5.5.4 Middle East and Africa
- 5.5.4.1 Middle East
- 5.5.4.1.1 Saudi Arabia
- 5.5.4.1.2 United Arab Emirates
- 5.5.4.1.3 Rest of Middle East
- 5.5.4.2 Africa
- 5.5.4.2.1 South Africa
- 5.5.4.2.2 Egypt
- 5.5.4.2.3 Rest of Africa
- 5.5.4.1 Middle East
- 5.5.5 South America
- 5.5.5.1 Brazil
- 5.5.5.2 Argentina
- 5.5.5.3 Rest of South America
- 5.5.1 North America
6 COMPETITIVE LANDSCAPE
- 6.1 Market Concentration
- 6.2 Strategic Moves
- 6.3 Market Share Analysis
- 6.4 Company Profiles (includes Global level Overview, Market level overview, Core Segments, Financials as available, Strategic Information, Market Rank/Share for key companies, Products and Services, and Recent Developments)
- 6.4.1 Harmonic Inc.
- 6.4.2 CommScope Holding Company, Inc.
- 6.4.3 MediaKind Global, Inc.
- 6.4.4 Cisco Systems, Inc.
- 6.4.5 Imagine Communications Corp.
- 6.4.6 Z3 Technology, LLC
- 6.4.7 Ateme S.A.
- 6.4.8 Adtec Digital, Inc.
- 6.4.9 VITEC Holdings S.A.S.
- 6.4.10 Axis Communications AB
- 6.4.11 AWS Elemental, Inc.
- 6.4.12 Haivision Systems Inc.
- 6.4.13 Telestream, LLC
- 6.4.14 Matrox Electronic Systems Ltd.
- 6.4.15 AJA Video Systems, Inc.
- 6.4.16 Brightcove Inc.
- 6.4.17 Synamedia Ltd.
- 6.4.18 Bitmovin, Inc.
- 6.4.19 Beamr Imaging Ltd.
- 6.4.20 Teradek, LLC
7 MARKET OPPORTUNITIES AND FUTURE OUTLOOK
- 7.1 White-space and Unmet-Need Assessment


