

 |
市場調查報告書
商品編碼
2125380
應用外包:市佔率分析、產業趨勢與統計、成長預測(2026-2031)Application Outsourcing - Market Share Analysis, Industry Trends & Statistics, Growth Forecasts (2026 - 2031) |
||||||

※ 本網頁內容可能與最新版本有所差異。詳細情況請與我們聯繫。
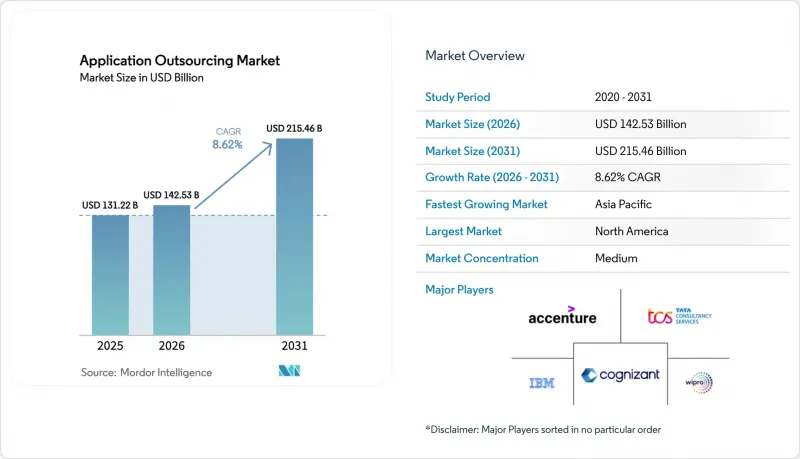
根據 Mordor Intelligence 預測,應用外包市場規模將從 2025 年的 1,312.2 億美元成長到 2026 年的 1,425.3 億美元,到 2031 年將達到 2,154.6 億美元,2026 年至 2031 年的複合年成長率為 8.62%。
本報告按服務類型(應用開發和整合、應用程式維護和支援等)、組織規模(大型企業、中小企業)、訂單模式(固定價格、時間和材料成本等)和地區進行分類。
全球應用外包市場趨勢與洞察
中小企業數位轉型(DX)專案激增
目前,中小企業正利用外包作為快速獲取現代化應用、提升生產力和拓展客戶群的途徑。在美國,60%的中小企業計劃在2025年將軟體開發外包,其靈活的使用模式消除了初始投資的門檻。全球有超過4萬家公司年收入在5億至50億美元之間,這個細分市場為服務供應商提供者正積極回應,提供「雲端優先」和AP主導的解決方案,這些方案易於擴展,且符合有限的預算。因此,預計到2030年,中小企業外包市場的收入成長率將超過整體應用外包市場的成長率。
銀行業向平台銀行和開放金融API轉型
銀行和保險公司正在加速投資於支援嵌入式金融、開放API生態系統和雲端原生架構的應用。摩根大通表示,將工作負載遷移到雲端將使其能夠利用先進的資料能力,並鞏固其在人工智慧領域的領先地位。約72%的金融機構已經將關鍵IT職能外包,隨著監管期限迫使平台快速變革,預計這一趨勢將進一步加劇。由於銀行、金融服務和保險(BFSI)行業在應用外包市場佔據最大佔有率,因此在風險、合規和結算整合方面擁有專業知識的供應商正在獲得競爭優勢。
跨境資料傳輸合規成本不斷增加。
包括GDPR、CCPA和特定產業規則在內的更嚴格的資料主權監管,正迫使企業重新設計其交付模式,並在某些情況下按地區拆分工作負載。法律顧問警告稱,違規罰款和糾正措施可能會抵消勞動力套利帶來的利潤。服務提供者正透過提供區域雲區和近岸資料中心來應對此問題,但資料傳輸的額外加密、稽核和影響評估仍然會增加專案成本並延長合約週期。
細分市場分析
預計到2025年,應用維護和支援市場規模將達到404.9億美元,佔整個應用程式外包市場的30.85%。長期運作的ERP、CRM和供應鏈平台持續需要可靠的運作和分階段升級,從而推動了託管服務的穩定需求。然而,零時差攻擊的日益增加和監管罰款的不斷增加,正使安全服務從一項輔助服務轉變為一項成長驅動力。
隨著董事會日益重視網路風險,應用保全服務正以12.61%的複合年成長率快速成長。企業越來越傾向於聘請外部專家,將程式碼掃描工具與全天候安全營運中心(SOC)人員結合。因此,安全項目的應用外包市場預計將快速擴張,而維護業務的佔有率預計將逐步下降。開發、整合、現代化和測試服務構成了服務組合,92%的企業計劃在2030年前對部分舊有系統進行重構。
預計到2025年,雲端運算將佔總營收的56.35%,達到739.6億美元。這凸顯了基於訂閱的基礎架構和自動擴展正在定義現代化藍圖。將分析、數位商務和協作工作負載遷移到雲端的企業是應用外包市場最大的成長要素。
由於受監管產業無法在一夜之間淘汰本地部署系統,混合模式的市場規模正以 9.81% 的複合年成長率 (CAGR) 不斷擴大。服務供應商提供基於 Kubernetes 的工具鏈,連接資料中心和超大規模資料中心業者,有效管理延遲和合規性。隨著這種平衡的日趨成熟,儘管對於涉及超低延遲和主權資料的任務而言,本地部署仍然至關重要,但應用程式外包在本地環境中的市場佔有率正在逐漸下降。在這一領域,服務提供者的任務是管理整個混合環境中的網路、身分和可觀測性層。
區域分析
北美地區2025年的應用外包市場營收將達550.5億美元,佔全球總營收的41.95%。企業正在大規模採用人工智慧、事件驅動架構和零信任安全技術。墨西哥、哥倫比亞和哥斯達黎加等近岸外包中心正以近20%的年成長率成長,有效緩解了敏捷團隊面臨的時區差異所帶來的挑戰。
亞太地區以11.85%的複合年成長率領先,其中印度、越南和菲律賓是服務交付的支柱。光是印度就計畫在2029年實現208.1億美元的軟體出口額。中國國內雲端運算的普及催生了新的諮詢業務,而澳洲和新加坡正成為受監管工作負載的區域中心。薪資上漲和離職率率高促使供應商繼續投資自動化和二線城市。
在歐洲,受數據主權指令的影響,需求依然強勁。德國和英國仍然是最大的買家,而波蘭、羅馬尼亞和烏克蘭則憑藉語言親和性,從西方客戶那裡獲得了近岸外包預算。預計到2025年,荷蘭BPO市場將以6.7%的複合年成長率成長。超大規模資料中心業者建構的本地雲端區域正在消除傳統的延遲障礙,並支援邊緣分析相關的交易。
拉丁美洲、中東和非洲正成為新的成長舞台。巴西、智利和阿根廷正向北美公司提供成本極具競爭力的敏捷團隊。海灣國家政府正在資助大規模的數位服務項目,從而催生了對雲端運算和網路安全專業人才的需求。同時,南非和奈及利亞正在金融科技和電信領域培養編碼人才。監管政策的明確化和網路容量的提升將決定這些地區到2030年將在全球應用外包市場佔據多大的佔有率。
其他好處:
- Excel格式的市場預測(ME)表
- 3個月的分析師支持
目錄
第1章:引言
- 研究假設和市場定義
- 調查範圍
第2章:調查方法
第3章執行摘要
第4章 市場狀況
- 市場概覽
- 市場促進因素
- 中小企業數位轉型(DX)專案激增
- 銀行業向平台銀行和開放金融API轉型
- 對用於人工智慧/機器學習工作負載的雲端原生應用程式的需求
- 從 2022 年起,由於技術利潤空間收窄,成本最佳化面臨壓力。
- 透過供應商整合過渡到單一服務合作夥伴
- 將近岸交貨擴展到拉丁美洲的二級樞紐
- 市場限制因素
- 跨境資料傳輸相關的合規成本增加
- 主要海外地區的人才流失與薪資上漲
- 網路攻擊導致供應鏈漏洞增加
- 人工智慧主導的低程式碼平台正在蠶食傳統的應用開發與管理 (ADM) 市場。
- 產業價值鏈分析
- 監理情勢
- 技術展望
- 產業吸引力—五力分析
- 供應商的議價能力
- 買方的議價能力
- 新進入者的威脅
- 替代品的威脅
- 競爭公司之間的競爭
- 宏觀經濟因素對市場的影響
第5章 市場規模與成長預測
- 按服務類型
- 應用開發與整合
- 應用程式維護和支援
- 應用測試和品質保證(QA)
- 應用程式現代化和遷移
- 應用程式保全服務
- 其他
- 按部署模式
- 現場
- 雲
- 混合
- 按最終用戶行業分類
- BFSI
- 醫療保健和生命科學
- 媒體與娛樂
- 物流/運輸
- 零售與電子商務
- 製造業
- 政府/公共部門
- 資訊科技/通訊
- 其他終端用戶產業
- 按組織規模
- 大公司
- 中小企業
- 訂單模式
- 定價
- 工料製
- 基於結果/託管的服務
- 建設、運作和移交(BOT)
- 按地區
- 北美洲
- 美國
- 加拿大
- 墨西哥
- 南美洲
- 巴西
- 阿根廷
- 智利
- 其他南美國家
- 歐洲
- 德國
- 英國
- 法國
- 俄羅斯
- 義大利
- 西班牙
- 其他歐洲國家
- 亞太地區
- 中國
- 印度
- 日本
- 韓國
- 澳洲
- 馬來西亞
- 新加坡
- 其他亞太國家
- 中東和非洲
- 中東
- 阿拉伯聯合大公國
- 沙烏地阿拉伯
- 土耳其
- 其他中東國家
- 非洲
- 南非
- 奈及利亞
- 其他非洲國家
- 中東
- 北美洲
第6章 競爭情勢
- 市場集中度
- 策略趨勢
- 市佔率分析
- 公司簡介
- Accenture Plc
- IBM Consulting(IBM Corporation)
- Tata Consultancy Services(TCS)Ltd.
- Cognizant Technology Solutions Corporation
- Wipro Limited
- Capgemini SE
- DXC Technology
- HCL Technologies
- Infosys Limited
- NTT DATA Group Corporation
- Atos SE
- CGI Inc.
- Fujitsu Limited
- Tech Mahindra Limited
- LTIMindtree Limited
- Sopra Steria Group SA
- EPAM Systems Inc.
- Endava PLC
- Globant SA
- Persistent Systems Limited
- Softtek Ltd.
- UST Global
- Hexaware Technologies Limited
- Virtusa Corporation
- Mphasis Limited
- Unisys Corporation
第7章 市場機會與未來趨勢
- 評估閒置頻段和未滿足的需求
According to Mordor Intelligence, the application outsourcing market size is expected to grow from USD 131.22 billion in 2025 to USD 142.53 billion in 2026 and is forecast to reach USD 215.46 billion by 2031 at 8.62% CAGR over 2026-2031.
This report is Segmented by Service Type (Application Development and Integration, Application Maintenance and Support, and More), Deployment Model (On-Premise, Cloud, and Hybrid), End-User Industry (BFSI, Healthcare and Life Sciences, and More), Organisation Size (Large Enterprises and Small and Medium Enterprises), Contract Model (Fixed-Price, Time and Material, and More), and Geography.
Global Application Outsourcing Market Trends and Insights
Surging digital-transformation programmes among SMEs
SMEs now treat outsourcing as the fastest path to modern applications that improve productivity and customer reach. In the United States, 60% of smaller firms plan to outsource software builds in 2025, attracted by flexible consumption models that remove upfront capital barriers. With more than 40,000 companies worldwide generating between USD 500 million and USD 5 billion in revenue, the segment offers a USD 300-400 billion pool for service providers. Providers respond by packaging cloud-first, API-driven offerings that fit limited budgets yet scale easily. As a result, SME revenue is expected to outpace overall application outsourcing market growth through 2030.
BFSI's pivot to platform banking and open-finance APIs
Banks and insurers accelerate application spending to support embedded finance, open-API ecosystems, and cloud-native architectures. JPMorgan Chase reports that moving workloads to the cloud unlocks advanced data capabilities and cements its AI leadership. Nearly 72% of financial institutions already outsource substantial IT functions, and that intensity rises when regulatory deadlines push rapid platform changes. Providers with domain knowledge in risk, compliance, and payments integration gain a competitive edge as BFSI contributes the single largest slice of the application outsourcing market.
Rising compliance costs for cross-border data transfer
Tighter data-sovereignty rules such as GDPR, CCPA, and sector-specific mandates force enterprises to redesign delivery models and sometimes split workloads by region. Legal counsel warns that non-compliance fines and remediation can offset labor arbitrage gains. Providers answer with regional cloud zones and nearshore centers, yet extra encryption, audit, and transfer-impact assessments still raise project costs and slow deal cycles.
Other drivers and restraints analyzed in the detailed report include:
- Cloud-native application demand for AI/ML workloads
- Cost-optimisation pressure post-2022 tech-margin squeeze
- Talent attrition and wage inflation in offshore hotspots
For complete list of drivers and restraints, kindly check the Table Of Contents.
Segment Analysis
Application Maintenance & Support contributed USD 40.49 billion in 2025, translating to 30.85% of the overall application outsourcing market. Long-running ERP, CRM, and supply-chain platforms still require dependable uptime and incremental upgrades, which keeps steady demand for managed services. Yet rising zero-day exploits and regulatory fines move security from an ancillary service into a growth engine.
Application Security Services expand at 12.61% CAGR as boards elevate cyber risk. Enterprises prefer external specialists who combine code-scanning tools with 24X7 SOC talent. As a result, the application outsourcing market size for security projects is forecast to climb sharply, while maintenance's share slowly contracts. Development, integration, modernization, and testing services round out the portfolio, with 92% of firms planning some level of legacy refactoring before 2030.
Cloud deployments own 56.35% of 2025 revenue, equivalent to USD 73.96 billion, underscoring how subscription infrastructure and automated scaling now define modernization roadmaps. Enterprises moving analytics, digital commerce, and collaboration workloads to the cloud create the largest single contributor to the application outsourcing market.
Hybrid models rise at a 9.81% CAGR because regulated industries cannot abandon on-premises systems overnight. Providers deliver Kubernetes-based toolchains that bridge data centers and hyperscaler regions, keeping latency and compliance in check. As this balance matures, the application outsourcing market share for on-premises environments gradually declines, yet on-premises remains relevant for ultra-low-latency or sovereign data tasks. The segment keeps providers busy governing network, identity, and observability layers across mixed estates.
Complete Report Scope:
- By Service Type
- Application Development and Integration
- Application Maintenance and Support
- Application Testing and QA
- Application Modernisation and Migration
- Application Security Services
- Others
- By Deployment Model
- On-premise
- Cloud
- Hybrid
- By End-user Industry
- BFSI
- Healthcare and Life Sciences
- Media and Entertainment
- Logistics and Transportation
- Retail and E-commerce
- Manufacturing
- Government and Public Sector
- IT and Telecom
- Other End-User Industries
- By Organisation Size
- Large Enterprises
- Small & Medium Enterprises (SMEs)
- By Contract Model
- Fixed-price
- Time and Material
- Outcome-based / Managed Services
- Build-Operate-Transfer (BOT)
- By Geography
- North America
- United States
- Canada
- Mexico
- South America
- Brazil
- Argentina
- Chile
- Rest of South America
- Europe
- Germany
- United Kingdom
- France
- Russia
- Italy
- Spain
- Rest of Europe
- Asia-Pacific
- China
- India
- Japan
- South Korea
- Australia
- Malaysia
- Singapore
- Rest of Asia-Pacific
- Middle East and Africa
- Middle East
- United Arab Emirates
- Saudi Arabia
- Turkey
- Rest of Middle East
- Africa
- South Africa
- Nigeria
- Rest of Africa
- Middle East
- North America
Geography Analysis
North America generated USD 55.05 billion, equating to 41.95% of 2025 revenue within the application outsourcing market. Enterprises adopt AI, event-driven architectures, and zero-trust security at scale. Nearshore centers across Mexico, Colombia, and Costa Rica grow close to 20% annually, easing time-zone friction for agile teams.
Asia-Pacific posts the fastest 11.85% CAGR, with India, Vietnam, and the Philippines anchoring delivery. India alone targets USD 20.81 billion in software exports by 2029. China's domestic cloud push opens fresh consulting work, while Australia and Singapore become regional hubs for regulated workloads. Wage inflation and attrition keep vendors investing in automation and second-tier cities.
Europe shows steady demand, shaped by data-sovereignty directives. Germany and the United Kingdom remain top buyers, and Poland, Romania, and Ukraine attract nearshore budgets from Western clients thanks to linguistic alignment. The Netherlands BPO market is tracking a 6.7% CAGR through 2025. Local cloud regions built by hyperscalers remove earlier latency barriers and support edge analytics deals.
Latin America, the Middle East, and Africa represent newer growth theaters. Brazil, Chile, and Argentina offer cost-competitive agile squads for North American firms. Gulf governments fund large digital services programs, creating demand for cloud and cybersecurity know-how, while South Africa and Nigeria develop fintech and telecom coding bases. Regulatory clarity and network capacity improvements will decide how much of the wider application outsourcing market these regions capture by 2030.
- Accenture Plc
- IBM Consulting (IBM Corporation)
- Tata Consultancy Services (TCS) Ltd.
- Cognizant Technology Solutions Corporation
- Wipro Limited
- Capgemini SE
- DXC Technology
- HCL Technologies
- Infosys Limited
- NTT DATA Group Corporation
- Atos SE
- CGI Inc.
- Fujitsu Limited
- Tech Mahindra Limited
- LTIMindtree Limited
- Sopra Steria Group SA
- EPAM Systems Inc.
- Endava PLC
- Globant S.A
- Persistent Systems Limited
- Softtek Ltd.
- UST Global
- Hexaware Technologies Limited
- Virtusa Corporation
- Mphasis Limited
- Unisys Corporation
Additional Benefits:
- The market estimate (ME) sheet in Excel format
- 3 months of analyst support
TABLE OF CONTENTS
1 INTRODUCTION
- 1.1 Study Assumptions and Market Definition
- 1.2 Scope of the Study
2 RESEARCH METHODOLOGY
3 EXECUTIVE SUMMARY
4 MARKET LANDSCAPE
- 4.1 Market Overview
- 4.2 Market Drivers
- 4.2.1 Surging digital-transformation programmes among SMEs
- 4.2.2 BFSI's pivot to platform banking and open-finance APIs
- 4.2.3 Cloud-native application demand for AI/ML workloads
- 4.2.4 Cost-optimisation pressure post-2022 tech-margin squeeze
- 4.2.5 Vendor-consolidation to single-pane service partners
- 4.2.6 Near-shore delivery expansion into Latin-America Tier-2 hubs
- 4.3 Market Restraints
- 4.3.1 Rising compliance costs for cross-border data transfer
- 4.3.2 Talent attrition and wage inflation in offshore hotspots
- 4.3.3 Heightened cyber-supply-chain breach incidents
- 4.3.4 AI-driven low-code platforms cannibalising traditional ADM
- 4.4 Industry Value Chain Analysis
- 4.5 Regulatory Landscape
- 4.6 Technological Outlook
- 4.7 Industry Attractiveness - Porter's Five Forces Analysis
- 4.7.1 Bargaining Power of Suppliers
- 4.7.2 Bargaining Power of Buyers
- 4.7.3 Threat of New Entrants
- 4.7.4 Threat of Substitutes
- 4.7.5 Intensity of Competitive Rivalry
- 4.8 Impact of Macroeconomic Factors on the Market
5 MARKET SIZE AND GROWTH FORECASTS (VALUES)
- 5.1 By Service Type
- 5.1.1 Application Development and Integration
- 5.1.2 Application Maintenance and Support
- 5.1.3 Application Testing and QA
- 5.1.4 Application Modernisation and Migration
- 5.1.5 Application Security Services
- 5.1.6 Others
- 5.2 By Deployment Model
- 5.2.1 On-premise
- 5.2.2 Cloud
- 5.2.3 Hybrid
- 5.3 By End-user Industry
- 5.3.1 BFSI
- 5.3.2 Healthcare and Life Sciences
- 5.3.3 Media and Entertainment
- 5.3.4 Logistics and Transportation
- 5.3.5 Retail and E-commerce
- 5.3.6 Manufacturing
- 5.3.7 Government and Public Sector
- 5.3.8 IT and Telecom
- 5.3.9 Other End-User Industries
- 5.4 By Organisation Size
- 5.4.1 Large Enterprises
- 5.4.2 Small & Medium Enterprises (SMEs)
- 5.5 By Contract Model
- 5.5.1 Fixed-price
- 5.5.2 Time and Material
- 5.5.3 Outcome-based / Managed Services
- 5.5.4 Build-Operate-Transfer (BOT)
- 5.6 By Geography
- 5.6.1 North America
- 5.6.1.1 United States
- 5.6.1.2 Canada
- 5.6.1.3 Mexico
- 5.6.2 South America
- 5.6.2.1 Brazil
- 5.6.2.2 Argentina
- 5.6.2.3 Chile
- 5.6.2.4 Rest of South America
- 5.6.3 Europe
- 5.6.3.1 Germany
- 5.6.3.2 United Kingdom
- 5.6.3.3 France
- 5.6.3.4 Russia
- 5.6.3.5 Italy
- 5.6.3.6 Spain
- 5.6.3.7 Rest of Europe
- 5.6.4 Asia-Pacific
- 5.6.4.1 China
- 5.6.4.2 India
- 5.6.4.3 Japan
- 5.6.4.4 South Korea
- 5.6.4.5 Australia
- 5.6.4.6 Malaysia
- 5.6.4.7 Singapore
- 5.6.4.8 Rest of Asia-Pacific
- 5.6.5 Middle East and Africa
- 5.6.5.1 Middle East
- 5.6.5.1.1 United Arab Emirates
- 5.6.5.1.2 Saudi Arabia
- 5.6.5.1.3 Turkey
- 5.6.5.1.4 Rest of Middle East
- 5.6.5.2 Africa
- 5.6.5.2.1 South Africa
- 5.6.5.2.2 Nigeria
- 5.6.5.2.3 Rest of Africa
- 5.6.5.1 Middle East
- 5.6.1 North America
6 COMPETITIVE LANDSCAPE
- 6.1 Market Concentration
- 6.2 Strategic Moves
- 6.3 Market Share Analysis
- 6.4 Company Profiles (includes Global level Overview, Market level overview, Core Segments, Financials as available, Strategic Information, Market Rank/Share for key companies, Products and Services, and Recent Developments)
- 6.4.1 Accenture Plc
- 6.4.2 IBM Consulting (IBM Corporation)
- 6.4.3 Tata Consultancy Services (TCS) Ltd.
- 6.4.4 Cognizant Technology Solutions Corporation
- 6.4.5 Wipro Limited
- 6.4.6 Capgemini SE
- 6.4.7 DXC Technology
- 6.4.8 HCL Technologies
- 6.4.9 Infosys Limited
- 6.4.10 NTT DATA Group Corporation
- 6.4.11 Atos SE
- 6.4.12 CGI Inc.
- 6.4.13 Fujitsu Limited
- 6.4.14 Tech Mahindra Limited
- 6.4.15 LTIMindtree Limited
- 6.4.16 Sopra Steria Group SA
- 6.4.17 EPAM Systems Inc.
- 6.4.18 Endava PLC
- 6.4.19 Globant S.A
- 6.4.20 Persistent Systems Limited
- 6.4.21 Softtek Ltd.
- 6.4.22 UST Global
- 6.4.23 Hexaware Technologies Limited
- 6.4.24 Virtusa Corporation
- 6.4.25 Mphasis Limited
- 6.4.26 Unisys Corporation
7 MARKET OPPORTUNITIES AND FUTURE TRENDS
- 7.1 White-space and Unmet-Need Assessment

