


 |
市場調查報告書
商品編碼
2125363
線上模擬遊戲:市場佔有率分析、產業趨勢與統計、成長預測(2026-2031)Online Simulation Games - Market Share Analysis, Industry Trends & Statistics, Growth Forecasts (2026 - 2031) |
||||||

※ 本網頁內容可能與最新版本有所差異。詳細情況請與我們聯繫。
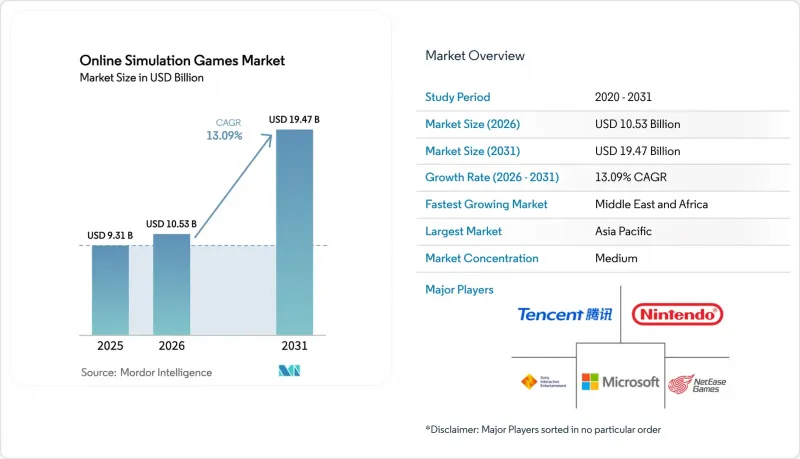
根據 Mordor Intelligence 估計,到 2026 年,線上模擬遊戲市值將達到 105.3 億美元,高於 2025 年的 93.1 億美元,預計到 2031 年將達到 194.7 億美元。
預計從 2026 年到 2031 年,其複合年成長率將達到 13.09%。
本報告按收入模式(廣告、應用程式內收費、訂閱、付費應用程式)、平台(行動裝置、PC、遊戲主機、VR/AR裝置)、遊戲類型(生活模擬、車輛模擬、建造/管理模擬、體育模擬、培訓/教育模擬)和地區(北美等)進行細分。市場預測以美元計價。
全球線上模擬遊戲市場趨勢及洞察
「行動優先」遊戲在亞洲新興市場日益普及。
2024年上半年,東南亞行動應用程式下載量達到42億次,其中印尼就佔了41%。目前,印尼、馬來西亞和泰國的收費意願超過60%,促使發行商進行內容在地化,並專注於開發以美食、運動等具有文化吸引力的主題為核心的模擬遊戲。 5G網路覆蓋範圍的擴大使得以往只能在PC端進行的複雜物理運算成為可能,進一步鞏固了行動端在該地區線上模擬遊戲市場的主導地位。抓住這一機遇的工作室正在迅速擴張規模,而無需像主機和PC遊戲那樣投入巨額的初期行銷成本。
北美雲端遊戲基礎設施的成長使得低延遲模擬成為可能
基於邊緣運算的架構,例如 AccelByte 與 Microsoft Azure 整合的多人遊戲伺服器,現在提供了一系列針對模擬工作負載最佳化的虛擬機器。 CableLabs 的「低延遲 DOCSIS」進一步降低了延遲,即使在典型的連接環境下,也能確保頻寬密集的飛行和城市建設模擬遊戲流暢運行。透過確保效能不受終端用戶硬體的限制,開發人員可以將業務拓展到高效能 GPU 仍然稀缺的新地區,從而擴大線上模擬遊戲市場的潛在基本客群。
GPU需求超過供應,推高了PC模擬的硬體成本。
英偉達佔據了遊戲獨立顯示卡市場86%的佔有率,因此供不應求直接影響了零售價格。消費者推遲了升級計劃,導致高階PC在線上模擬遊戲市場的佔有率不斷萎縮。開發人員降低了材質包解析度或增加了雲端渲染模式,將運算任務轉移到資料中心。串流媒體正在填補這一空白,但消費支出正轉向平台訂閱,這使得依賴固定硬體銷售的遊戲利潤空間極為有限。
細分市場分析
到2025年,應用程式內收費將佔總營收的54.35%,這反映出准入門檻低,且迎合了衝動型消費心理。隨著遊戲工作室優先考慮可預測的現金流,線上模擬遊戲訂閱市場預計將在2026年至2031年間以15.55%的複合年成長率成長。戰利箱的監管正在加速這一轉變,混合模式也正在湧現,即在月票中加入可選的微交易。模擬類遊戲的廣告支出較去年同期成長26.7%,主要得益於激勵性視訊格式的推廣,這種形式無需付費牆即可維持用戶參與度。付費下載模式在小眾的飛機和工業模擬遊戲中仍然盛行,其目標用戶是願意進行前期投資的專家群。
較高的年度用戶留存率與包含獨家擴充包和跨平台雲端存檔的訂閱方案密切相關。忠誠度指標顯示,訂閱服務滿 12 個月或以上的用戶平均遊戲時間延長 42%,顯示可預測的更新能夠有效提升用戶參與度。隨著業者將遊戲訂閱與資料方案捆綁銷售,線上模擬遊戲市場正向以往對價格較為敏感的細分市場拓展。
區域分析
亞太地區佔據線上模擬遊戲市場最大佔有率,預計到2025年將佔全球收入的44.70%。中國、日本和韓國為用戶提供較高的ARPU(每位用戶平均收入),而印尼、泰國和馬來西亞則推動了遊戲安裝量的成長,截至2024年初,行動裝置下載量已達到42億次。當地發行商正透過採用語言包和文化主題素材來延長平均會話時間長度並提高應用程式內收費的深度。
中東和非洲地區正處於最快的成長軌道上,預計到2031年將以17.62%的複合年成長率成長,這主要得益於政府支持的投資基金向遊戲加速器和電子競技場館投入資金。沙烏地阿拉伯的「國家遊戲和電競策略」概述了創造就業機會和發展工作室的目標,並將模擬IP融入旅遊和教育計畫。光纖和5G網路的基礎設施建設正在降低延遲,使全部區域的線上遊戲水準達到全球競爭標準。
北美在雲端交付和人工智慧工具領域保持著技術領先地位,預計到2025年4月,行動模擬遊戲的銷售額將達到20億美元。歐洲已製定了獲利模式標準,消費者保護指令正在影響全球的設計選擇。在南美洲,巴西第14.852號法律正被用來賦予遊戲文化地位,並促進對開發者的公共津貼和稅收優惠。由於農村地區仍然存在頻寬差距,遊戲工作室正在加入離線進度功能以確保遊戲的可及性,而線上模擬遊戲市場在各個經濟領域都保持著穩步成長。
其他好處:
- Excel格式的市場預測(ME)表
- 3個月的分析師支持
目錄
第1章:引言
- 研究假設和市場定義
- 調查範圍
第2章:調查方法
第3章執行摘要
第4章 市場狀況
- 市場概覽
- 市場促進因素
- 「行動優先」遊戲在亞洲新興市場日益普及。
- 北美雲端遊戲基礎設施的成長使得低延遲模擬成為可能
- 將生成式人工智慧融入即時世界構建,可以增強玩家的沉浸感。
- 歐洲擴大模擬遊戲電競轉播權
- 一項由政府主導的數位經濟舉措,旨在支持南美洲的獨立模擬工作室。
- 在中東地區推廣虛擬實境飛行和駕駛模擬器培訓
- 市場限制因素
- GPU需求超過供應,推高了PC模擬的硬體成本。
- 歐洲對「戰利箱」的嚴格監管限制了獲利模式的選擇。
- 非洲農村地區的頻寬限制阻礙了即時多人遊戲體驗。
- 照片級真實實體引擎的開發成本不斷上升
- 技術展望
- 宏觀經濟影響評估
- 投資分析
- 波特五力分析
第5章 市場規模與成長預測
- 按收入模式
- 廣告
- 應用程式內收費
- 訂閱
- 付費應用
- 按平台
- 移動的
- PC
- 主機
- VR/AR設備
- 按遊戲類型
- 生命模擬
- 車輛模擬
- 施工與管理模擬
- 體育模擬
- 訓練和教育模擬
- 按地區
- 北美洲
- 美國
- 加拿大
- 墨西哥
- 南美洲
- 巴西
- 阿根廷
- 智利
- 秘魯
- 其他南美國家
- 歐洲
- 德國
- 英國
- 法國
- 義大利
- 西班牙
- 其他歐洲國家
- 亞太地區
- 中國
- 日本
- 韓國
- 印度
- 澳洲
- 紐西蘭
- 其他亞太國家
- 中東
- 阿拉伯聯合大公國
- 沙烏地阿拉伯
- 土耳其
- 其他中東國家
- 非洲
- 南非
- 其他非洲國家
- 北美洲
第6章 競爭情勢
- Strategic Developments
- Vendor Positioning Analysis
- 公司簡介
- Sony Interactive Entertainment Inc.
- Tencent Holdings Ltd.
- Nintendo Co., Ltd.
- Microsoft Corporation(Xbox Game Studios)
- NetEase, Inc.
- Activision Blizzard, Inc.
- Electronic Arts Inc.
- Take-Two Interactive Software, Inc.
- Bandai Namco Entertainment Inc.
- Square Enix Holdings Co., Ltd.
- Ubisoft Entertainment SA
- Sega Sammy Holdings Inc.
- Paradox Interactive AB
- Frontier Developments plc
- KRAFTON, Inc.
- Roblox Corporation
- Paradox Interactive AB
- Frontier Developments plc
- Wargaming Group Limited
- Colossal Order
第7章 市場機會與未來展望
According to Mordor Intelligence, the online simulation games market size in 2026 is estimated at USD 10.53 billion, growing from 2025 value of USD 9.31 billion with 2031 projections showing USD 19.47 billion, growing at 13.09% CAGR over 2026-2031.
This report is Segmented by Revenue Model (Advertising, In-App Purchase, Subscription, and Paid App), Platform (Mobile, PC, Console, and VR/AR Device), Game Type (Life Simulation, Vehicle Simulation, Construction and Management Simulation, Sports Simulation, and Training and Education Simulation), and Geography (North America, and More). The Market Forecasts are Provided in Terms of Value (USD).
Global Online Simulation Games Market Trends and Insights
Rise in Mobile-First Gaming Uptake across Emerging Asian Markets
Mobile downloads touched 4.2 billion in Southeast Asia during H1 2024, with Indonesia alone contributing 41%. Spending willingness now exceeds 60% across Indonesia, Malaysia, and Thailand, motivating publishers to localize content and lean on culturally resonant food- and sports-themed simulations. Expanding 5G coverage is unlocking complex physics previously limited to PCs, reinforcing the online simulation games market's mobile dominance in the region. Studios exploiting these conditions gain rapid scale without high upfront console or PC marketing costs.
Growth of Cloud Gaming Infrastructure Enabling Low-Latency Simulations in North America
Edge-based architectures such as AccelByte's Multiplayer Servers integrated with Microsoft Azure now offer diverse virtual-machine families tuned for simulation workloads. CableLabs' Low Latency DOCSIS further trims lag, letting bandwidth-heavy flight or city-building simulations run flawlessly over ordinary connections. By abstracting performance away from end-user hardware, developers unlock new regions where high-spec GPUs remain scarce, broadening the online simulation games market addressable base.
High GPU demand outpacing supply, inflating hardware costs for PC simulations
Nvidia's 86% share in discrete gaming GPUs gives shortages direct influence on retail prices. Consumers postpone upgrades, shrinking the premium PC slice of the online simulation games market size. Developers downscale texture packs or add cloud-rendered modes that shift compute to data centers. While streaming bridges the gap, it diverts spending toward platform fees and leaves razor-thin margins for titles reliant on fixed hardware sales.
Other drivers and restraints analyzed in the detailed report include:
- Integration of Generative AI for Real-Time World-Building Boosting Player Engagement
- Expansion of esports broadcasting rights for simulation titles in Europe
- Stringent loot-box regulations in Europe curtailing monetization options
For complete list of drivers and restraints, kindly check the Table Of Contents.
Segment Analysis
In-app purchases delivered 54.35% of 2025 revenue, reflecting their low entry barrier and impulse-driven psychology. The online simulation games market size for subscriptions is forecast to expand at a 15.55% CAGR from 2026-2031 as studios value predictable cash flow. Loot-box regulation accelerates that migration, and hybrid structures emerge where optional microtransactions supplement monthly passes. Advertising spend in simulation titles increased 26.7% year over year, fueled by rewarded-video formats that maintain engagement without paywalls. Paid download models persist among niche aircraft or industrial simulators that serve professional communities willing to invest upfront.
Higher annual retention correlates with subscription bundles that include exclusive expansion packs and cross-platform cloud saves. Loyalty metrics demonstrate that users enrolled longer than twelve months average 42% more playtime, evidence that predictable updates secure mindshare. As telecom operators bundle game subscriptions into data plans, the online simulation games market broadens into demographics previously price sensitive.
Complete Report Scope:
- By Revenue Model
- Advertising
- In-App Purchase
- Subscription
- Paid App
- By Platform
- Mobile
- PC
- Console
- VR/AR Devices
- By Game Type
- Life Simulation
- Vehicle Simulation
- Construction and Management Simulation
- Sports Simulation
- Training and Education Simulation
- By Geography
- North America
- United States
- Canada
- Mexico
- South America
- Brazil
- Argentina
- Chile
- Peru
- Rest of South America
- Europe
- Germany
- United Kingdom
- France
- Italy
- Spain
- Rest of Europe
- Asia-Pacific
- China
- Japan
- South Korea
- India
- Australia
- New Zealand
- Rest of Asia-Pacific
- Middle East
- United Arab Emirates
- Saudi Arabia
- Turkey
- Rest of Middle East
- Africa
- South Africa
- Rest of Africa
- North America
Geography Analysis
Asia-Pacific contributes the largest slice of the online simulation games market, holding 44.70% of 2025 revenue. China, Japan, and South Korea supply high-ARPU users, while Indonesia, Thailand, and Malaysia drive install volumes after mobile downloads reached 4.2 billion in early 2024. Local publishers adopt language packs and culturally themed assets to extend average session length and in-app purchase depth.
The Middle East & Africa region charts the fastest trajectory with an expected 17.62% CAGR to 2031, propelled by sovereign investment funds allocating capital to gaming accelerators and esports arenas. The National Gaming & Esports Strategy in Saudi Arabia outlines job-creation and studio-incubation targets that integrate simulation IP into tourism and education initiatives. Infrastructure rollouts of fiber and 5G networks shrink latency, aligning region-wide with global competitive standards for online titles.
North America maintains technical leadership in cloud delivery and AI tooling, recording USD 2 billion in mobile simulation revenue in April 2025. Europe sets monetization norms, with consumer-protection directives influencing global design choices. South America leverages Brazil's Law 14.852 to grant gaming cultural status, fostering public grants and tax incentives for developers. Rural bandwidth gaps persist, so studios embed offline progression to ensure accessibility, keeping growth steady across diverse economic tiers in the online simulation games market.
- Sony Interactive Entertainment Inc.
- Tencent Holdings Ltd.
- Nintendo Co., Ltd.
- Microsoft Corporation (Xbox Game Studios)
- NetEase, Inc.
- Activision Blizzard, Inc.
- Electronic Arts Inc.
- Take-Two Interactive Software, Inc.
- Bandai Namco Entertainment Inc.
- Square Enix Holdings Co., Ltd.
- Ubisoft Entertainment SA
- Sega Sammy Holdings Inc.
- Paradox Interactive AB
- Frontier Developments plc
- KRAFTON, Inc.
- Roblox Corporation
- Paradox Interactive AB
- Frontier Developments plc
- Wargaming Group Limited
- Colossal Order
Additional Benefits:
- The market estimate (ME) sheet in Excel format
- 3 months of analyst support
TABLE OF CONTENTS
1 Introduction
- 1.1 Study Assumptions and Market Definition
- 1.2 Scope of the Study
2 Research Methodology
3 Executive Summary
4 Market Landscape
- 4.1 Market Overview
- 4.2 Market Drivers
- 4.2.1 Rise in Mobile-First Gaming Uptake across Emerging Asian Markets
- 4.2.2 Growth of Cloud Gaming Infrastructure Enabling Low-Latency Simulations in North America
- 4.2.3 Integration of Generative AI for Real-Time World-Building Boosting Player Engagement
- 4.2.4 Expansion of Esports Broadcasting Rights for Simulation Titles in Europe
- 4.2.5 Government-Backed Digital Economy Initiatives Fueling Indie Simulation Studios in South America
- 4.2.6 Increasing Adoption of VR Flight and Driving Simulators for Training in the Middle East
- 4.3 Market Restraints
- 4.3.1 High GPU Demand Outpacing Supply, Inflating Hardware Costs for PC Simulations
- 4.3.2 Stringent Loot-Box Regulations in Europe Curtailing Monetization Options
- 4.3.3 Bandwidth Limitations in Rural Africa Hindering Real-Time Multiplayer Experiences
- 4.3.4 Rising Development Costs for Photorealistic Physics Engines
- 4.4 Technological Outlook
- 4.5 Macroeconomic Impact Assessment
- 4.6 Investment Analysis
- 4.7 Porter's Five Forces Analysis
- 4.7.1 Bargaining Power of Suppliers
- 4.7.2 Bargaining Power of Buyers/Consumers
- 4.7.3 Threat of New Entrants
- 4.7.4 Threat of Substitute Products
- 4.7.5 Intensity of Competitive Rivalry
5 Market Size and Growth Forecasts (Value)
- 5.1 By Revenue Model
- 5.1.1 Advertising
- 5.1.2 In-App Purchase
- 5.1.3 Subscription
- 5.1.4 Paid App
- 5.2 By Platform
- 5.2.1 Mobile
- 5.2.2 PC
- 5.2.3 Console
- 5.2.4 VR/AR Devices
- 5.3 By Game Type
- 5.3.1 Life Simulation
- 5.3.2 Vehicle Simulation
- 5.3.3 Construction and Management Simulation
- 5.3.4 Sports Simulation
- 5.3.5 Training and Education Simulation
- 5.4 By Geography
- 5.4.1 North America
- 5.4.1.1 United States
- 5.4.1.2 Canada
- 5.4.1.3 Mexico
- 5.4.2 South America
- 5.4.2.1 Brazil
- 5.4.2.2 Argentina
- 5.4.2.3 Chile
- 5.4.2.4 Peru
- 5.4.2.5 Rest of South America
- 5.4.3 Europe
- 5.4.3.1 Germany
- 5.4.3.2 United Kingdom
- 5.4.3.3 France
- 5.4.3.4 Italy
- 5.4.3.5 Spain
- 5.4.3.6 Rest of Europe
- 5.4.4 Asia-Pacific
- 5.4.4.1 China
- 5.4.4.2 Japan
- 5.4.4.3 South Korea
- 5.4.4.4 India
- 5.4.4.5 Australia
- 5.4.4.6 New Zealand
- 5.4.4.7 Rest of Asia-Pacific
- 5.4.5 Middle East
- 5.4.5.1 United Arab Emirates
- 5.4.5.2 Saudi Arabia
- 5.4.5.3 Turkey
- 5.4.5.4 Rest of Middle East
- 5.4.6 Africa
- 5.4.6.1 South Africa
- 5.4.6.2 Rest of Africa
- 5.4.1 North America
6 Competitive Landscape
- 6.1 Strategic Developments
- 6.2 Vendor Positioning Analysis
- 6.3 Company Profiles (includes Global level Overview, Market level overview, Core Segments, Financials as available, Strategic Information, Products and Services, and Recent Developments)
- 6.3.1 Sony Interactive Entertainment Inc.
- 6.3.2 Tencent Holdings Ltd.
- 6.3.3 Nintendo Co., Ltd.
- 6.3.4 Microsoft Corporation (Xbox Game Studios)
- 6.3.5 NetEase, Inc.
- 6.3.6 Activision Blizzard, Inc.
- 6.3.7 Electronic Arts Inc.
- 6.3.8 Take-Two Interactive Software, Inc.
- 6.3.9 Bandai Namco Entertainment Inc.
- 6.3.10 Square Enix Holdings Co., Ltd.
- 6.3.11 Ubisoft Entertainment SA
- 6.3.12 Sega Sammy Holdings Inc.
- 6.3.13 Paradox Interactive AB
- 6.3.14 Frontier Developments plc
- 6.3.15 KRAFTON, Inc.
- 6.3.16 Roblox Corporation
- 6.3.17 Paradox Interactive AB
- 6.3.18 Frontier Developments plc
- 6.3.19 Wargaming Group Limited
- 6.3.20 Colossal Order
7 Market Opportunities and Future Outlook
- 7.1 White-Space and Unmet-Need Assessment

 2026年全球幼兒教育遊戲市場報告
 教育遊戲化學習市場預測至2034年-全球分析(按組件、遊戲類型、平台、學習領域、部署模式、最終用戶和地區分類)
 遊戲化學習市場:2026-2032年全球市場預測語言學習遊戲市場:2026-2032年全球市場預測(依遊戲類型、平台、年齡層、遊戲模式、獲利模式、部署方式及最終用戶分類)
 遊戲化學習市場規模、佔有率和成長分析:按組件、部署模式、遊戲類型、學習模式、應用、最終用戶和地區分類-2026-2033年產業預測
 全球K-12遊戲化學習市場,2026-2030年
 2026-2034年全球遊戲化學習市場規模、佔有率、趨勢和成長分析報告2026年全球線上模擬遊戲市場報告2026年全球遊戲化學習市場報告
 遊戲化學習市場分析及預測(至2035年):按類型、產品、服務、技術、組件、應用、設備、部署、最終用戶和解決方案分類