


 |
市場調查報告書
商品編碼
2125335
再生炭黑:市場佔有率分析、產業趨勢與統計、成長預測(2026-2031)Recovered Carbon Black - Market Share Analysis, Industry Trends & Statistics, Growth Forecasts (2026 - 2031) |
||||||

※ 本網頁內容可能與最新版本有所差異。詳細情況請與我們聯繫。
根據 Mordor Intelligence 預測,再生炭黑市場規模將從 2025 年的 113.89 千噸成長到 2026 年的 138.21 千噸,到 2031 年將達到 363.70 千噸,2026 年至 2031 年的複合年成長率為 21.35%。
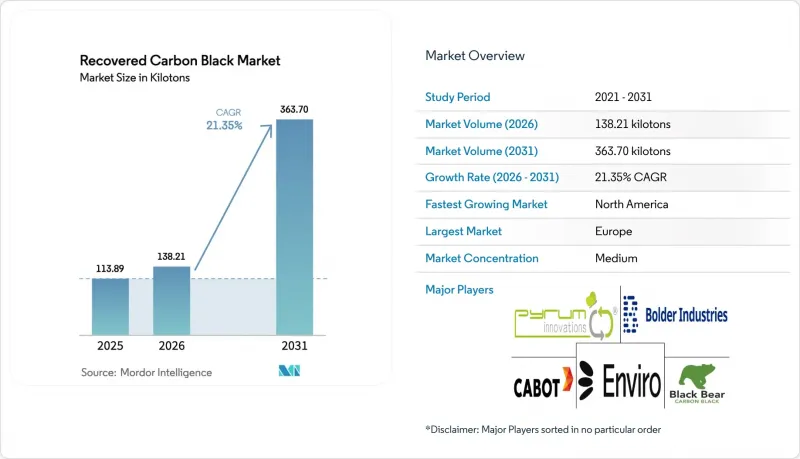
本報告按等級(橡膠用炭黑 (RCB) 和特殊/導電級 RCB)、製造技術(熱解、氣化和其他製造技術)、應用(輪胎、塑膠等)、終端用戶產業(汽車、印刷包裝等)和地區(亞太地區、北美、歐洲等)進行細分。市場預測以數量(噸)為單位。
全球炭黑回收市場趨勢及洞察
永續性和循環經濟
強制性輪胎回收和碳定價機制正從自願性措施轉向具有法律約束力的措施。印度已建立起閉合迴路獎勵,將生產者延伸責任制(EPR)的回收目標從2024-25會計年度起提高到100%,並對輪胎製造中使用再生炭黑的情況進行認證。歐盟的《產品碳儲存條例》(2024/3012號條例)要求對碳排放進行超過35年的監測,並且由於熱解運營商符合ISO 59014標準的可追溯性要求,因此比未使用原料供應商享有優先權。中國將於2024年5月生效的全國碳市場將對高排放原料進行處罰,並強制國內複合材料生產商轉向低碳填料。這些措施將使在符合ASTM D8474標準的前提下,在胎面配方中以再生炭黑取代高達60%的原生炭黑成為可能。生產者責任延伸制度、碳排放稅和產品級認證的整合,使再生炭黑市場在結構合規方面具有優勢。
到 2030 年,汽車製造商的目標是使超過 40% 的輪胎採用永續材料製成。
一級輪胎製造商正簽訂多年期收購協議,以降低其熱解工藝的資金籌措風險。米其林的目標是“40%永續材料”,這構成了其與北歐環保公司(斯堪地那維亞 Enviro)共同投資其位於烏德瓦拉(Uddevalla)工廠的基礎。該廠在運作投產前,年產量領先1萬噸。諾基亞和倍耐力也達成了類似的協議,而Bridgestone和東海碳素則在2025年1月成立了一家專門的合資企業。這些具有約束力的協議吸收了市場流動性,並將再生炭黑市場從現貨商品轉變為戰略供應鏈。
基礎設施有限,熱解技術尚未成熟。
資本密整合本和單一產品貨幣化的挑戰,阻礙了待開發區回收網路不完善地區新建工廠的進程。黑熊碳公司的「Kemerot」計畫表明,生質燃料、鋼鐵和電力等多種銷售管道對於實現損益平衡至關重要。高溫氣化技術理論效率高,但需要大規模的投資,這也解釋了為什麼到2025年,熱解將佔總產量的90%以上。模組化反應器降低了准入門檻,但仍需要完善的前端分類系統,而這在南美洲和非洲部分地區仍然是一個薄弱環節。
細分市場分析
2025年,橡膠級再生炭黑(rCB)的市佔率(按銷量計)達到70.21%,主要得益於米其林、諾基亞和倍耐力等承購商預售了烏德瓦拉工廠的全部產能。到2031年,在5G和電動車屏蔽需求的推動下,導電級和特種級再生炭黑的複合年成長率預計將達到22.89%,屆時橡膠級再生炭黑的市場佔有率預計將略有下降。灰分含量低於5%的精煉級再生炭黑在汽車塗料和油墨領域已佔15-25%的溢價。卡博特公司的「EVOLVE」系列產品和奧利安公司的特種產品系列表明,在關鍵應用場景中,品質比成本更重要。在整個預測期內,特種級再生炭黑的產量可能會顯著成長,後處理廠的運轉率預計將保持在較高水準。
預計到2025年,熱解將佔全球炭黑產量的90.45%,年複合成長率達22.93%。這將推動再生炭黑市場的擴張。斯堪地那維亞Enviro公司位於烏德瓦拉(Uddevalla)的五反應器設計方案以及博爾德工業公司位於特雷霍特(Terre Haute)的工廠,都體現了大規模反應器配置的理念,這些方案不僅能實現再生炭黑(rCB)的商業化,還能回收石油和鋼鐵。氣化法仍然是一個小眾領域,僅限於能源回收模式,而非產品級再生炭黑的生產。模組化螺旋輸送反應器正在歐洲的小規模設施中湧現,但資金籌措的穩定性仍取決於已簽訂的銷售合約。
區域分析
歐洲仍然是政策主導需求的核心。將於2026年生效的CBAM關稅鼓勵當地原始設備製造商(OEM)轉向使用經認證的再生碳電池(rCB),以避免額外費用。同時,2024/3012號規則將向擁有可追溯供應鏈的熱解業者授予長期碳儲存信用額度。目前,烏德瓦拉(Uddevalla)、都樂(Dole)和迪林根(Dillingen)的工廠為區域生產提供支持,預售產能表明,長期供不應求將持續到2028年。
在北美,產能擴張的趨勢日益明顯。大陸集團、Eco Infinic和中國汽車Group Limited(CSRC)的合資企業顯著降低了資金籌措風險。同時,博爾德工業公司計劃於2026年在印第安納州建造一座年產1.8萬噸的工廠,並於2027年在印第安納州安特衛普附近建造一座年產3萬噸的工廠。該地區的價格仍然位居世界最高之列,這反映了運輸成本和不斷發展的輪胎回收基礎設施。
在亞太地區,豐富的原料和複雜的政策相互限制。儘管印度的100%生產者責任延伸(EPR)目標和韓國Woven Capital支持的LD Carbon計畫都展現出明顯的發展勢頭,但東南亞地區回收品質的差異和資金限制阻礙了運轉率。隨著中國國家排放交易體系(ETS)將於2024年生效,碳成本的引入預計將進一步提升國產再生碳(rCB)相對於進口原生填料的競爭力。
其他好處:
- Excel格式的市場預測(ME)表
- 3個月的分析師支持
目錄
第1章:引言
- 研究假設和市場定義
- 調查範圍
第2章:調查方法
第3章執行摘要
第4章 市場狀況
- 市場概覽
- 市場促進因素
- 環境永續性和循環經濟的要求
- 到 2030 年,汽車製造商的目標是在輪胎中使用超過 40% 的永續材料。
- 成本優勢及與原生炭黑的比較
- 歐盟碳邊境調節機制(CBAM)下的獎勵
- 在5G和電動車中使用rCB導電聚合物複合材料進行EMI屏蔽
- 市場限制因素
- 基礎設施不足和熱解技術尚未成熟。
- 由於收款公司分散化,導致原物料品質出現差異。
- REACH法規下熱解油重新分類的可能性
- 價值鏈分析
- 技術展望
- 波特五力模型
第5章 市場規模與成長預測
- 按年級
- 橡膠等級 rCB
- 特殊應用/導電級rCB
- 透過生產技術
- 熱解
- 氣化
- 其他生產技術
- 透過使用
- 胎
- 塑膠
- 電池
- 輪胎以外的橡膠
- 染料和顏料
- 按最終用戶行業分類
- 車
- 印刷/包裝
- 產業
- 建築/施工
- 電子設備
- 其他終端用戶產業(儲能)
- 按地區
- 亞太地區
- 中國
- 印度
- 日本
- 韓國
- 東南亞國協
- 其他亞太國家
- 北美洲
- 美國
- 加拿大
- 墨西哥
- 歐洲
- 德國
- 英國
- 法國
- 義大利
- 西班牙
- 北歐國家
- 其他歐洲國家
- 南美洲
- 巴西
- 阿根廷
- 其他南美國家
- 中東和非洲
- 沙烏地阿拉伯
- 阿拉伯聯合大公國
- 南非
- 埃及
- 奈及利亞
- 其他中東和非洲國家
- 亞太地區
第6章 競爭情勢
- 市場集中度
- 策略趨勢
- 市佔率分析
- 公司簡介
- Alpha Carbone
- Black Bear Carbon BV
- Bolder Industries
- Cabot Corporation
- Carbon Recovery GmbH
- Continental AG
- ENRESTEC
- Klean Industries Inc.
- LD Carbon Co., Ltd.
- Orion Engineered Carbons GmbH
- Orion SA
- Pyrolyx AG
- Pyrum Innovations Ltd.
- Reoil Sp. z oo
- Scandinavian Enviro Systems AB
- SR2O Holdings LLC
- Strebl Green Carbon Pte Ltd.
第7章 市場機會與未來展望
According to Mordor Intelligence, the recovered carbon black market size is expected to grow from 113.89 kilotons in 2025 to 138.21 kilotons in 2026 and is forecast to reach 363.70 kilotons by 2031 at 21.35% CAGR over 2026-2031.
This report is Segmented by Grade (Rubber Grade RCB and Specialty/Conductive Grade RCB), Production Technology (Pyrolysis, Gasification, and Other Production Technologies), Application (Tires, Plastics, and More), End-User Industry (Automotive, Printing and Packaging, and More), and Geography (Asia-Pacific, North America, Europe, and More). The Market Forecasts are Provided in Terms of Volume (Tons).
Global Recovered Carbon Black Market Trends and Insights
Environmental Sustainability and Circular-Economy Mandates
Mandatory tire-collection rules and carbon-pricing schemes are moving from voluntary to enforceable. India raised its Extended Producer Responsibility (EPR) target to 100% collection from FY 2024-25 and recognized recovered carbon black for tire manufacturing, establishing a closed-loop incentive. The EU's product carbon-storage regulation (Regulation 2024/3012) obliges >=35-year monitoring, rewarding pyrolysis operators with ISO 59014 traceability over virgin suppliers. China's national carbon market, effective May 2024, penalizes high-emission feedstocks, pushing local compounders toward low-carbon fillers. These measures enable tread formulations to replace up to 60% of virgin carbon black without breaching ASTM D8474 benchmarks. The convergence of EPR, carbon fees, and product-level certification gives the recovered carbon black market a structural compliance advantage.
OEM Target of >=40% Sustainable Materials in Tires by 2030
Tier-one tire makers are locking in multi-year offtake to de-risk pyrolysis financing. Michelin's 40% sustainable-materials goal underpins its co-investment in Scandinavian Enviro's Uddevalla plant, pre-selling 10 kt of annual output before commissioning. Nokian and Pirelli have adopted similar agreements, while Bridgestone and Tokai Carbon formed a dedicated venture in January 2025. These binding contracts absorb merchant-market liquidity and convert the recovered carbon black market into a strategic supply chain, not a spot commodity.
Limited Infrastructure and Immature Pyrolysis Technologies
Capital intensity and co-product monetization hurdles delay green-field plants in regions lacking tire-collection grids. Black Bear Carbon's Chemelot project illustrates the need for multi-stream offtake-bio-fuel, steel, electricity-to reach hurdle rates. Higher-temperature gasification offers theoretical efficiency but demands even larger ticket sizes, explaining why pyrolysis captured more than 90% of 2025 output. Module-based reactors lower the entry bar but still require robust front-end sorting, a weak spot in South America and parts of Africa.
Other drivers and restraints analyzed in the detailed report include:
- Cost Advantage Versus Virgin Carbon Black
- EU Carbon Border Adjustment Mechanism (CBAM) Incentives
- Potential REACH Reclassification of Pyrolysis Oils
For complete list of drivers and restraints, kindly check the Table Of Contents.
Segment Analysis
In 2025, rubber-grade rCB held 70.21% volume, driven by Michelin, Nokian, and Pirelli offtakes that pre-sold all Uddevalla capacity. The recovered carbon black market share for rubber-grade is poised to erode modestly as conductive and specialty grades grow 22.89% CAGR through 2031, buoyed by 5G and EV shielding. Purified grades with less than 5% ash already command 15%-25% premiums in automotive coatings and inks. Cabot's EVOLVE and Orion's specialty portfolios validate that quality can outrank cost in decisive use cases. Over the forecast horizon, specialty tonnage could increase substantially, keeping utilization high at post-treatment units.
Pyrolysis supplied 90.45% of global output in 2025 and is on track for 22.93% CAGR, making it the engine behind most recovered carbon black market additions. Scandinavian Enviro's five-reactor Uddevalla design and Bolder Industries' Terre Haute plant exemplify scaled, reactor-train architectures that monetize oil and steel alongside rCB. Gasification remains a niche, constrained to energy-recovery models rather than product-grade rCB. Modular auger reactors are emerging in small European installations, but bankability still hinges on proven offtake agreements.
Complete Report Scope:
- By Grade
- Rubber Grade rCB
- Specialty/Conductive Grade rCB
- By Production Technology
- Pyrolysis
- Gasification
- Other Production Technologies
- By Application
- Tires
- Plastics
- Batteries
- Non-tyre Rubber
- Dyes and Pigments
- By End-user Industry
- Automotive
- Printing and Packaging
- Industrial
- Building and Construction
- Electronics
- Other End-user Industries (Energy Storage)
- By Geography
- Asia-Pacific
- China
- India
- Japan
- South Korea
- ASEAN Countries
- Rest of Asia-Pacific
- North America
- United States
- Canada
- Mexico
- Europe
- Germany
- United Kingdom
- France
- Italy
- Spain
- NORDIC Countries
- Rest of Europe
- South America
- Brazil
- Argentina
- Rest of South America
- Middle-East and Africa
- Saudi Arabia
- United Arab Emirates
- South Africa
- Egypt
- Nigeria
- Rest of Middle-East and Africa
- Asia-Pacific
Geography Analysis
Europe remains the nucleus of policy-driven demand. CBAM tariffs, effective 2026, push local OEMs toward certified rCB that avoids surcharges, while Regulation 2024/3012 awards long-term carbon-storage credits to pyrolysis operators with traceable supply chains. Uddevalla, Dole, and Dillingen plants now anchor regional output, and pre-sold capacity suggests chronic under-supply through 2028.
North America follows a capacity-build narrative. Joint ventures involving Continental Carbon, Eco-Infinic, and CSRC materially de-risk financing, while Bolder Industries brings an 18 kt unit to Indiana in 2026 and plans a 30 kt module near Antwerp, Indiana, by 2027. Regional pricing remains the world's highest, reflecting both freight economics and evolving tire-take-back infrastructure.
Asia-Pacific balances feedstock abundance with policy complexity. India's 100% EPR target and South Korea's Woven Capital-backed LD Carbon project illustrate clear momentum, yet inconsistent collection quality and capital constraints in Southeast Asia drag on utilization rates. China's national ETS, effective 2024, introduces carbon costs that are likely to sharpen the competitive edge of domestically produced rCB over imported virgin fillers.
- Alpha Carbone
- Black Bear Carbon B.V.
- Bolder Industries
- Cabot Corporation
- Carbon Recovery GmbH
- Continental AG
- ENRESTEC
- Klean Industries Inc.
- LD Carbon Co., Ltd.
- Orion Engineered Carbons GmbH
- Orion S.A.
- Pyrolyx AG
- Pyrum Innovations Ltd.
- Reoil Sp. z o.o.
- Scandinavian Enviro Systems AB
- SR2O Holdings LLC
- Strebl Green Carbon Pte Ltd.
Additional Benefits:
- The market estimate (ME) sheet in Excel format
- 3 months of analyst support
TABLE OF CONTENTS
1 Introduction
- 1.1 Study Assumptions and Market Definition
- 1.2 Scope of the Study
2 Research Methodology
3 Executive Summary
4 Market Landscape
- 4.1 Market Overview
- 4.2 Market Drivers
- 4.2.1 Environmental Sustainability and Circular-Economy Mandates
- 4.2.2 OEM Target of >=40 % Sustainable Materials in Tires By 2030
- 4.2.3 Cost Advantage Versus Virgin Carbon Black
- 4.2.4 EU Carbon Border Adjustment Mechanism (CBAM) Incentives
- 4.2.5 rCB Use in Conductive Polymer Composites for 5G and EV EMI Shielding
- 4.3 Market Restraints
- 4.3.1 Limited Infrastructure and Immature Pyrolysis Technologies
- 4.3.2 Feed-Stock Quality Variability from Fragmented Collectors
- 4.3.3 Potential REACH Reclassification of Pyrolysis Oils
- 4.4 Value Chain Analysis
- 4.5 Technological Outlook
- 4.6 Porter's Five Forces
- 4.6.1 Bargaining Power of Suppliers
- 4.6.2 Bargaining Power of Buyers
- 4.6.3 Threat of New Entrants
- 4.6.4 Threat of Substitutes
- 4.6.5 Degree of Competition
5 Market Size and Growth Forecasts (Volume)
- 5.1 By Grade
- 5.1.1 Rubber Grade rCB
- 5.1.2 Specialty/Conductive Grade rCB
- 5.2 By Production Technology
- 5.2.1 Pyrolysis
- 5.2.2 Gasification
- 5.2.3 Other Production Technologies
- 5.3 By Application
- 5.3.1 Tires
- 5.3.2 Plastics
- 5.3.3 Batteries
- 5.3.4 Non-tyre Rubber
- 5.3.5 Dyes and Pigments
- 5.4 By End-user Industry
- 5.4.1 Automotive
- 5.4.2 Printing and Packaging
- 5.4.3 Industrial
- 5.4.4 Building and Construction
- 5.4.5 Electronics
- 5.4.6 Other End-user Industries (Energy Storage)
- 5.5 By Geography
- 5.5.1 Asia-Pacific
- 5.5.1.1 China
- 5.5.1.2 India
- 5.5.1.3 Japan
- 5.5.1.4 South Korea
- 5.5.1.5 ASEAN Countries
- 5.5.1.6 Rest of Asia-Pacific
- 5.5.2 North America
- 5.5.2.1 United States
- 5.5.2.2 Canada
- 5.5.2.3 Mexico
- 5.5.3 Europe
- 5.5.3.1 Germany
- 5.5.3.2 United Kingdom
- 5.5.3.3 France
- 5.5.3.4 Italy
- 5.5.3.5 Spain
- 5.5.3.6 NORDIC Countries
- 5.5.3.7 Rest of Europe
- 5.5.4 South America
- 5.5.4.1 Brazil
- 5.5.4.2 Argentina
- 5.5.4.3 Rest of South America
- 5.5.5 Middle-East and Africa
- 5.5.5.1 Saudi Arabia
- 5.5.5.2 United Arab Emirates
- 5.5.5.3 South Africa
- 5.5.5.4 Egypt
- 5.5.5.5 Nigeria
- 5.5.5.6 Rest of Middle-East and Africa
- 5.5.1 Asia-Pacific
6 Competitive Landscape
- 6.1 Market Concentration
- 6.2 Strategic Moves
- 6.3 Market Share Analysis
- 6.4 Company Profiles (includes Global level Overview, Market level overview, Core Segments, Financials as available, Strategic Information, Products and Services, and Recent Developments)
- 6.4.1 Alpha Carbone
- 6.4.2 Black Bear Carbon B.V.
- 6.4.3 Bolder Industries
- 6.4.4 Cabot Corporation
- 6.4.5 Carbon Recovery GmbH
- 6.4.6 Continental AG
- 6.4.7 ENRESTEC
- 6.4.8 Klean Industries Inc.
- 6.4.9 LD Carbon Co., Ltd.
- 6.4.10 Orion Engineered Carbons GmbH
- 6.4.11 Orion S.A.
- 6.4.12 Pyrolyx AG
- 6.4.13 Pyrum Innovations Ltd.
- 6.4.14 Reoil Sp. z o.o.
- 6.4.15 Scandinavian Enviro Systems AB
- 6.4.16 SR2O Holdings LLC
- 6.4.17 Strebl Green Carbon Pte Ltd.
7 Market Opportunities and Future Outlook
- 7.1 White-space and Unmet-need Assessment
- 7.2 Need for Green Alternatives to Reduce Carbon Footprints

 2026年全球再生炭黑市場報告
 再生炭黑市場:依原料、形態、製造方法、應用、終端用戶產業及通路分類-2026-2032年全球市場預測
 輪胎熱解及回收炭黑市場預測至2034年-全球分析(依產品類型、回收炭黑等級、熱解製程、原料種類、應用、最終用戶及地區分類)
 再生炭黑市場規模、佔有率、成長及全球產業分析:按類型、應用和地區分類,並提供2026-2034年的洞察和預測
 再生炭黑市場規模、佔有率及成長分析(按應用和地區分類)-2026-2033年產業預測
 全球再生炭黑市場:市場規模、佔有率、趨勢分析(按應用和地區)、細分市場預測(2025-2030 年)