


 |
市場調查報告書
商品編碼
2125293
社會網路:市場佔有率分析、產業趨勢與統計、成長預測(2026-2031)Social Networking - Market Share Analysis, Industry Trends & Statistics, Growth Forecasts (2026 - 2031) |
||||||

※ 本網頁內容可能與最新版本有所差異。詳細情況請與我們聯繫。
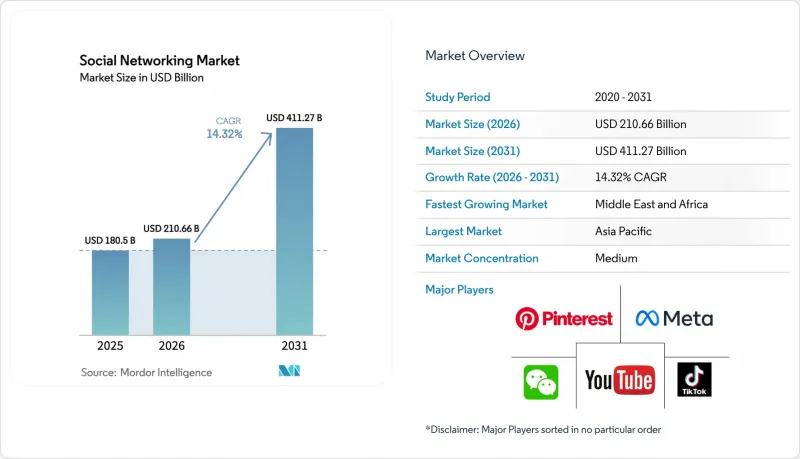
根據 Mordor Intelligence 預測,社群網路市場規模將從 2025 年的 1,805 億美元成長到 2026 年的 2,106.6 億美元,到 2031 年將達到 4,112.7 億美元,2026 年至 2031 年的複合年成長率為 14.32%。
本報告依收入來源(廣告、應用程式內收費、訂閱、虛擬商品及禮品)、裝置類型(智慧型手機等)、平台類型(傳統社群網路等)、使用者年齡層(13-24歲、25-34歲、35-44歲、45歲以上)及地區進行細分。市場預測以美元計價。
全球社交網路市場趨勢與洞察
行動網際網路普及率不斷上升
2025年,全球智慧型手機用戶數將達到57億,5G用戶數將超過19億人。這將使已開發市場的平均每月數據使用量增加到25GB。目前,首次上網用戶主要透過低成本的安卓設備連接網路,光是印度在2023年至2025年間就將新增1.2億智慧型手機用戶。在頻寬的地區,結合輕量級應用程式和3G備用模式的平台正在贏得市場佔有率,例如,菲律賓2025年的平均每日社群媒體使用時長將達到3小時32分鐘。這種情況進一步增強了全球社交網路市場在不依賴桌上型電腦的情況下觸達新用戶的能力。
社群媒體數位廣告支出激增
2025年,隨著品牌將預算轉向融合內容發現和支付功能的「Stories」、「Reels」和「Shop」標籤頁,Instagram 佔據了 Meta 美國廣告收入的一半以上。機器學習模型顯示,Meta 平台的每次轉換成本 (CPA) 年減了 18%,證明了以效果為先的預算分配策略的有效性。 Snap 在 2025 年第三季錄得 15 億美元的收入,其中擴增實境(AR) 濾鏡的曝光量佔比 22%,點擊率 (CTR) 比靜態廣告單元高出 30%。這種支出勢頭正在推動全球社交網路市場持續實現盈利。
加強資料隱私和安全法規
2024年,歐盟因Meta違反《一般資料保護規範》(GDPR)對其處以2.51億歐元(約2.68億美元)的罰款,使自2018年以來的累積罰款總額達到12億歐元(約12.8億美元)。澳洲將於2025年12月10日起禁止16歲以下用戶存取社交網路,將迫使平台實施年齡驗證機制,可能帶來4,950萬澳元(約3,270萬美元)的潛在違規風險。數據本地化、用戶許可管理和審計等方面的合規性投資正在推高全球社交網路市場的成本結構。
細分市場分析
預計到2025年,廣告收入將佔總收入的87.03%,凸顯了廣告在全球社群網路市場的壓倒性影響力。由於演算法調整降低了每次點擊成本,使得廣告商能夠以累計5美元的價格獲取用戶,Meta在2025年第三季錄得501億美元的廣告收入。儘管與廣告支出密切相關的全球社群網路市場規模仍超過其他收入來源,但其面臨的風險也不斷增加。
虛擬商品和禮物是成長最快的收入來源,預計到2031年將以14.89%的複合年成長率成長。 TikTok在2024年向創作者支付的25億美元收入表明,用戶直接向創作者付費,繞過安全隔離網閘廣告交易平台,具有巨大的潛力。訂閱服務也變得越來越重要,Snapchat+憑藉其1,700萬用戶,每季可創造1.5億美元的收入。這種收入結構的轉變正在減輕經濟波動對全球社交網路產業的影響,並確保可預測的現金流。
預計到2025年,智慧型手機將佔用戶會話總數的78.21%,鞏固其在全球社群網路市場的主要介面地位。平板電腦和桌上型電腦的佔有率將保持相對較低,這主要是因為它們與長影片和商務社交活動聯繫更為緊密。
同時,預計到2031年,穿戴式裝置和其他外形規格將以15.72%的複合年成長率成長。 Meta的Messenger與Quest頭戴裝置以及更廣泛的智慧型手錶通知生態系統的整合,實現了快速回復和語音輸入文字的功能。就穿戴式裝置驅動的全球社交網路市場規模而言,裝置間同步和低延遲身分管理仍然是障礙,但高所得地區的普及表明,人們正在向「始終在線」的環境轉變。
區域分析
亞太地區在中國超級應用生態系統的支持下,以及印度在2023年至2025年間新增的1.2億智慧型手機用戶,預計將在2025年佔據全球34.83%的營收佔有率。 TikTok在東南亞的月均使用時長超過45小時,而在印度尼西亞,42.6%的上網時間都花在了社交媒體上。隨著在地化介面和整合支付功能的日益普及,源自該地區的全球社交網路市場規模預計將進一步擴大。
預計到2031年,中東和非洲地區的複合年成長率將達到15.81%,成為全球成長最快的地區。沙烏地阿拉伯的社群媒體滲透率預計到2025年將達到111%,而阿拉伯聯合大公國(阿拉伯聯合大公國)的社群電商轉換率已達73%。在「2030願景」框架下,一項耗資27億美元的資料中心擴建專案正在降低即時購物和擴增實境(AR)技術的延遲,從而拓展商業化機會。
北美和歐洲仍是主要的收入來源,這主要得益於其較高的用戶平均收入(ARPU),但由於用戶群體較為成熟,成長率僅為個位數。 GDPR、CCPA 以及持續的反托拉斯訴訟帶來的監管成本正在擠壓利潤空間。在南美洲和非洲,使用者群體正以驚人的速度成長。預計到 2025 年,巴西的滲透率將超過 70%,而奈及利亞龐大的年輕人口也蘊藏著巨大的成長潛力,但由於基礎設施不足和可支配收入較低,其商業化進程較為滯後。澳洲禁止 16 歲以下用戶註冊,這表明即使在原本可能是高價值的市場,區域法規也會限制目標受眾的範圍。
其他好處:
- Excel格式的市場預測(ME)表
- 3個月的分析師支持
目錄
第1章:引言
- 研究假設和市場定義
- 調查範圍
第2章:調查方法
第3章執行摘要
第4章 市場狀況
- 市場概覽
- 市場促進因素
- 行動網際網路普及率不斷上升
- 社群媒體數位廣告支出激增
- 按地區分類的短影片分佈
- 社群電商和直播購物工具的擴展
- 去中心化社交協議和區塊鏈身份的傳播
- 合成媒體影響者正在開創一種新的互動模式。
- 市場限制因素
- 加強資料隱私和安全方面的監管
- 全球反壟斷審查主導平台
- 使用者注意力飽和與參與疲勞
- 演算法偏見和錯誤訊息正在損害品牌安全。
- 產業價值鏈分析
- 監理情勢
- 技術展望
- 宏觀經濟因素對市場的影響
- 波特五力分析
- 關鍵案例研究和用例分析
第5章 市場規模與成長預測
- 按收入來源
- 廣告
- 應用程式內收費
- 訂閱
- 虛擬商品和禮物
- 依設備類型
- 智慧型手機
- 藥片
- 桌上型電腦或筆記型電腦
- 穿戴式裝置及其他
- 依平台類型
- 傳統社群網路
- 媒體共用網路
- 通訊或通訊應用
- 專業網路
- 小眾和基於興趣的網路
- 分散式網路或Web3網路
- 按使用者人口統計資料(年齡層)
- 13-24歲
- 25-34歲
- 35-44歲
- 45歲或以上
- 按地區
- 北美洲
- 美國
- 加拿大
- 墨西哥
- 南美洲
- 巴西
- 阿根廷
- 其他南美國家
- 歐洲
- 英國
- 德國
- 法國
- 義大利
- 西班牙
- 其他歐洲國家
- 亞太地區
- 中國
- 印度
- 日本
- 韓國
- 東南亞
- 澳洲
- 其他亞太國家
- 中東
- 沙烏地阿拉伯
- UAE
- 土耳其
- 其他中東國家
- 非洲
- 南非
- 奈及利亞
- 埃及
- 其他非洲國家
- 北美洲
第6章 競爭情勢
- 市場集中度
- 策略趨勢
- 市佔率分析
- 公司簡介
- Meta Platforms Inc.
- Alphabet Inc.
- ByteDance Ltd.
- Tencent Holdings Ltd.
- Snap Inc.
- Pinterest Inc.
- Reddit Inc.
- X Corp.
- LinkedIn Corporation
- Discord Inc.
- Telegram FZ-LLC
- Kuaishou Technology
- LINE Corporation
- VK Company Limited
- Weibo Corporation
- Baidu Inc.
- Tumblr(Automattic Inc.)
- Quora Inc.
- Clubhouse Media Group Inc.
- Mastodon gGmbH
第7章 市場機會與未來展望
According to Mordor Intelligence, the social networking market size is expected to increase from USD 180.5 billion in 2025 to USD 210.66 billion in 2026 and reach USD 411.27 billion by 2031, growing at a CAGR of 14.32% over 2026-2031.
This report is Segmented by Revenue Stream (Advertising, In-App Purchases, Subscriptions, and Virtual Goods and Gifting), Device Type (Smartphone, and More), Platform Type (Traditional Social Networks, and More), User Demographics (13-24 Years, 25-34 Years, 35-44 Years, and 45+ Years), and Geography. The Market Forecasts are Provided in Terms of Value (USD).
Global Social Networking Market Trends and Insights
Rising Mobile-Internet Penetration
Global smartphone users reached 5.7 billion in 2025, and 5G subscriptions crossed 1.9 billion connections, lifting average monthly data use to 25 gigabytes in developed markets. First-time internet access now occurs primarily through budget Android handsets, with India alone adding 120 million smartphone users during 2023-2025. Platforms that bundle lite apps and 3G-fallback modes win share in bandwidth-constrained regions, as illustrated by the Philippines' daily average of 3 hours 32 minutes on social media in 2025. These conditions reinforce the global social networking market's ability to reach new users without desktop dependence.
Surge in Digital Ad Spend on Social Media
Instagram supplied more than half of Meta's United States advertising revenue in 2025 as brands redirected budgets to Stories, Reels, and Shop tabs that merge content discovery with checkout. Machine-learning models lowered cost-per-acquisition on Meta platforms by 18% year over year, validating performance-first budget allocations. Snap logged USD 1.5 billion in third-quarter 2025 revenue, with augmented-reality lenses driving 22% of impressions and 30% higher click-through rates than static units. Spending momentum supports sustained monetization across the global social networking market.
Intensifying Data-Privacy and Security Regulations
The European Union fined Meta EUR 251 million (USD 268 million) in 2024 for GDPR breaches, lifting cumulative penalties to EUR 1.2 billion (USD 1.28 billion) since 2018. Australia's under-16 access ban, effective 10 December 2025, forces platforms to deploy age-verification layers and accept AUD 49.5 million (USD 32.7 million) breach risks. Compliance investments in data localization, consent management, and audits elevate cost structures across the global social networking market.
Other drivers and restraints analyzed in the detailed report include:
- Short-Form Video Adoption Across Regions
- Expansion of Social Commerce and Live Shopping Tools
- Global Antitrust Scrutiny of Dominant Platforms
For complete list of drivers and restraints, kindly check the Table Of Contents.
Segment Analysis
Advertising generated 87.03% of 2025 revenue, confirming its outsized influence on the global social networking market. Meta booked USD 50.1 billion in third-quarter 2025 ad sales after algorithmic tweaks cut cost-per-click, helping advertisers secure sub-USD 5 acquisition costs. The global social networking market size tied to ad spend still dwarfs other levers, but risk exposure is growing.
Virtual goods and gifting are the fastest-rising stream, advancing at a 14.89% CAGR through 2031. TikTok's USD 2.5 billion creator payouts in 2024 illustrate how direct user-to-creator payments can scale without gatekeeper ad exchanges. Subscriptions are gaining relevance, with Snapchat+ delivering USD 150 million in quarterly revenue from 17 million users. The revenue remix reduces cyclicality in the global social networking industry and unlocks predictable cash flow.
Smartphones retained 78.21% of user sessions in 2025, cementing their role as the dominant interface for the global social networking market. Tablets and desktops held modest shares linked to long-form video and professional networking.
Wearables and "other" form factors, however, are projected to post a 15.72% CAGR to 2031. Meta's Messenger integration into Quest headsets and broader smartwatch notification ecosystems allow quick replies and voice-to-text input. For the global social networking market size attributed to wearables, cross-device sync and low-latency identity management remain gating factors, but adoption in high-income regions signals a shift toward always-on ambient networking.
Complete Report Scope:
- By Revenue Stream
- Advertising
- In-App Purchases
- Subscriptions
- Virtual Goods and Gifting
- By Device Type
- Smartphone
- Tablet
- Desktop or Laptop
- Wearable and Others
- By Platform Type
- Traditional Social Networks
- Media-Sharing Networks
- Messaging or Communication Apps
- Professional Networks
- Niche and Interest-Based Networks
- Decentralized or Web3 Networks
- By User Demographics (Age Group)
- 13-24 Years
- 25-34 Years
- 35-44 Years
- 45+ Years
- By Geography
- North America
- United States
- Canada
- Mexico
- South America
- Brazil
- Argentina
- Rest of South America
- Europe
- United Kingdom
- Germany
- France
- Italy
- Spain
- Rest of Europe
- Asia Pacific
- China
- India
- Japan
- South Korea
- Southeast Asia
- Australia
- Rest of Asia Pacific
- Middle East
- Saudi Arabia
- UAE
- Turkey
- Rest of Middle East
- Africa
- South Africa
- Nigeria
- Egypt
- Rest of Africa
- North America
Geography Analysis
Asia Pacific produced 34.83% of 2025 revenue, powered by China's super-app ecosystems and India's 120 million new smartphone users added during 2023-2025. TikTok usage in Southeast Asia exceeded 45 hours per month, and Indonesia devoted 42.6% of online time to social media. The global social networking market size attributable to the region is poised for further upticks as vernacular interfaces and integrated payments deepen adoption.
The Middle East and Africa is forecast to register a 15.81% CAGR through 2031, the fastest globally. Saudi Arabia's social-media penetration reached 111% in 2025, while the United Arab Emirates posted a 73% social-commerce conversion rate. Data-center buildouts under Vision 2030, worth USD 2.7 billion, reduce latency for live shopping and augmented reality, widening monetization capacity.
North America and Europe remain income leaders thanks to high average revenue per user, but their mature user bases mean single-digit growth. Regulatory expenses linked to GDPR, CCPA, and pending antitrust actions temper margins. South America and Africa boast faster user-base expansion; Brazil's penetration crossed 70% in 2025, and Nigeria's youthful demographics present large upside, yet monetization trails due to infrastructure gaps and lower disposable income. Australia's under-16 ban illustrates how regional regulation can curtail reachable audiences in otherwise high-value markets.
- Meta Platforms Inc.
- Alphabet Inc.
- ByteDance Ltd.
- Tencent Holdings Ltd.
- Snap Inc.
- Pinterest Inc.
- Reddit Inc.
- X Corp.
- LinkedIn Corporation
- Discord Inc.
- Telegram FZ-LLC
- Kuaishou Technology
- LINE Corporation
- VK Company Limited
- Weibo Corporation
- Baidu Inc.
- Tumblr (Automattic Inc.)
- Quora Inc.
- Clubhouse Media Group Inc.
- Mastodon gGmbH
Additional Benefits:
- The market estimate (ME) sheet in Excel format
- 3 months of analyst support
TABLE OF CONTENTS
1 INTRODUCTION
- 1.1 Study Assumptions and Market Definition
- 1.2 Scope of the Study
2 RESEARCH METHODOLOGY
3 EXECUTIVE SUMMARY
4 MARKET LANDSCAPE
- 4.1 Market Overview
- 4.2 Market Drivers
- 4.2.1 Rising Mobile-Internet Penetration
- 4.2.2 Surge in Digital Ad Spend on Social Media
- 4.2.3 Short-Form Video Adoption Across Regions
- 4.2.4 Expansion of Social Commerce and Live Shopping Tools
- 4.2.5 Decentralized Social Protocols and Blockchain ID Adoption
- 4.2.6 Synthetic-Media Influencers Unlocking New Engagement Models
- 4.3 Market Restraints
- 4.3.1 Intensifying Data-Privacy and Security Regulations
- 4.3.2 Global Antitrust Scrutiny of Dominant Platforms
- 4.3.3 User-Attention Saturation and Engagement Fatigue
- 4.3.4 Algorithmic Bias and Misinformation Hurting Brand Safety
- 4.4 Industry Value-Chain Analysis
- 4.5 Regulatory Landscape
- 4.6 Technological Outlook
- 4.7 Impact of Macroeconomic Factors on the Market
- 4.8 Porter's Five Forces Analysis
- 4.8.1 Bargaining Power of Suppliers
- 4.8.2 Bargaining Power of Buyers or Consumers
- 4.8.3 Threat of New Entrants
- 4.8.4 Threat of Substitute Products
- 4.8.5 Intensity of Competitive Rivalry
- 4.9 Analysis of Major Case Studies and Use Cases
5 MARKET SIZE AND GROWTH FORECASTS (VALUES)
- 5.1 By Revenue Stream
- 5.1.1 Advertising
- 5.1.2 In-App Purchases
- 5.1.3 Subscriptions
- 5.1.4 Virtual Goods and Gifting
- 5.2 By Device Type
- 5.2.1 Smartphone
- 5.2.2 Tablet
- 5.2.3 Desktop or Laptop
- 5.2.4 Wearable and Others
- 5.3 By Platform Type
- 5.3.1 Traditional Social Networks
- 5.3.2 Media-Sharing Networks
- 5.3.3 Messaging or Communication Apps
- 5.3.4 Professional Networks
- 5.3.5 Niche and Interest-Based Networks
- 5.3.6 Decentralized or Web3 Networks
- 5.4 By User Demographics (Age Group)
- 5.4.1 13-24 Years
- 5.4.2 25-34 Years
- 5.4.3 35-44 Years
- 5.4.4 45+ Years
- 5.5 By Geography
- 5.5.1 North America
- 5.5.1.1 United States
- 5.5.1.2 Canada
- 5.5.1.3 Mexico
- 5.5.2 South America
- 5.5.2.1 Brazil
- 5.5.2.2 Argentina
- 5.5.2.3 Rest of South America
- 5.5.3 Europe
- 5.5.3.1 United Kingdom
- 5.5.3.2 Germany
- 5.5.3.3 France
- 5.5.3.4 Italy
- 5.5.3.5 Spain
- 5.5.3.6 Rest of Europe
- 5.5.4 Asia Pacific
- 5.5.4.1 China
- 5.5.4.2 India
- 5.5.4.3 Japan
- 5.5.4.4 South Korea
- 5.5.4.5 Southeast Asia
- 5.5.4.6 Australia
- 5.5.4.7 Rest of Asia Pacific
- 5.5.5 Middle East
- 5.5.5.1 Saudi Arabia
- 5.5.5.2 UAE
- 5.5.5.3 Turkey
- 5.5.5.4 Rest of Middle East
- 5.5.6 Africa
- 5.5.6.1 South Africa
- 5.5.6.2 Nigeria
- 5.5.6.3 Egypt
- 5.5.6.4 Rest of Africa
- 5.5.1 North America
6 COMPETITIVE LANDSCAPE
- 6.1 Market Concentration
- 6.2 Strategic Moves
- 6.3 Market Share Analysis
- 6.4 Company Profiles (includes Global level Overview, Market level overview, Core Segments, Financials as available, Strategic Information, Market Rank/Share for key companies, Products and Services, and Recent Developments)
- 6.4.1 Meta Platforms Inc.
- 6.4.2 Alphabet Inc.
- 6.4.3 ByteDance Ltd.
- 6.4.4 Tencent Holdings Ltd.
- 6.4.5 Snap Inc.
- 6.4.6 Pinterest Inc.
- 6.4.7 Reddit Inc.
- 6.4.8 X Corp.
- 6.4.9 LinkedIn Corporation
- 6.4.10 Discord Inc.
- 6.4.11 Telegram FZ-LLC
- 6.4.12 Kuaishou Technology
- 6.4.13 LINE Corporation
- 6.4.14 VK Company Limited
- 6.4.15 Weibo Corporation
- 6.4.16 Baidu Inc.
- 6.4.17 Tumblr (Automattic Inc.)
- 6.4.18 Quora Inc.
- 6.4.19 Clubhouse Media Group Inc.
- 6.4.20 Mastodon gGmbH
7 MARKET OPPORTUNITIES AND FUTURE OUTLOOK
- 7.1 White-Space and Unmet-Need Assessment

 全球社交網路市場規模、佔有率、趨勢和成長分析報告(2026-2034)
 社群網路市場規模、佔有率和成長分析:按平台類型、收入模式、設備、最終用戶和地區分類-2026-2033年產業預測
 鄰里社交網路市場預測至2034年-按平台類型、功能類型、使用者類型、存取平台、收入模式、用例和區域分類的全球分析
 2026年全球去中心化社群網路市場報告
 基於雲端的社群媒體管理市場:按元件、應用程式和地區分類Web3社群媒體平台全球市場報告(2026年)2026年全球社交網路市場報告2026年全球社群媒體訂閱市場報告2026年全球社群媒體內容創作市場報告2026年全球社群媒體市場報告