


 |
市場調查報告書
商品編碼
2125286
亞太交易所(AC)驅動:市場佔有率分析、行業趨勢和統計數據以及成長預測(2026-2031 年)Asia-Pacific Alternating Current (AC) Drive - Market Share Analysis, Industry Trends & Statistics, Growth Forecasts (2026 - 2031) |
||||||

※ 本網頁內容可能與最新版本有所差異。詳細情況請與我們聯繫。
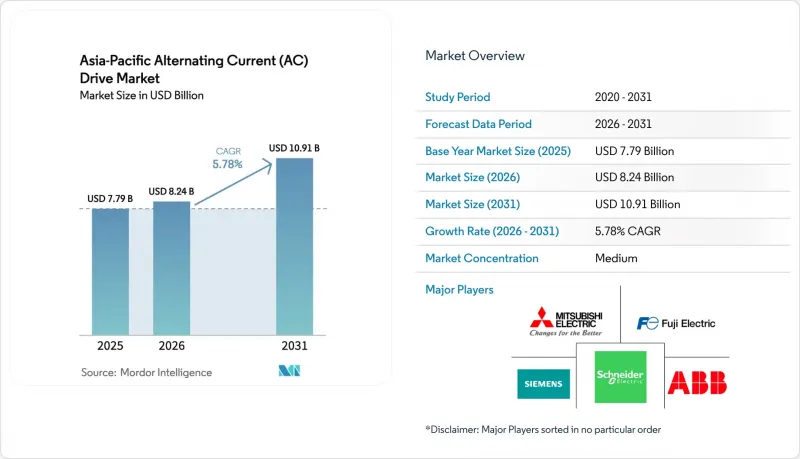
據 Mordor Intelligence 稱,亞太地區交流變頻器市場預計到 2026 年價值 82.4 億美元,高於 2025 年的 77.9 億美元,預計到 2031 年將達到 109.1 億美元。
預計 2026 年至 2031 年的複合年成長率為 5.78%。
本報告按電壓(低壓、中壓)、額定輸出功率(0.4kW以下、0.4-11kW、其他)、驅動系統(VSI、CSI、PWM)、應用(泵浦、風機、壓縮機、其他)、終端用戶產業(石油天然氣、化學和石化、發電、水和污水處理、金屬和採礦、離散製造空調、其他地區進行細分、開發食品、發電、水和廢水處理、金屬和採礦、離散製造空調地區。市場預測以美元(USD)計價。
亞太地區交流驅動器市場趨勢與洞察
對節能和能源效率的需求日益成長
在亞太地區,電機系統消耗了製造業近45%的電力,因此自然成為節能措施的重點。隨著中國2024年標準將功率超過0.75kW的馬達最低能效等級提升至IE3,許多工廠開始將高效率馬達與變頻驅動器結合。 2024年至2025年間工業電價上漲18%,使得驅動器的平均投資回收期縮短至不到兩年,加速了維修進程。新加坡類似的強制性IE3標準進一步加劇了全部區域的監管需求。如今,工廠管理人員正利用雲端儀錶板追蹤節能情況,數據顯示水泵和風扇的負載降低了20%至50%,鞏固了驅動器作為提升營運效率核心要素的地位。
快速工業化與城市發展
印度耗資1.4兆美元的「國家基礎設施計畫」新增了機場、地鐵和智慧工廠等項目,這些項目都需要精確的馬達控制。一項260億美元的「生產連結獎勵計畫計畫」正在促進新建電子和汽車工廠的位置,這些工廠都對輸送機、壓平機和暖通空調系統的驅動裝置有特定要求。東南亞也出現了類似的趨勢。越南的出口導向工業園區從營運初就採用先進的驅動裝置,以確保達到全球品質標準。曼谷、雅加達和馬尼拉的城市建築規範現在都納入了綠色建築的要求,這實際上鼓勵了變速暖通空調系統的運作。這些項目加在一起,即使全球貿易放緩,也能維持較高的基準需求。
中壓驅動器的初始投資成本高
一台中壓逆變器的價格可能超過10萬美元,還不包括現場佈線費用,這迫使財務部門謹慎行事。儘管升級中壓系統在整個生命週期中具有節省成本的潛力,但小規模礦場和供水事業仍在推遲升級計畫。 ABB的ACS8080逆變器於2024年11月推出,透過整合安全繼電器,可將面積減少25%,並最大限度地降低額外成本。即便如此,許多買家仍然選擇能源績效合約或驅動即服務(DaaS)模式,將負擔轉移到專業的能源服務公司(ESCO)身上。
細分市場分析
2025年,低壓驅動器在亞太地區交流變頻器市場佔有69.05%的佔有率。這反映了低電壓驅動器適用於額定電壓低於1kV的電機,這些電機廣泛應用於製造業和建築服務領域。由於零件價格下降,即使是中小型工廠也能負擔得起初始成本,因此2025年對低壓驅動器的需求依然強勁。雖然中壓驅動器目前市場佔有率較小,但預計到2031年,其年複合成長率將達到7.26%,這主要得益於採礦、海水淡化和區域冷卻項目對額定功率超過1MW的馬達的需求。
工業承包商擴大將中壓逆變器納入新設施設計中,以避免未來的維修費用。碳化矽 (SiC) 開關可將效率提升至 98%,顯著的節能效果也使營運商願意投入更多資金。在印度和越南進行本地組裝進一步降低了交付成本,而整合的安全功能則減少了對輔助面板的需求。總體而言,電壓配置的特點是低壓單元構成穩定的核心,而高階中壓解決方案市場正在加速成長。
2025年,額定功率在0.4至11千瓦之間的交流變頻器驅動器佔亞太市場37.12%的佔有率,為輕工業運作中的泵浦、風機和輸送機提供動力。標準化使得平均售價呈現逐步下降的趨勢,從而擴大了傳統定速馬達的維修範圍。儘管132千瓦以上的型號目前數量仍然較少,但預計在2026年至2031年間,其複合年成長率將達到6.68%,這主要得益於石化、地鐵和鋼鐵項目對高功率控制的需求,以降低能耗並提高製程穩定性。
高功率逆變器現在標配再生煞車和主動前端技術,提供符合電網品質標準的優勢,滿足電力監管機構的要求。 11 至 132 kW 的中功率型號內建雲端閘道器,無需額外硬體即可遠端監控。 0.4 kW 以下的功率段需求量適中但穩定,主要針對精密工具等特定應用領域。這種各功率等級需求均衡分佈,使得供應商不易受到特定輸出範圍需求波動的影響。
其他好處
- Excel格式的市場預測(ME)表
- 3個月的分析師支持
目錄
第1章:引言
- 研究假設和市場定義
- 調查範圍
第2章:調查方法
第3章執行摘要
第4章 市場狀況
- 市場概覽
- 市場促進因素
- 對節能和能源效率的需求日益成長
- 快速工業化與城市發展
- 政府促進工業電氣化的政策
- 降低電力電子元件的成本
- 亞太地區電機能效強制性標準。
- 使用可再生能源的水泵和風扇的安裝數量激增。
- 市場限制因素
- 中壓驅動器的初始投資成本高
- 驅動程式設計和調校方面的技術技能存在差距
- IGBT和功率模組的供應鏈波動
- 來自低成本本地製造商的價格壓力
- 產業價值鏈分析
- 監理情勢
- 技術展望
- 波特五力分析
- 宏觀經濟因素的影響
第5章 市場規模與成長預測
- 透過電壓
- 低電壓
- 中壓
- 按類型分類的額定輸出
- 0.4千瓦或更少
- 0.4~11kW
- 11~132kW
- 超過132千瓦
- 透過驅動系統
- VSI驅動器
- CSI 驅動器
- PWM驅動
- 透過使用
- 泵浦
- 扇子
- 壓縮機
- 輸送機
- HVAC
- 其他
- 按最終用戶行業分類
- 石油和天然氣
- 化工/石油化工
- 發電
- 水和污水處理
- 金屬和採礦
- HVAC
- 飲食
- 離散製造
- 其他
- 國家
- 中國
- 印度
- 日本
- 韓國
- 澳洲和紐西蘭
- 亞太其他地區
第6章 競爭情勢
- 市場集中度
- 策略趨勢
- 市佔率分析
- 公司簡介
- ABB Ltd.
- Siemens AG
- Schneider Electric SE
- Mitsubishi Electric Corporation
- Fuji Electric Co. Ltd.
- Danfoss A/S
- Hitachi Ltd.
- Toshiba Infrastructure Systems and Solutions Corporation
- Yaskawa Electric Corporation
- Nidec Corporation
- WEG Equipamentos Eletricos SA
- Hiconics Eco-Energy Technology Co. Ltd.
- Teco Electric and Machinery Co. Ltd.
- Rockwell Automation Inc.
- Larsen and Toubro Limited
- Inovance Technology Co. Ltd.
- Delta Electronics Inc.
- KEB Automation KG
- CG Power and Industrial Solutions Limited
- Bonfiglioli Riduttori SpA
第7章 市場機會與未來展望
According to Mordor Intelligence, the Asia-Pacific AC drive market size in 2026 is estimated at USD 8.24 billion, growing from 2025 value of USD 7.79 billion with 2031 projections showing USD 10.91 billion, growing at 5.78% CAGR over 2026-2031.
This report is Segmented by Voltage (Low Voltage, and Medium Voltage), Power Rating (Less Than or Equal To 0. 4 KW, 0. 4-11 KW, and More), Drive Type (VSI, CSI, and PWM), Application (Pumps, Fans, Compressors, and More), End-User (Oil and Gas, Chemical, Power, Water, Metals, HVAC, Food, Manufacturing, and More), and Geography. Market Forecasts are Provided in Terms of Value (USD).
Asia-Pacific Alternating Current (AC) Drive Market Trends and Insights
Increasing Demand for Energy Savings and Efficiency
Motor systems consume nearly 45% of all electricity used in Asia-Pacific manufacturing, making them a natural target for energy efficiency measures. China's 2024 standard raised minimum efficiencies to IE3 for motors above 0.75 kW, prompting many factories to pair premium-efficiency machines with variable-speed drives. As industrial power tariffs increased by 18% between 2024 and 2025, the average drive payback period dropped below two years, accelerating retrofit programs. Singapore imposed similar IE3 mandates, reinforcing a regionwide regulatory pull. Factory managers now verify energy savings using cloud dashboards that show 20-50% reductions in pump and fan loads, solidifying drives as a core element of operational excellence.
Rapid Industrialization and Urban Development
India's USD 1.4 trillion National Infrastructure Pipeline adds airports, metros, and smart factories that require precise motor control. Production-Linked Incentive schemes worth USD 26 billion anchor new electronics and automotive plants, each specifying drives for conveyors, presses, and HVAC systems. Southeast Asia is a parallel story: Vietnam's export-oriented industrial parks adopt advanced drives from day one to ensure global quality standards. Urban building codes in Bangkok, Jakarta, and Manila now embed green-building requirements that implicitly favor variable-speed HVAC operation. Together, these projects sustain high baseline demand even if global trade softens.
High Up-Front Capital Cost for Medium-Voltage Drives
A single medium-voltage (MV) inverter can exceed USD 100,000 before site wiring, making finance teams cautious. Smaller mines and water utilities defer MV upgrades despite lifecycle savings. The ABB ACS8080, launched in November 2024, reduces its footprint by 25% and integrates safety relays to minimize ancillary costs. Even so, many buyers adopt energy-performance contracts or drive-as-a-service models that shift the burden to specialist ESCOs.
Other drivers and restraints analyzed in the detailed report include:
- Government Policies Favoring Industrial Electrification
- Declining Cost of Power Electronics Components
- Technical Skill-Gap in Drive Programming and Tuning
For complete list of drivers and restraints, kindly check the Table Of Contents.
Segment Analysis
Low-voltage drives captured 69.05% of the Asia-Pacific AC drive market share in 2025, reflecting their suitability for the vast installed base of motors with a voltage rating of less than 1 kV across manufacturing and building services. Demand for these units remains solid in 2025 because falling component prices keep initial costs within reach of small and mid-size factories. Medium-voltage products, although a smaller slice today, are expected to benefit from a 7.26% CAGR through 2031 as mining, desalination, and district cooling projects specify power ratings above 1 MW.
Industrial contractors are increasingly designing medium-voltage inverters into new facilities to avoid later retrofit expenses. Silicon-carbide switches raise efficiency to 98%, helping operators justify higher capex with sharper energy savings. Local assembly in India and Vietnam further lowers delivered costs, while integrated safety functions reduce the need for auxiliary panels. Overall, the voltage mix shows a stable core in low-voltage units and an accelerating premium tier in medium-voltage solutions.
Drives rated 0.4-11 kW accounted for 37.12% of the Asia-Pacific AC drive market size in 2025, powering pumps, fans, and conveyors that underpin light-industry operations. Standardization keeps average selling prices on a gentle downward path, widening the retrofit pool for legacy fixed-speed motors. Units above 132 kW, although fewer in number, expand at a 6.68% CAGR as petrochemical, metro, and steel projects specify high-power control to reduce energy use and improve process stability between 2026 and 2031.
High-power inverters now ship with regenerative braking and active-front-end technology as standard features, adding grid-quality benefits that align with utility regulators' expectations. Mid-range 11-132 kW models incorporate built-in cloud gateways, allowing for remote monitoring without the need for additional hardware. Below 0.4 kW, niche applications in precision tooling maintain modest yet steady volumes. This balanced spread across power classes cushions suppliers from demand swings in any single rating band.
Complete Report Scope:
- By Voltage
- Low Voltage
- Medium Voltage
- By Power Rating
- less than or equal to 0.4 kW
- 0.4 - 11 kW
- 11 - 132 kW
- Above 132 kW
- By Drive Type
- VSI Drives
- CSI Drives
- PWM Drives
- By Application
- Pumps
- Fans
- Compressors
- Conveyors
- HVAC
- Other Application
- By End-User Industry
- Oil and Gas
- Chemical and Petrochemical
- Power Generation
- Water and Wastewater
- Metals and Mining
- HVAC
- Food and Beverage
- Discrete Manufacturing
- Other End-User Industry
- By Country
- China
- India
- Japan
- South Korea
- Australia and New Zealand
- Rest of Asia Pacific
List of Companies Covered in this Report:
- ABB Ltd.
- Siemens AG
- Schneider Electric SE
- Mitsubishi Electric Corporation
- Fuji Electric Co. Ltd.
- Danfoss A/S
- Hitachi Ltd.
- Toshiba Infrastructure Systems and Solutions Corporation
- Yaskawa Electric Corporation
- Nidec Corporation
- WEG Equipamentos Eletricos S.A.
- Hiconics Eco-Energy Technology Co. Ltd.
- Teco Electric and Machinery Co. Ltd.
- Rockwell Automation Inc.
- Larsen and Toubro Limited
- Inovance Technology Co. Ltd.
- Delta Electronics Inc.
- KEB Automation KG
- CG Power and Industrial Solutions Limited
- Bonfiglioli Riduttori S.p.A.
Additional Benefits:
- The market estimate (ME) sheet in Excel format
- 3 months of analyst support
TABLE OF CONTENTS
1 INTRODUCTION
- 1.1 Study Assumptions and Market Definition
- 1.2 Scope of the Study
2 RESEARCH METHODOLOGY
3 EXECUTIVE SUMMARY
4 MARKET LANDSCAPE
- 4.1 Market Overview
- 4.2 Market Drivers
- 4.2.1 Increasing Demand for Energy Savings and Efficiency
- 4.2.2 Rapid Industrialisation and Urban Development
- 4.2.3 Government Policies Favouring Industrial Electrification
- 4.2.4 Declining Cost of Power Electronics Components
- 4.2.5 Mandatory Motor-Efficiency Standards across Asia Pacific
- 4.2.6 Surge in Renewable-Powered Pump and Fan Installations
- 4.3 Market Restraints
- 4.3.1 High Up-Front Capital Cost for Medium-Voltage Drives
- 4.3.2 Technical Skill-Gap in Drive Programming and Tuning
- 4.3.3 Supply-Chain Volatility for IGBT and Power Modules
- 4.3.4 Price Pressure from Low-Cost Regional Manufacturers
- 4.4 Industry Value Chain Analysis
- 4.5 Regulatory Landscape
- 4.6 Technological Outlook
- 4.7 Porter's Five Forces Analysis
- 4.7.1 Threat of New Entrants
- 4.7.2 Threat of Substitutes
- 4.7.3 Bargaining Power of Buyers
- 4.7.4 Bargaining Power of Suppliers
- 4.7.5 Intensity of Competitive Rivalry
- 4.8 Impact of Macroeconomic Factors
5 MARKET SIZE AND GROWTH FORECASTS (VALUE)
- 5.1 By Voltage
- 5.1.1 Low Voltage
- 5.1.2 Medium Voltage
- 5.2 By Power Rating
- 5.2.1 less than or equal to 0.4 kW
- 5.2.2 0.4 - 11 kW
- 5.2.3 11 - 132 kW
- 5.2.4 Above 132 kW
- 5.3 By Drive Type
- 5.3.1 VSI Drives
- 5.3.2 CSI Drives
- 5.3.3 PWM Drives
- 5.4 By Application
- 5.4.1 Pumps
- 5.4.2 Fans
- 5.4.3 Compressors
- 5.4.4 Conveyors
- 5.4.5 HVAC
- 5.4.6 Other Application
- 5.5 By End-User Industry
- 5.5.1 Oil and Gas
- 5.5.2 Chemical and Petrochemical
- 5.5.3 Power Generation
- 5.5.4 Water and Wastewater
- 5.5.5 Metals and Mining
- 5.5.6 HVAC
- 5.5.7 Food and Beverage
- 5.5.8 Discrete Manufacturing
- 5.5.9 Other End-User Industry
- 5.6 By Country
- 5.6.1 China
- 5.6.2 India
- 5.6.3 Japan
- 5.6.4 South Korea
- 5.6.5 Australia and New Zealand
- 5.6.6 Rest of Asia Pacific
6 COMPETITIVE LANDSCAPE
- 6.1 Market Concentration
- 6.2 Strategic Moves
- 6.3 Market Share Analysis
- 6.4 Company Profiles (includes Global Level Overview, Market Level Overview, Core Segments, Financials as available, Strategic Information, Market Rank/Share for key companies, Products and Services, and Recent Developments)
- 6.4.1 ABB Ltd.
- 6.4.2 Siemens AG
- 6.4.3 Schneider Electric SE
- 6.4.4 Mitsubishi Electric Corporation
- 6.4.5 Fuji Electric Co. Ltd.
- 6.4.6 Danfoss A/S
- 6.4.7 Hitachi Ltd.
- 6.4.8 Toshiba Infrastructure Systems and Solutions Corporation
- 6.4.9 Yaskawa Electric Corporation
- 6.4.10 Nidec Corporation
- 6.4.11 WEG Equipamentos Eletricos S.A.
- 6.4.12 Hiconics Eco-Energy Technology Co. Ltd.
- 6.4.13 Teco Electric and Machinery Co. Ltd.
- 6.4.14 Rockwell Automation Inc.
- 6.4.15 Larsen and Toubro Limited
- 6.4.16 Inovance Technology Co. Ltd.
- 6.4.17 Delta Electronics Inc.
- 6.4.18 KEB Automation KG
- 6.4.19 CG Power and Industrial Solutions Limited
- 6.4.20 Bonfiglioli Riduttori S.p.A.
7 MARKET OPPORTUNITIES AND FUTURE OUTLOOK
- 7.1 White-Space and Unmet-Need Assessment

 全球氣動馬達市場(2026-2030 年)
 農業馬達市場規模、佔有率和成長分析:按產品類型、額定功率、應用、安裝方式、分銷管道和地區分類-2026-2033年產業預測
 AC馬達:市場佔有率分析、產業趨勢與統計、成長預測(2026-2031)歐洲交流馬達:市場佔有率分析、產業趨勢與統計及成長預測(2026-2031)
 防爆伺服馬達市場規模、佔有率和成長分析:按馬達類型、保護類型、應用、最終用戶、額定功率和地區分類 - 產業預測,2026-2033年
 石油天然氣產業交流電機市場:類型、輸出、額定電壓、相數、安裝方式、應用、最終用途-2026-2032年全球市場預測交流馬達市場:馬達類型、輸出功率、電壓等級、控制方式、相數、調速、應用、通路、最終用途-2026-2032年全球市場預測
 2026年全球馬達測試設備市場報告
 氣動馬達市場規模、佔有率和成長分析:按產品類型、功率、應用、終端用戶產業、馬達配置、安裝方式和地區分類-2026-2033年產業預測
 2026-2030年全球扭力馬達市場