


 |
市場調查報告書
商品編碼
2125271
美國供應鏈管理軟體:市場佔有率分析、產業趨勢與統計及成長預測(2026-2031)U.S. Supply Chain Management Software - Market Share Analysis, Industry Trends & Statistics, Growth Forecasts (2026 - 2031) |
||||||

※ 本網頁內容可能與最新版本有所差異。詳細情況請與我們聯繫。
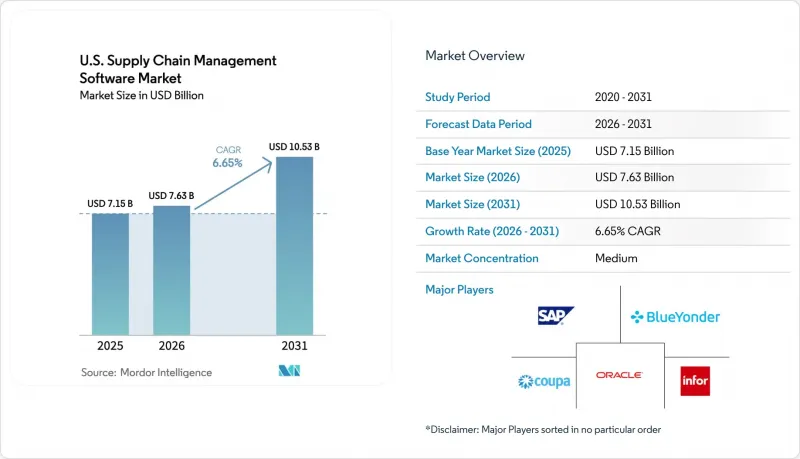
據 Mordor Intelligence 稱,2025 年美國供應鏈管理軟體市值為 71.5 億美元,預計到 2031 年將達到 105.3 億美元,而 2026 年成長率為 76.3 億美元,預測期(2026-2031 年)的複合年成長率為 6.65%。
本報告按解決方案類型(供應鏈計劃 (SCP)、採購和尋源等)、部署模式(本地部署和雲端部署)、組織規模(大型企業和中小企業 (SME))以及最終用戶(製造業、醫療保健和生命科學、零售和電子商務等)進行細分。市場預測以美元計價。
美國供應鏈管理軟體市場的趨勢與洞察
電子商務的快速成長和雲端優先技術的應用
在全通路銷售激增的推動下,零售商和醫療保健提供者都在尋求柔軟性的雲端原生解決方案,以便在高峰期進行擴展。雲端解決方案已佔據整體市場34%的佔有率,隨著企業從資本密集型升級轉向基於使用量的訂閱模式,這一比例正在迅速成長。醫院系統也呈現類似的趨勢,約有一半的醫院採用基於雲端的供應鏈工具,以確保關鍵物資的穩定供應。這種轉變並非純粹的技術層面,而是戰略層面的,它將成本與實際處理量掛鉤,同時減少了與主要版本發布相關的停機時間。因此,美國供應鏈管理軟體市場正在經歷多租戶部署的激增,這些部署提供快速分析、自動修補程式和災害復原功能,並將這些功能整合到服務等級協定 (SLA) 中。這一趨勢不斷擴大目標基本客群,吸引那些先前受制於基礎設施限制的企業,同時也進一步增強了供應商鎖定的障礙。
人工智慧驅動的規劃與分析平台
即時人工智慧協同駕駛正在將需求規劃週期從幾天縮短到幾分鐘,預計到2028年,四分之一的物流關鍵績效指標(KPI)將由人工智慧產生。例如,Kinaxis已將其Maestro引擎直接整合到其核心工作流程中,使規劃人員無需在不同模組之間切換即可自動進行場景建模。這種原生整合正在推動供應鏈軟體從單純的交易記錄管理工具發展成為能夠在中斷發生之前偵測到中斷的預測性決策系統。然而,只有六分之一的美國工廠能夠即時了解生產狀態,這顯示分析工具的應用仍有很大的提升空間。因此,儘管企業正在嘗試使用成本效益高的邊緣推理來控制不斷上漲的運算成本,但對人工智慧加速器的投入卻不斷增加。這些因素共同推動美國供應鏈管理軟體市場向更高附加價值、以洞察為中心的應用情境發展。
整合傳統ERP系統的複雜性
預計在主流支援結束前,只有不到 60% 的製造商會將老舊的 SAP 環境遷移到最新的 S/4HANA 系統。因此,數百個自訂介面仍未進行任何變更。整合專案需要進行資料清理、流程重新設計以及建置新的網路安全層。由於犯罪者利用未打補丁的模組,針對舊版 SAP 系統的攻擊在 2021 年至 2023 年間增加了三倍。隨著財務長們力推數位化投資以期獲得短期回報,專案預算不斷膨脹,工期也隨之延長。為了降低風險,許多公司正在試行「API 優先」的微服務架構,該架構封裝了舊版核心系統,同時並行運行新的雲端分析功能。雖然這種策略能夠更快地帶來切實可見的成果,但底層的技術債仍會拖慢整體遷移的步伐,從而抑制美國供應鏈管理軟體市場的潛在成長。
細分市場分析
供應鏈規劃仍是重要的收入支柱,預計到2025年將占美國供應鏈管理軟體市場31.12%的佔有率。隨著企業尋求應對訂單波動的韌性,需求預測模組和庫存最佳化引擎的升級仍在繼續。同時,供應鏈分析和人工智慧領域正以7.05%的複合年成長率快速成長,凸顯出企業正朝著「指導性洞察」的方向發展,以補充現有的規劃基礎。倉庫管理系統(WMS)和運輸管理系統(TMS)能夠即時提升產能,因此吸引了穩定的支出。北美WMS供應商佔了全球整體收入的一半以上,這反映了他們深厚的專業知識。隨著可追溯性和ESG(環境、社會和治理)要求的日益嚴格,採購和尋源工具正重新受到關注。儘管風險和合規的單點解決方案合約規模較小,但其成長速度已超過歷史平均水平,這得益於美國海關強制執行的強制勞動篩檢功能的商業化。 Coupa的年收入達10億美元,凸顯了市場對整合支出管理、尋源和供應商風險管理平台的強勁需求。
客戶越來越傾向於選擇整合人工智慧輔助功能的完整套件,而非附加分析模組,Kinaxis 的 Maestro 版本就體現了這一趨勢。這種轉變簡化了使用者體驗,減少了資料整合帶來的摩擦,並將分析功能自然地融入規劃流程中。因此,預計到 2031 年,美國供應鏈管理軟體市場中整合分析功能的完整套件的市場規模將超過核心交易模組。對供應商而言,交叉銷售的綜效正在提升合約的生命週期價值。採用整合分析功能的規劃管理客戶,其年度訂閱費用平均成長了約 22%。同時,一流的視覺化平台正在與規劃管理引擎整合,以在全套件供應商填補市場空白之前鞏固自身地位,這表明該領域存在著巨大的創新機會。
到2025年,本地部署系統仍將佔總收入的64.10%,這反映了國防、醫療保健和關鍵基礎設施營運商已確立的資料主權政策。由於高可用性叢集和客製化安全加密方案使得「直接遷移」成本高昂,許多大型企業仍需為持續維護預留預算。然而,隨著中型企業和數位化成熟企業將日常工作負載遷移到異地以擴展規模並降低資本支出(CAPEX),雲端訂閱正以8.15%的複合年成長率快速成長。曼哈頓聯合公司(Manhattan Associates)2024年第三季的雲端收入達到8,650萬美元,這表明傳統供應商可以在不犧牲許可利潤的情況下將其業務基礎轉型為SaaS。
目前,混合型 RFP(徵求提案)十分普遍。高度敏感的主資料保存在本地,而人工智慧密集的分析和協作工具運作在雲端。運輸管理和全球貿易模組正以最快的速度遷移到雲端,因為它們受益於承運商和仲介之間的網路效應。因此,美國供應鏈管理軟體市場正從單一架構部署向工作負載最佳化拓樸結構兩極化。提供跨雲端和邊緣環境整合編配層的供應商正在收取高價,客戶報告稱,遷移到此類聯合模型後,總體擁有成本 (TCO) 降低了 19%。未來,基於使用量的收費模式可望將預算編制方式轉向營運費用框架,以更好地應對貨運量的波動。
其他好處:
- Excel格式的市場預測(ME)表
- 3個月的分析師支持
目錄
第1章:引言
- 研究假設和市場定義
- 調查範圍
第2章:調查方法
第3章執行摘要
第4章 市場狀況
- 市場概覽
- 市場促進因素
- 電子商務的快速成長和雲端優先技術的應用
- 人工智慧驅動的規劃與分析平台
- 中小企業採用SaaS的趨勢正在快速成長。
- 鼓勵製造業回流的政策正在促進國內網路的編配。
- 禁止進口涉及強迫勞動的產品,使得可追溯性解決方案的重要性日益凸顯。
- 混合/本地部署人工智慧成本管理架構
- 市場限制因素
- 整合傳統ERP系統的複雜性
- 熟練的供應鏈管理-IT人員短缺
- 由於GenAI的計算成本增加,價格上漲。
- 受監管領域資料主權面臨的障礙
- 價值鏈分析
- 監理情勢
- 技術展望
- 波特五力分析
- 評估宏觀經濟趨勢對市場的影響
第5章 市場規模與成長預測
- 按解決方案類型
- 供應鏈計劃(SCP)
- 採購與尋源
- 倉庫管理系統(WMS)
- 運輸管理系統(TMS)
- 供應鏈分析與人工智慧
- 風險與合規管理
- 不同的發展
- 現場
- 雲
- 按組織規模
- 大公司
- 中小企業
- 最終用戶
- 製造業
- 醫療保健和生命科學
- 零售與電子商務
- 快速消費品和消費品
- 石油和天然氣/能源
- 其他行業
第6章 競爭情勢
- 市場集中度
- 策略趨勢
- 市佔率分析
- 公司簡介
- SAP SE
- Oracle Corporation
- Blue Yonder
- Infor Inc.
- Manhattan Associates
- Coupa Software
- E2open
- Descartes Systems Group
- WiseTech Global
- Jaggaer, Inc.
- IBM
- Kinaxis
- Epicor Software
- o9 Solutions
- Logility
- Ivalua
- GEP Worldwide
- SPS Commerce
- NetSuite(Oracle)
- Blue Ridge
第7章 市場機會與未來展望
According to Mordor Intelligence, the u.S. supply chain management software market size was valued at USD 7.15 billion in 2025 and estimated to grow from USD 7.63 billion in 2026 to reach USD 10.53 billion by 2031, at a CAGR of 6.65% during the forecast period (2026-2031).
This report is Segmented by Solution Type (Supply Chain Planning (SCP), Procurement and Sourcing, and More), Deployment (On-Premise and Cloud), Organization Size (Large Enterprises and Small and Medium Enterprises (SMEs)), End User (Manufacturing, Healthcare and Life Sciences, Retail and E-Commerce, and More). The Market Forecasts are Provided in Terms of Value (USD).
U.S. Supply Chain Management Software Market Trends and Insights
E-commerce boom and cloud-first adoption
Omnichannel sales spikes are forcing retailers and healthcare operators alike to demand elastic, cloud-native suites that can scale during peak cycles. Cloud solutions already represent 34% of the overall market and are rising swiftly as companies replace capital-heavy upgrades with consumption-based subscriptions. Hospital systems have mirrored the trend, with nearly half adopting cloud supply-chain tools to stabilize critical-item availability. The shift is strategic rather than purely technical, linking cost to actual throughput while reducing downtime tied to major version releases. As a result, the U.S. supply chain management software market is witnessing a surge in multitenant implementations that deliver rapid analytics, automatic patching, and disaster-recovery baked into service-level agreements. The dynamic continues to strengthen vendor lock-in barriers yet broadens the addressable base among firms formerly constrained by infrastructure limitations.
AI-driven planning and analytics platforms
Real-time AI copilots are shortening demand-planning cycles from days to minutes, with a quarter of logistics KPIs now forecast to be AI-generated by 2028. Kinaxis, for example, embedded its Maestro engine directly into core workflows, letting planners automate scenario modeling without toggling between modules. Such native integrations elevate supply-chain software from transactional record-keepers to predictive decision systems that flag disruptions before they materialize. Yet only one in six U.S. factories maintains live production visibility, underscoring ample whitespace for analytics rollouts. Consequently, spending on AI accelerators is climbing even as firms experiment with cost-efficient edge inference to curb rising compute bills. These factors collectively lift the U.S. supply chain management software market toward higher-value, insight-centric use cases.
Legacy ERP integration complexity
Fewer than 60% of manufacturers are on track to shift aging SAP landscapes to modern S/4HANA stacks before mainstream support deadlines, leaving hundreds of custom interfaces in place. Integration projects demand data cleansing, process redesign, and new cybersecurity layers; attacks on legacy SAP systems surged fourfold between 2021 and 2023 as criminals exploited unpatched modules. Extended timelines inflate project budgets just as CFOs push digital investments to show near-term returns. To contain risk, many firms are piloting API-first microservices that wrap legacy cores while letting new cloud analytics run in parallel. Although this tactic speeds up visible wins, the underlying debt continues to slow broader migration, capping potential growth in the U.S. supply chain management software market.
Other drivers and restraints analyzed in the detailed report include:
- SME SaaS penetration surge
- Reshoring incentives boost domestic network orchestration
- Skilled SCM-IT talent shortage
For complete list of drivers and restraints, kindly check the Table Of Contents.
Segment Analysis
Supply Chain Planning remained the revenue cornerstone, accounting for 31.12% of the U.S. supply chain management software market in 2025. Demand-sensing modules and inventory-optimization engines continue to draw upgrades as firms seek resilience against volatile order patterns. In parallel, the Supply Chain Analytics and AI segment is expanding at a 7.05% CAGR, underscoring a pivot toward prescriptive insights that complement existing planning backbones. Warehouse Management Systems and Transportation Management Systems attract steady spend because they offer immediate throughput improvements; North American WMS suppliers capture more than half of worldwide revenue, reflecting deep domain expertise. Procurement and Sourcing tools are regaining attention as traceability and ESG requirements intensify. Risk-and-Compliance point solutions, though smaller in ticket size, are outpacing historical averages by monetizing forced-labor screening functions mandated by U.S. Customs. Coupa's billion-dollar annual billings validate the appetite for integrated platforms uniting spend, sourcing, and supplier risk management.
Increasingly, customers favor suites that embed AI copilots rather than bolt-on analytics, a trend evident from Kinaxis's Maestro launch. This shift streamlines user experience and limits data-integration friction, positioning analytics as a natural extension of planning. As a result, the U.S. supply chain management software market size for analytics-infused suites is projected to swell at a rate that outpaces core transactional modules through 2031. For vendors, cross-selling synergies are improving lifetime contract values: planning clients adopting embedded analytics raise annual subscriptions by roughly 22% on average. Meanwhile, best-of-breed visibility platforms are integrating with planning engines to secure footholds before full-suite vendors close the gap, suggesting a window for specialized innovation.
On-premise systems still commanded 64.10% revenue in 2025, reflecting entrenched data-sovereignty policies among defense, healthcare, and critical-infrastructure operators. High-availability clusters and custom security ciphers make lift-and-shift migration costly, so many large organizations continue to budget for evergreen maintenance. Yet cloud subscriptions are racing ahead at an 8.15% CAGR as mid-market adopters and digitally mature enterprises move routine workloads offsite for scale and lower capex. Manhattan Associates' cloud revenue climbed to USD 86.5 million in Q3 2024, illustrating how legacy vendors can pivot their base to SaaS without sacrificing license margins.
Hybrid patterns now dominate RFPs: sensitive master data resides on premises while AI-heavy analytics and collaboration tools run in the cloud. Transportation Management and Global Trade modules exhibit the fastest cloud uptake because they benefit from network effects across carriers and brokers. The U.S. supply chain management software market is therefore bifurcating into workload-optimized topologies rather than single-stack deployments. Vendors offering unified orchestration layers that span cloud and edge environments are capturing premium pricing, and customers report 19% lower total cost of ownership when they switch to such federated models. Over time, usage-based billing is expected to nudge budgeting practices toward operating-expense frameworks that better align with fluctuating freight volumes.
Complete Report Scope:
- By Solution Type
- Supply Chain Planning (SCP)
- Procurement and Sourcing
- Warehouse Management Systems (WMS)
- Transportation Management Systems (TMS)
- Supply Chain Analytics and AI
- Risk and Compliance Management
- By Deployment
- On-Premise
- Cloud
- By Organization Size
- Large Enterprises
- Small and Medium Enterprises (SMEs)
- By End User
- Manufacturing
- Healthcare and Life Sciences
- Retail and E-commerce
- FMCG and CPG
- Oil and Gas / Energy
- Other Industries
List of Companies Covered in this Report:
- SAP SE
- Oracle Corporation
- Blue Yonder
- Infor Inc.
- Manhattan Associates
- Coupa Software
- E2open
- Descartes Systems Group
- WiseTech Global
- Jaggaer, Inc.
- IBM
- Kinaxis
- Epicor Software
- o9 Solutions
- Logility
- Ivalua
- GEP Worldwide
- SPS Commerce
- NetSuite (Oracle)
- Blue Ridge
Additional Benefits:
- The market estimate (ME) sheet in Excel format
- 3 months of analyst support
TABLE OF CONTENTS
1 INTRODUCTION
- 1.1 Study Assumptions and Market Definition
- 1.2 Scope of the Study
2 RESEARCH METHODOLOGY
3 EXECUTIVE SUMMARY
4 MARKET LANDSCAPE
- 4.1 Market Overview
- 4.2 Market Drivers
- 4.2.1 E-commerce boom and cloud-first adoption
- 4.2.2 AI-driven planning and analytics platforms
- 4.2.3 SME SaaS penetration surge
- 4.2.4 Reshoring incentives boost domestic network orchestration
- 4.2.5 Forced-labor import bans elevate traceability solutions
- 4.2.6 Hybrid/on-prem AI cost-control architectures
- 4.3 Market Restraints
- 4.3.1 Legacy ERP integration complexity
- 4.3.2 Skilled SCM-IT talent shortage
- 4.3.3 GenAI compute cost-driven price inflation
- 4.3.4 Data-sovereignty hurdles in regulated verticals
- 4.4 Value Chain Analysis
- 4.5 Regulatory Landscape
- 4.6 Technological Outlook
- 4.7 Porter's Five Forces Analysis
- 4.7.1 Bargaining Power of Suppliers
- 4.7.2 Bargaining Power of Buyers
- 4.7.3 Threat of New Entrants
- 4.7.4 Threat of Substitutes
- 4.7.5 Intensity of Competitive Rivalry
- 4.8 Assessment of the Impact of Macroeconomic Trends on the Market
5 MARKET SIZE AND GROWTH FORECASTS (VALUE)
- 5.1 By Solution Type
- 5.1.1 Supply Chain Planning (SCP)
- 5.1.2 Procurement and Sourcing
- 5.1.3 Warehouse Management Systems (WMS)
- 5.1.4 Transportation Management Systems (TMS)
- 5.1.5 Supply Chain Analytics and AI
- 5.1.6 Risk and Compliance Management
- 5.2 By Deployment
- 5.2.1 On-Premise
- 5.2.2 Cloud
- 5.3 By Organization Size
- 5.3.1 Large Enterprises
- 5.3.2 Small and Medium Enterprises (SMEs)
- 5.4 By End User
- 5.4.1 Manufacturing
- 5.4.2 Healthcare and Life Sciences
- 5.4.3 Retail and E-commerce
- 5.4.4 FMCG and CPG
- 5.4.5 Oil and Gas / Energy
- 5.4.6 Other Industries
6 COMPETITIVE LANDSCAPE
- 6.1 Market Concentration
- 6.2 Strategic Moves
- 6.3 Market Share Analysis
- 6.4 Company Profiles (includes Global level Overview, Market level overview, Core Segments, Financials as available, Strategic Information, Market Rank/Share for key companies, Products and Services, and Recent Developments)
- 6.4.1 SAP SE
- 6.4.2 Oracle Corporation
- 6.4.3 Blue Yonder
- 6.4.4 Infor Inc.
- 6.4.5 Manhattan Associates
- 6.4.6 Coupa Software
- 6.4.7 E2open
- 6.4.8 Descartes Systems Group
- 6.4.9 WiseTech Global
- 6.4.10 Jaggaer, Inc.
- 6.4.11 IBM
- 6.4.12 Kinaxis
- 6.4.13 Epicor Software
- 6.4.14 o9 Solutions
- 6.4.15 Logility
- 6.4.16 Ivalua
- 6.4.17 GEP Worldwide
- 6.4.18 SPS Commerce
- 6.4.19 NetSuite (Oracle)
- 6.4.20 Blue Ridge
7 MARKET OPPORTUNITIES AND FUTURE OUTLOOK
- 7.1 White-space and Unmet-Need Assessment

 供應鏈管理軟體調查服務供應鏈管理軟體半年發展趨勢:2026年上半年
 供應鏈管理軟體市場規模、佔有率和成長分析:按組件、部署類型、企業規模和地區分類-2026年至2033年產業預測
 2026年全球供應鏈管理軟體市場報告
 2026-2030年全球供應鏈管理(SCM)軟體市場
 供應鏈管理軟體市場規模、佔有率、趨勢和預測(按解決方案類型、部署模式、組織規模、垂直行業和地區分類),2026-2034 年
 供應鏈管理軟體市場 - 全球產業規模、佔有率、趨勢、機會及預測(按解決方案類型、部署模式、產業垂直領域、地區和競爭格局分類,2021-2031年)日本供應鏈管理軟體市場報告(按解決方案類型、部署模式、組織規模、產業垂直領域和地區分類,2026-2034 年)
 全球供應鏈管理軟體市場