


 |
市場調查報告書
商品編碼
2124706
小規模水力發電:市場佔有率分析、行業趨勢和統計數據以及成長預測(2026-2031 年)Small Hydropower - Market Share Analysis, Industry Trends & Statistics, Growth Forecasts (2026 - 2031) |
||||||

※ 本網頁內容可能與最新版本有所差異。詳細情況請與我們聯繫。
據 Mordor Intelligence 稱,2025 年小規模水力發電市場價值為 87.45 吉瓦,預計到 2031 年將達到 144.93 吉瓦,而 2026 年為 95.14 吉瓦,預測期(2026-2031 年)的複合年成長率為 8.79%。
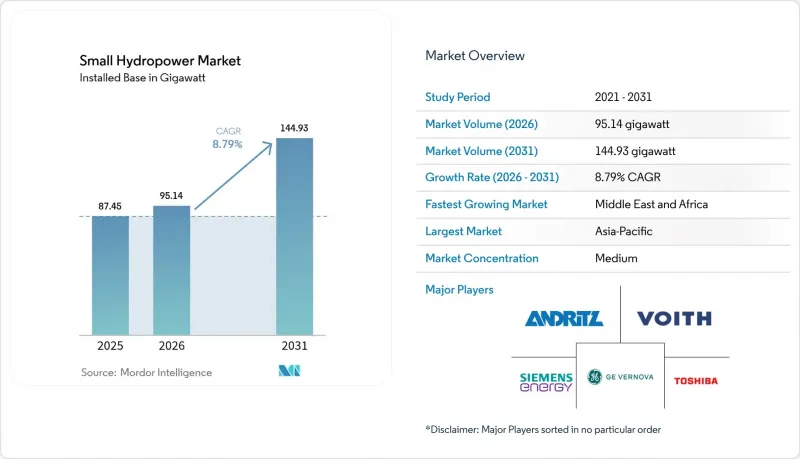
本報告按裝置容量(1兆瓦以下和1-10兆瓦)、技術類型(水庫式、徑流式、抽水蓄能式、河道式和微管道式)、最終用戶(公用事業公司、獨立發電企業、工業和自用)以及地區(北美、歐洲、亞太、南美、中東和非洲)進行細分。市場規模和預測以裝置容量(吉瓦)為單位。
全球小規模水力發電市場趨勢及洞察
對清潔和永續電力的需求激增
企業永續發展政策日益重視全天候可再生能源採購,而小規模水力發電的基本負載特性比風能或太陽能與昂貴的電池儲能結合更符合這一目標。國際可再生能源機構(IRENA)預測,到2030年,企業主導的清潔電力合約規模將超過每年100吉瓦,基本負載電源預計將獲得更高的合約價格。包括資料中心營運商在內的大規模電力採購商正擴大將小規模水力發電與間歇性可再生能源相結合,以滿足其內部碳計量框架的要求。這一趨勢正在推動歐洲和北美新計畫的投資,在這些地區,經認證的市場可以實行差異化定價。因此,長期電力採購的確定性提高,資金籌措風險降低,專案開工速度加快。
針對偏遠地區的農村電氣化項目
政府支持的農村能源計畫將大量資金投入以分散式水力發電為動力的微電網建設中,因為陡峭的地形使得建造長距離輸電線路在經濟上難以實現。在印度的迪安·達亞爾·烏帕迪亞亞·加姆·喬蒂·約賈納計畫中,政府已撥款25億美元用於2024年前的電氣化,其中小規模水力發電佔新增發電容量的15%。社區所有權模式透過保持電價合理並將利潤再投資於社區,提高了社會接受度。世界銀行目前正致力於在撒哈拉以南非洲地區推廣類似模式,結合優惠貸款和技術援助。隨著農產品加工和冷藏保管等周邊當地產業的發展,需求曲線與穩定的河流發電相匹配,進一步提高了營運商利潤的穩定性。
氣候變遷導致水流量波動和發電不穩定
日益嚴重的乾旱導致河流流量減少,發電能力利用率下降,削弱了最初支撐許多計畫的「可靠電力」論點。政府間氣候變遷專門委員會(IPCC)預測,到2030年,河川流量波動將增加20%至30%。 2024年,南歐的平均發電量利用率下降了8%,迫使發電公司在現貨市場購買備用電力。與太陽能發電混合使用可以部分規避風險,但會使資本預算增加10%至15%。如果沒有專門用於增強氣候適應能力的資金,小規模開發商可能難以支付不斷上漲的保險費以及貸款機構要求的償還債務的利潤。
細分市場分析
1-10兆瓦級(1-10兆瓦檔)仍然是小規模水力發電市場的基礎,預計到2025年將佔總收入的66.85%,這得益於其成熟的公用事業商業經營模式和每千瓦時0.05-0.08美元的可貸款平準化電力成本(LCOE)。資產開發商青睞此類項目,因為供應商提供標準化的方案,且貸款機構認為其執行風險較低。透過棕地維修進行電力更新進一步鞏固了該細分市場的收入基礎,因為許多河流已被評估為適合此類項目。
同時,裝置容量低於1兆瓦的微型水力發電廠正以10.26%的強勁複合年成長率持續成長,預計到2031年將維持這一成長動能。這得歸功於簡化的核准流程和創新的資金籌措方式,例如當地合作社。對魚類死亡率低於2%的渦輪機進行認證,有助於緩解生物多樣性問題,而這些問題曾經阻礙了小規模溪流地區的開發。在印度偏遠的村莊和秘魯的山區,股權所有權確保了現金流留在社區內部,從而提高了電費徵收效率,並增強了社會接受度。這些特點確保了微型水力發電廠將繼續成為小規模水力發電市場的主要成長引擎。
區域分析
預計到2025年,亞太地區將佔全球銷售額的63.55%,成為市場成長的主要驅動力。這主要得益於中國計畫在2030年新增15吉瓦裝置容量,投資金額達85億美元,以及印度對5兆瓦以下項目的快速授權流程。在日本,電力業正日趨成熟,並不斷發展變化。東京電力公司(TEPCO)正在15個地點進行維修升級。數位化在日本提高了發電量,同時並未造成新的環境負擔。印尼和菲律賓則依靠小規模水力發電廠為其島嶼微電網供電,將豐富的資源與包容性成長連結起來。
中東和非洲地區是成長最快的地區,預計到2031年將維持14.31%的複合年成長率。這主要得益於摩洛哥運作的八座總裝置容量為45兆瓦的發電廠,以及肯亞的農村電氣化夥伴關係,該項目在2024年為5萬人提供了電力。在烏干達,5兆瓦以下項目的核准流程已簡化,監管要求減少了40%。在剛果民主共和國,一個由中國資助的計畫正在進行中,該計畫旨在為礦物加工提供電力,同時擴大偏遠村莊的電力供應。這些舉措體現了「水、能源和糧食」模式的有效性,該模式將灌溉、電力和地方層面的價值創造相結合。
在歐洲和北美,重點在於升級發電設施並遵守環境法規。歐盟12億歐元的「REPowerEU」基金旨在提高發電效率並維修魚道,而挪威國家電力公司(Statcraft)則透過機器學習最佳化,將12座發電廠的發電能力提高了20%。在美國,聯邦能源監管委員會(FERC)於2024年認證了三種對魚類友善的渦輪機,使得先前因鮭魚保護法規而被禁止的計畫得以實施。在南美洲,巴西和智利走在前列,利用其豐富的水資源將電網延伸至偏遠的農業地區,證明了現代化改造和新建設可以並存。
其他好處:
- Excel格式的市場預測(ME)表
- 3個月的分析師支持
目錄
第1章:引言
- 研究假設和市場定義
- 調查範圍
第2章:調查方法
第3章執行摘要
第4章 市場狀況
- 市場概覽
- 市場促進因素
- 對清潔和永續電力的需求激增
- 針對偏遠地區農村電氣化計畫的
- 老舊小規模水力發電設施的現代化改造和產量提升。
- 對魚類無害的創新微型渦輪機技術正在開闢新的安裝地點。
- 與水、能源和糧食密切相關的項目正在吸引混合融資。
- 為尋求基本負載可再生能源的公司提供的可再生能源購電協議(PPA)。
- 市場限制因素
- 氣候相關的流量波動和不穩定的發電
- 環境許可的取得過程漫長且充滿不確定性。
- 由於太陽能發電和儲能技術的結合,平準化能源成本 (LCOE) 下降,給水力發電的內部收益率 (IRR) 帶來了壓力。
- 沉積物堆積導致維護成本增加
- 供應鏈分析
- 監理情勢
- 技術展望
- 區域佔已安裝容量的佔有率
- 專案規劃及未來發展
- 波特五力模型
第5章 市場規模與成長預測
- 按產能
- 1兆瓦或以下
- 1~10 MW
- 透過技術
- 儲存底部
- 河川利用類型
- 抽水蓄能水力發電
- 串流內和微型導管
- 依成分(僅限定性分析)
- 渦輪
- 發電機
- 控制與自動化
- 工廠周邊設備
- 最終用戶
- 公共產業(州和公共)
- 獨立發電機
- 工業和專有用途
- 按地區
- 北美洲
- 美國
- 加拿大
- 墨西哥
- 歐洲
- 法國
- 義大利
- 西班牙
- 挪威
- 土耳其
- 俄羅斯
- 其他歐洲國家
- 亞太地區
- 中國
- 印度
- 日本
- 韓國
- 印尼
- 菲律賓
- 塔吉克
- 澳洲和紐西蘭
- 其他亞太國家
- 南美洲
- 巴西
- 智利
- 哥倫比亞
- 宏都拉斯
- 其他南美國家
- 中東和非洲
- 南非
- 烏干達
- 摩洛哥
- 肯亞
- 剛果民主共和國
- 其他中東和非洲國家
- 北美洲
第6章 競爭情勢
- 市場集中度
- 策略趨勢(併購、聯盟、購電協議)
- 市場佔有率分析(主要公司的市場排名和佔有率)
- 公司簡介
- Voith GmbH & Co. KGaA
- Andritz AG
- GE Vernova, Inc.
- Siemens Energy AG
- Toshiba Energy Systems & Solutions Corp.
- PJSC RusHydro
- Statkraft AS
- Gilbert Gilkes & Gordon Ltd.
- FLOVEL Energy Pvt Ltd.
- Natel Energy Inc.
- Mavel as
- Bharat Heavy Electricals Ltd.(BHEL)
- SNC-Lavalin Group Inc.(AtkinsRealis)
- CKD Blansko Holding
- Canyon Hydro
- American Hydro Corp.
- Litostroj Power
- Turbulent NV
- Blueline Manufacturing
- Voith Hydro Italy
第7章 市場機會與未來展望
According to Mordor Intelligence, the small hydropower market size was valued at 87.45 gigawatt in 2025 and estimated to grow from 95.14 gigawatt in 2026 to reach 144.93 gigawatt by 2031, at a CAGR of 8.79% during the forecast period (2026-2031).
This report is Segmented by Capacity (Up To 1 MW and 1 To 10 MW), Technology (Reservoir-Based, Run-Of-River, Pumped-Storage, and In-Stream and Micro-Conduit), End-User (Utilities, Independent Power Producers, and Industrial and Captive), and Geography (North America, Europe, Asia-Pacific, South America, and Middle East and Africa). The Market Size and Forecasts are Provided in Terms of Installed Capacity (GW)
Global Small Hydropower Market Trends and Insights
Surge in Demand for Clean & Sustainable Power
Corporate sustainability mandates now prize around-the-clock renewable procurement, and small hydropower's baseload profile matches that goal better than wind or solar paired with costly batteries. The International Renewable Energy Agency anticipates corporate-led clean-power contracting to exceed 100 GW annually by 2030, with baseload sources commanding premium contract prices. Utility-scale buyers, including data-center operators, increasingly bundle small hydropower with intermittent renewables to meet internal carbon accounting frameworks. These trends channel investment toward new projects in Europe and North America, where certificate markets allow differentiated pricing. The result reinforces long-term offtake certainty that de-risks financing and accelerates construction starts.
Rural Electrification Programmes for Off-Grid Communities
Government-backed rural-energy programs allocate sizable funding to distributed hydropower mini-grids because steep terrain makes long transmission lines cost-prohibitive. India's Deen Dayal Upadhyaya Gram Jyoti Yojana earmarked USD 2.5 billion for electrification in 2024, with 15% of new megawatts sourced from small hydropower. Community ownership models ensure tariffs remain affordable and profits stay local, strengthening social acceptance. World Bank initiatives now blend concessional finance with technical assistance to replicate similar approaches across sub-Saharan Africa. As local industry grows around agro-processing and cold storage, demand curves align with steady river-based generation, reinforcing revenue stability for operators.
Climate-Driven Flow Variability & Unstable Output
Intensifying droughts reduce river discharge and erode capacity factors, undercutting the dependable-power narrative that originally justified many projects. The IPCC expects flow variability to rise 20-30% by 2030. In 2024, average capacity factors in southern Europe fell 8%, forcing generators to buy balancing power on spot markets. Hybridization with solar offers a partial hedge but inflates capital budgets by 10-15%. Without dedicated climate-resilience finance, smaller developers could struggle to absorb higher insurance premiums and debt-service cushions required by lenders.
Other drivers and restraints analyzed in the detailed report include:
- Modernisation & Repowering of Ageing Small-Hydro Assets
- Fish-Friendly Micro-Turbine Innovations Unlocking New Sites
- Lengthy, Uncertain Environmental-Permitting Cycles
For complete list of drivers and restraints, kindly check the Table Of Contents.
Segment Analysis
The 1-10 MW tier continues to anchor the small hydropower market, holding 66.85% revenue in 2025 thanks to proven utility business models and bankable levelized costs of USD 0.05-0.08 per kWh. Asset developers favor this bracket because equipment vendors offer standardized packages and lenders perceive lower execution risk. With many rivers already assessed for such projects, brownfield upgrades further solidify the segment's revenue base through repowering.
Micro units under 1 MW, however, expand at a brisk 10.26% CAGR through 2031, reflecting streamlined permitting pathways and innovative funding such as community cooperatives. Certification of sub-2% fish-mortality turbines mitigates biodiversity objections that once sidelined small creeks. For remote villages in India or mountainous areas in Peru, ownership stakes keep cash flows local, improving tariff recovery and social license. These attributes ensure the micro tier remains the principal growth engine within the small hydropower market.
Complete Report Scope:
- By Capacity
- Up to 1 MW
- 1 to 10 MW
- By Technology
- Reservoir-Based
- Run-of-River
- Pumped-Storage
- In-Stream and Micro-conduit
- By Component (Qualitative Analysis only)
- Turbines
- Generators
- Control and Automation
- Balance-of-Plant
- By End-User
- Utilities (State & Public)
- Independent Power Producers
- Industrial and Captive
- By Geography
- North America
- United States
- Canada
- Mexico
- Europe
- France
- Italy
- Spain
- Norway
- Turkey
- Russia
- Rest of Europe
- Asia-Pacific
- China
- India
- Japan
- South Korea
- Indonesia
- Philippines
- Tajikistan
- Australia and New Zealand
- Rest of Asia-Pacific
- South America
- Brazil
- Chile
- Colombia
- Honduras
- Rest of South America
- Middle East and Africa
- South Africa
- Uganda
- Morocco
- Kenya
- Democratic Republic of the Congo
- Rest of Middle East and Africa
- North America
Geography Analysis
Asia-Pacific dominated with 63.55% revenue in 2025, led by China's USD 8.5 billion commitment to add 15 GW by 2030 and India's expedited permitting for sub-5 MW projects. Upgrades in Japan, 15 sites retrofitted by Tokyo Electric Power, demonstrate a mature yet evolving landscape, where digitalization raises output without fresh ecological footprints. Indonesia and the Philippines rely on small hydropower anchor plants to energize island mini-grids, translating resource endowment into inclusive growth.
The Middle East & Africa is the fastest-growing region at 14.31% CAGR toward 2031, buoyed by Morocco's eight-plant rollout totaling 45 MW and Kenya's rural-electrification partnerships that served 50,000 residents in 2024. Uganda streamlines approvals for under-5 MW projects, slashing regulatory timelines 40%. In the Democratic Republic of Congo, Chinese finance underwrites schemes that power mineral processing while expanding access for off-grid villages. These initiatives validate the water-energy-food nexus model that integrates irrigation, electricity, and local value addition.
Europe and North America concentrate on repowering and environmental compliance. The EU's EUR 1.2 billion REPowerEU fund targets efficiency gains and fish-passage retrofits, while Norway's Statkraft achieves 20% capacity boosts on 12 plants through machine-learning optimization. In the United States, FERC certified three fish-friendly turbines in 2024, enabling projects once barred by salmon-protection rules. South America centers on Brazil and Chile, leveraging robust hydrology to extend grids into remote agrarian zones, proving that modernization and greenfield builds can coexist.
List of Companies Covered in this Report:
- Voith GmbH & Co. KGaA
- Andritz AG
- GE Vernova, Inc.
- Siemens Energy AG
- Toshiba Energy Systems & Solutions Corp.
- PJSC RusHydro
- Statkraft AS
- Gilbert Gilkes & Gordon Ltd.
- FLOVEL Energy Pvt Ltd.
- Natel Energy Inc.
- Mavel a.s.
- Bharat Heavy Electricals Ltd. (BHEL)
- SNC-Lavalin Group Inc. (AtkinsRealis)
- CKD Blansko Holding
- Canyon Hydro
- American Hydro Corp.
- Litostroj Power
- Turbulent NV
- Blueline Manufacturing
- Voith Hydro Italy
Additional Benefits:
- The market estimate (ME) sheet in Excel format
- 3 months of analyst support
TABLE OF CONTENTS
1 Introduction
- 1.1 Study Assumptions & Market Definition
- 1.2 Scope of the Study
2 Research Methodology
3 Executive Summary
4 Market Landscape
- 4.1 Market Overview
- 4.2 Market Drivers
- 4.2.1 Surge in demand for clean & sustainable power
- 4.2.2 Rural electrification programmes for off-grid communities
- 4.2.3 Modernisation & repowering of ageing small-hydro assets
- 4.2.4 Fish-friendly micro-turbine innovations unlocking new sites
- 4.2.5 Water-energy-food nexus projects attracting blended finance
- 4.2.6 Corporate renewable PPAs seeking baseload renewables
- 4.3 Market Restraints
- 4.3.1 Climate-driven flow variability & unstable output
- 4.3.2 Lengthy, uncertain environmental-permitting cycles
- 4.3.3 Falling solar-plus-storage LCOE compressing hydro IRRs
- 4.3.4 Siltation & sedimentation raising O&M costs
- 4.4 Supply-Chain Analysis
- 4.5 Regulatory Landscape
- 4.6 Technological Outlook
- 4.7 Regional Installed Capacity Share
- 4.8 Projects Pipeline & Upcoming Developments
- 4.9 Porter's Five Forces
- 4.9.1 Bargaining Power of Suppliers
- 4.9.2 Bargaining Power of Buyers
- 4.9.3 Threat of New Entrants
- 4.9.4 Threat of Substitutes
- 4.9.5 Competitive Rivalry
5 Market Size & Growth Forecasts
- 5.1 By Capacity
- 5.1.1 Up to 1 MW
- 5.1.2 1 to 10 MW
- 5.2 By Technology
- 5.2.1 Reservoir-Based
- 5.2.2 Run-of-River
- 5.2.3 Pumped-Storage
- 5.2.4 In-Stream and Micro-conduit
- 5.3 By Component (Qualitative Analysis only)
- 5.3.1 Turbines
- 5.3.2 Generators
- 5.3.3 Control and Automation
- 5.3.4 Balance-of-Plant
- 5.4 By End-User
- 5.4.1 Utilities (State & Public)
- 5.4.2 Independent Power Producers
- 5.4.3 Industrial and Captive
- 5.5 By Geography
- 5.5.1 North America
- 5.5.1.1 United States
- 5.5.1.2 Canada
- 5.5.1.3 Mexico
- 5.5.2 Europe
- 5.5.2.1 France
- 5.5.2.2 Italy
- 5.5.2.3 Spain
- 5.5.2.4 Norway
- 5.5.2.5 Turkey
- 5.5.2.6 Russia
- 5.5.2.7 Rest of Europe
- 5.5.3 Asia-Pacific
- 5.5.3.1 China
- 5.5.3.2 India
- 5.5.3.3 Japan
- 5.5.3.4 South Korea
- 5.5.3.5 Indonesia
- 5.5.3.6 Philippines
- 5.5.3.7 Tajikistan
- 5.5.3.8 Australia and New Zealand
- 5.5.3.9 Rest of Asia-Pacific
- 5.5.4 South America
- 5.5.4.1 Brazil
- 5.5.4.2 Chile
- 5.5.4.3 Colombia
- 5.5.4.4 Honduras
- 5.5.4.5 Rest of South America
- 5.5.5 Middle East and Africa
- 5.5.5.1 South Africa
- 5.5.5.2 Uganda
- 5.5.5.3 Morocco
- 5.5.5.4 Kenya
- 5.5.5.5 Democratic Republic of the Congo
- 5.5.5.6 Rest of Middle East and Africa
- 5.5.1 North America
6 Competitive Landscape
- 6.1 Market Concentration
- 6.2 Strategic Moves (M&A, Partnerships, PPAs)
- 6.3 Market Share Analysis (Market Rank/Share for key companies)
- 6.4 Company Profiles (includes Global level Overview, Market level overview, Core Segments, Financials as available, Strategic Information, Products & Services, and Recent Developments)
- 6.4.1 Voith GmbH & Co. KGaA
- 6.4.2 Andritz AG
- 6.4.3 GE Vernova, Inc.
- 6.4.4 Siemens Energy AG
- 6.4.5 Toshiba Energy Systems & Solutions Corp.
- 6.4.6 PJSC RusHydro
- 6.4.7 Statkraft AS
- 6.4.8 Gilbert Gilkes & Gordon Ltd.
- 6.4.9 FLOVEL Energy Pvt Ltd.
- 6.4.10 Natel Energy Inc.
- 6.4.11 Mavel a.s.
- 6.4.12 Bharat Heavy Electricals Ltd. (BHEL)
- 6.4.13 SNC-Lavalin Group Inc. (AtkinsRealis)
- 6.4.14 CKD Blansko Holding
- 6.4.15 Canyon Hydro
- 6.4.16 American Hydro Corp.
- 6.4.17 Litostroj Power
- 6.4.18 Turbulent NV
- 6.4.19 Blueline Manufacturing
- 6.4.20 Voith Hydro Italy
7 Market Opportunities & Future Outlook
- 7.1 White-space & Unmet-need Assessment
- 7.2 Integrating IoT with Small Hydropower Assets
- 7.3 Hybrid Micro-Hydro + Solar Mini-Grid Models
- 7.4 Innovative Community-ownership Financing

 小型水力系統市場:按組件、容量和地區分類。
 小規模水力發電市場-2026-2032年全球市場預測
 小規模水力發電市場預測至2034年:按組件、容量、技術、最終用戶和地區分類的全球分析小規模水力發電市場:按組件、容量、類型和地區分類
 2026-2034年全球小規模水力發電市場規模、佔有率、趨勢和成長分析報告
 日本小規模水力發電市場規模、佔有率、趨勢和預測:按容量、組成部分和地區分類,2026-2034年
 2026年全球小型水力市場報告
 小型水力發電市場-全球產業規模、佔有率、趨勢、機會和預測,按類型、應用、容量(微型水力發電、小型水力發電)、組件、地區和競爭格局分類,2021-2031年預測
 小型水力市場規模、佔有率及成長分析(按容量、類型、組件和地區分類)-2026-2033年產業預測全球小型水力市場-2025-2030年預測