


 |
市場調查報告書
商品編碼
2124611
美國和歐洲可重複使用塑膠可回收運輸包裝:市場佔有率分析、行業趨勢和統計數據以及成長預測(2026-2031 年)United States And Europe Reusable Plastic Returnable Transport Packaging - Market Share Analysis, Industry Trends & Statistics, Growth Forecasts (2026 - 2031) |
||||||

※ 本網頁內容可能與最新版本有所差異。詳細情況請與我們聯繫。
據 Mordor Intelligence 稱,美國和歐洲可重複使用塑膠可回收運輸包裝的市場規模預計在 2026 年達到 240 億美元,從 2025 年的 232.5 億美元成長到 2031 年的 281.4 億美元。
預計從 2026 年到 2031 年,其複合年成長率將達到 3.21%。
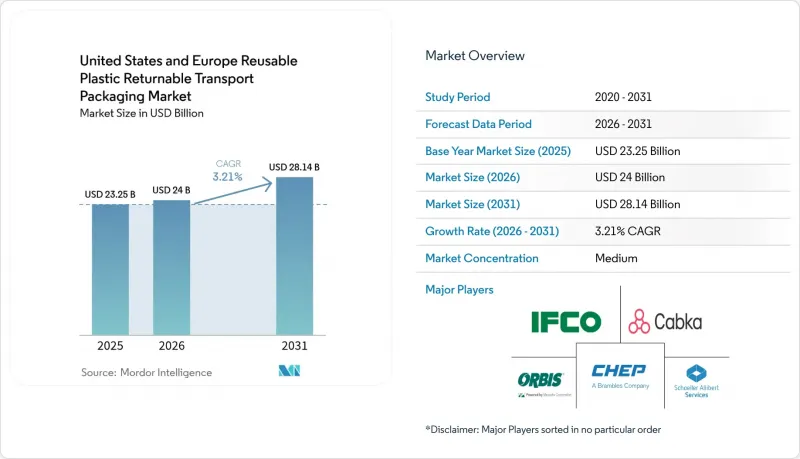
本報告按材料(HDPE、PP 等)、產品類型(RPC、托盤、板條箱、IBC 等)、最終用戶行業(食品飲料、汽車、電子、化學等)、分銷模式(共享型、專屬式型)和地區進行細分,市場預測以價值(美元)表示。
美國和歐洲可重複使用塑膠可回收運輸包裝市場的趨勢和見解。
政府推出有利於循環包裝的法規
西班牙2022年頒布的第1055/2022號皇家法令對一次性塑膠製品徵收每公斤0.45歐元(0.50美元)的稅,並強制要求到2030年實現65%的再利用率,從而刺激了容器的快速轉型。加州參議院第54號法案要求到2032年將一次性產品的使用量減少25%,這將對該州3.6兆美元的經濟規模產生影響。歐盟的《包裝和包裝廢棄物條例》設定了2030年運輸包裝再利用率達到10%的目標,鼓勵跨國貨運公司進行投資。美國環保署(EPA)的《聯邦採購條例》現在優先考慮可重複使用的包裝方案,推動了公共部門承包商的需求成長。總而言之,這些政策正在持續推動可重複使用塑膠運輸包裝市場的發展。
倉庫和物流中心的自動化將加速RTP的普及。
隨著自動化倉庫系統傾向於使用帶有RFID標籤的標準化容器,企業面臨著向可重複使用容器轉型的壓力。通用汽車(GM)透過在2024年於15家工廠實現容器標準化,成功將物料搬運成本降低了23%。 IEEE關於在容器中安裝物聯網感測器的指南已將資產視覺性提高了98.5%,從而實現了無人倉庫營運。擁有超過10,000個SKU的多通路履約中心報告稱,使用可重複使用容器後,效率提高了15-20%。亞馬遜的履約研究突顯了自動化帶來的協同效應,透過使用標準化週轉箱,機器人處理能力提高了40%。
相關人員對流程變更的抵制
轉向可重複使用系統需要跨部門協調,工廠在6-18個月的實施期內通常會經歷8-12%的暫時性生產力下降。許多倉庫管理解決方案由於無法將可重複使用容器的追蹤作為標準功能,被迫進行成本高昂的升級。中小企業難以滿足容器池業者設定的最低使用量要求。培訓成本也阻礙了可重複使用系統的推廣,因為員工必須學習與一次性工作流程截然不同的檢查和退貨流程。一家中型汽車零件供應商花費了15萬至30萬美元用於倉庫維修和培訓,以實施可重複使用容器,這充分說明了轉型過程中存在的巨大障礙。
細分市場分析
高密度聚乙烯 (HDPE) 佔據可重複使用塑膠可回收運輸包裝市場 53.88% 的佔有率。其在 -40 度C至 +60 度C的溫度範圍內均表現出優異的耐久性,使其成為汽車和食品物流行業的標準選擇。然而,2024 年高達 18% 的價格波動使得人們必須重新審視其生命週期成本差異。聚丙烯 (PP) 的複合年成長率 (CAGR) 最高,達到 4.23%,主要得益於其輕質特性和嚴格的耐化學腐蝕要求。福特汽車公司透過將引擎零件運輸箱改用 PP,預計到 2024 年將貨櫃重量減輕 23%。強制性再生材料含量要求對 HDPE 有利,因為成熟的供應管道可以在不影響其性能的前提下滿足 25-30% 的再生材料含量,從而保護用戶免受原生樹脂價格波動的影響。
其次,製藥生產線對透明度的要求日益提高,這為聚碳酸酯的市場地位提供了支撐。使用銀離子增強抗菌性能將使樹脂成本增加15-20%,但隨著食品接觸相關法規的日益嚴格,使用者也逐漸接受了更高的價格。整體而言,材料的選擇不再僅取決於樹脂的標價,還取決於每次使用的總成本、可回收性和法規遵循。高密度聚乙烯(HDPE)保持主導,而聚丙烯(PP)則在高性能細分市場中不斷擴大市場佔有率。
預計到2025年,托盤將佔該行業銷售額的37.74%,繼續成為消費品分銷的基石。標準化的尺寸、與自動導引車(AGV)的兼容性以及全球共享網路的普及,正在鞏固其主導地位。與托盤相關的可重複使用塑膠包裝材料的市場規模預計將與工業生產的成長保持同步,而非超過工業生產的成長,這反映出該市場已接近飽和。
由於化學品和食品配料的托運人因腐蝕和重量問題而逐步淘汰鋼製容器,中型散貨箱(IBC)的複合年成長率(CAGR)最高,達到4.66%。陶氏化學透過改用塑膠IBC,將容器重量減少了35%,預計到2024年每年可節省180萬歐元(200萬美元)的成本。聯合國對危險物品的性能測試和相關法規有利於獲得認證的供應商,這提高了新進入者的進入門檻,同時也為現有企業提供了溢價空間。週轉箱和板條箱繼續受益於電子商務自動化,但與托盤和IBC相比,其規模仍然較小。
其他好處:
- Excel格式的市場預測(ME)表
- 3個月的分析師支持
目錄
第1章:引言
- 研究假設和市場定義
- 調查範圍
第2章:調查方法
第3章執行摘要
第4章 市場狀況
- 市場概覽
- 市場促進因素
- 政府推出有利於循環包裝的政策。
- 倉庫和物流中心的自動化正在加速 RTP(返回平台)的採用。
- 線上雜貨購物和食材自煮包的蓬勃發展正在推動對木箱的需求。
- 零售商的ESG掛鉤融資計劃
- 透過利用人工智慧進行資產追蹤,我們可以減少庫存損失(損耗)。
- 範圍 3 排放的揭露義務
- 市場限制因素
- 相關人員對流程變更的抵制
- 來自紡織品替代品的競爭
- 逆向物流人手不足
- 抗菌藥物依從性成本增加
- 產業價值鏈分析
- 監理情勢
- 技術展望
- 波特五力分析
- 宏觀經濟因素對市場的影響
第5章 市場規模與成長預測
- 材料
- 高密度聚苯乙烯
- 聚丙烯
- 其他材料
- 依產品類型
- 可重複使用塑膠容器(RPC)
- 調色盤
- 板條箱和手提袋
- 中型散貨箱(IBC)
- 其他產品類型
- 按最終用戶行業分類
- 食品/飲料
- 車
- 耐用消費品和電子設備
- 工業和化學
- 其他終端用戶產業
- 按分佈模型
- 泳池類型/租賃
- 專屬式所有權
- 按地區
- 美國
- 歐洲
- 英國
- 德國
- 法國
- 西班牙
- 其他歐洲國家
第6章 競爭情勢
- 市場集中度
- 策略趨勢
- 市佔率分析
- 公司簡介
- IFCO Systems NV
- Brambles Limited(CHEP)
- Schoeller Allibert Services BV
- Orbis Corporation(Menasha Corporation)
- CABKA NV
- SSI Schaefer Systems International GmbH
- Rehrig Pacific Company
- Tosca Services LLC
- RPP Containers Inc.
- Corplex SAS
- Friedola TECH GmbH(Con-Pearl)
- Friedola TECH GmbH(Con-Pearl)
- Sohner Plastics LLC
- Conteyor NV
- KTP Kunststoff-Palettentechnik GmbH
- Wellplast AB
- AUER Packaging GmbH
- WI Sales Co. Inc.
- Wisechmann GmbH
- DW Reusables NV
第7章 市場機會與未來展望
According to Mordor Intelligence, United States and Europe reusable plastic returnable transport packaging market size in 2026 is estimated at USD 24 billion, growing from 2025 value of USD 23.25 billion with 2031 projections showing USD 28.14 billion, growing at 3.21% CAGR over 2026-2031.
This report is Segmented by Material (HDPE, PP and More), Product Type (RPCs, Pallets, Crates, Ibcs and More), End-User (Food and Beverage, Automotive, Electronics, Chemicals and More), Distribution Model (Pooled, Captive) and Geography the Market Forecasts are Provided in Terms of Value (USD).
United States And Europe Reusable Plastic Returnable Transport Packaging Market Trends and Insights
Favorable Governmental Regulations on Circular Packaging
Royal Decree 1055/2022 in Spain imposes a EUR 0.45 per kilogram (USD 0.50 per kilogram) tax on non-reusable plastic and mandates 65% reuse by 2030, prompting rapid container conversion. California's Senate Bill 54 requires a 25% cut in single-use formats by 2032, influencing procurement across the state's USD 3.6 trillion economy. The EU Packaging and Packaging Waste Regulation sets a 10% reuse goal for transport packaging by 2030, reinforcing investments by multinational shippers. Federal procurement rules under the U.S. Environmental Protection Agency now prioritize reusable options, expanding demand from public-sector contractors. Collectively, these policies supply a durable tailwind for the reusable plastic returnable transport packaging market.
Warehouse and Distribution-Center Automation Accelerating RTP Uptake
Automated storage and retrieval systems prefer uniform containers with RFID tags, pushing enterprises toward reusable units. General Motors achieved a 23% drop in material-handling expense after standardizing containers across 15 plants in 2024. IEEE guidelines for IoT sensor installation in containers have lifted 98.5% asset visibility, enabling lights-out warehouse shifts. Multichannel fulfillment centers that ship 10,000 SKUs or more have reported 15-20% efficiency gains from reusable container use. Amazon fulfillment case work shows 40% higher robotic throughput with standardized totes, underscoring automation's multiplier effect.
Stakeholder Resistance to Process Change
Switching to reusable systems requires cross-enterprise coordination, and plants often endure 8-12% temporary productivity dips during the 6-18-month ramp-up. Many warehouse-management solutions cannot natively track reusable pools, forcing costly upgrades. Small and midsized companies struggle with minimum-volume thresholds imposed by pooling operators. Training expenses further dampen adoption, as staff must learn inspection and return protocols unfamiliar in single-use workflows. Mid-tier automotive suppliers have spent USD 150,000-300,000 on warehouse retrofits and training for reusable rollouts, illustrating the transition hurdle
Other drivers and restraints analyzed in the detailed report include:
- E-Grocery and Meal-Kit Boom Driving Crate Demand
- ESG-Linked Retailer Financing Programs
- Competition from Fibre-Based Alternatives
For complete list of drivers and restraints, kindly check the Table Of Contents.
Segment Analysis
HDPE accounts for 53.88% of the reusable plastic returnable transport packaging market. Its proven ruggedness across -40 °C to +60 °C keeps it the default for automotive and food logistics, even as price swings of 18% in 2024 triggered scrutiny of lifecycle cost spreads. Polypropylene claims the fastest 4.23% CAGR on the back of lightweighting and tight chemical-resistance needs. Ford cut container weight 23% by switching engine-part carriers to PP in 2024. Recycled-content mandates tilt in HDPE's favor because established streams can meet 25-30% content without property loss, shielding users from virgin-resin volatility.
Second-order trends include rising clarity requirements for pharmaceutical lines that give polycarbonate a toehold. Silver-ion antimicrobial mandates lift resin costs by 15-20%, yet users accept premiums when food-contact rules tighten. Overall, material choice now weighs total-cost-per-trip, recyclability, and regulatory compliance rather than resin sticker price alone, ensuring HDPE retains leadership while PP builds share in high-performance niches.
Pallets supplied 37.74% of sector revenue in 2025 and remain the bedrock of fast-moving consumer goods flows. Standard footprint, automated handling compatibility, and global pooling coverage cement their dominant position. The reusable plastic returnable transport packaging market size tied to pallets will keep pace with industrial-production growth rather than outpace it, reflecting a near-saturation environment.
Intermediate bulk containers show the highest 4.66% CAGR as chemical and food-ingredient shippers abandon steel due to corrosion and weight. Dow Chemical trimmed container mass by 35% and saved EUR 1.8 million (USD 2.0 million) annually in 2024 after switching to plastic IBCs. UN performance tests and hazardous-goods mandates favor certified suppliers, raising barriers for late entrants but supporting premium pricing for incumbents. Totes and crates continue to benefit from e-commerce automation but remain subscale relative to pallets and IBCs.
Complete Report Scope:
- By Material
- High-Density Polyethylene
- Polypropylene
- Other Materials
- By Product Type
- Reusable Plastic Containers (RPCs)
- Pallets
- Crates and Totes
- Intermediate Bulk Containers (IBCs)
- Other Product Types
- By End-User Industry
- Food and Beverage
- Automotive
- Consumer Durables and Electronics
- Industrial and Chemicals
- Other End-user Industries
- By Distribution Model
- Pooled / Rental
- Captive Ownership
- By Geography
- United States
- Europe
- United Kingdom
- Germany
- France
- Spain
- Rest of Europe
List of Companies Covered in this Report:
- IFCO Systems N.V.
- Brambles Limited (CHEP)
- Schoeller Allibert Services B.V.
- Orbis Corporation (Menasha Corporation)
- CABKA N.V.
- SSI Schaefer Systems International GmbH
- Rehrig Pacific Company
- Tosca Services LLC
- RPP Containers Inc.
- Corplex SAS
- Friedola TECH GmbH (Con-Pearl)
- Friedola TECH GmbH (Con-Pearl)
- Sohner Plastics LLC
- Conteyor NV
- KTP Kunststoff-Palettentechnik GmbH
- Wellplast AB
- AUER Packaging GmbH
- W.I. Sales Co. Inc.
- Wisechmann GmbH
- DW Reusables NV
Additional Benefits:
- The market estimate (ME) sheet in Excel format
- 3 months of analyst support
TABLE OF CONTENTS
1 INTRODUCTION
- 1.1 Study Assumptions and Market Definition
- 1.2 Scope of the Study
2 RESEARCH METHODOLOGY
3 EXECUTIVE SUMMARY
4 MARKET LANDSCAPE
- 4.1 Market Overview
- 4.2 Market Drivers
- 4.2.1 Favourable governmental regulations on circular packaging
- 4.2.2 Warehouse and DC automation accelerating RTP uptake
- 4.2.3 E-grocery and meal-kit boom driving crate demand
- 4.2.4 ESG-linked retailer financing programmes
- 4.2.5 AI-enabled asset-tracking reduces shrinkage
- 4.2.6 Scope-3-emission disclosure mandates
- 4.3 Market Restraints
- 4.3.1 Stakeholder resistance to process change
- 4.3.2 Competition from fibre-based alternatives
- 4.3.3 Reverse-logistics labour shortages
- 4.3.4 Antimicrobial compliance cost escalation
- 4.4 Industry Value Chain Analysis
- 4.5 Regulatory Landscape
- 4.6 Technological Outlook
- 4.7 Porters Five Forces Analysis
- 4.7.1 Bargaining Power of Suppliers
- 4.7.2 Bargaining Power of Buyers
- 4.7.3 Threat of New Entrants
- 4.7.4 Threat of Substitutes
- 4.7.5 Intensity of Rivalry
- 4.8 The Impact of Macroeconomic Factors on the Market
5 MARKET SIZE AND GROWTH FORECASTS (VALUE)
- 5.1 By Material
- 5.1.1 High-Density Polyethylene
- 5.1.2 Polypropylene
- 5.1.3 Other Materials
- 5.2 By Product Type
- 5.2.1 Reusable Plastic Containers (RPCs)
- 5.2.2 Pallets
- 5.2.3 Crates and Totes
- 5.2.4 Intermediate Bulk Containers (IBCs)
- 5.2.5 Other Product Types
- 5.3 By End-User Industry
- 5.3.1 Food and Beverage
- 5.3.2 Automotive
- 5.3.3 Consumer Durables and Electronics
- 5.3.4 Industrial and Chemicals
- 5.3.5 Other End-user Industries
- 5.4 By Distribution Model
- 5.4.1 Pooled / Rental
- 5.4.2 Captive Ownership
- 5.5 By Geography
- 5.5.1 United States
- 5.5.2 Europe
- 5.5.2.1 United Kingdom
- 5.5.2.2 Germany
- 5.5.2.3 France
- 5.5.2.4 Spain
- 5.5.2.5 Rest of Europe
6 COMPETITIVE LANDSCAPE
- 6.1 Market Concentration
- 6.2 Strategic Moves
- 6.3 Market Share Analysis
- 6.4 Company Profiles (includes Global Overview, Market Overview, Core Segments, Financials, Strategic Information, Share, Products and Services, Recent Developments)
- 6.4.1 IFCO Systems N.V.
- 6.4.2 Brambles Limited (CHEP)
- 6.4.3 Schoeller Allibert Services B.V.
- 6.4.4 Orbis Corporation (Menasha Corporation)
- 6.4.5 CABKA N.V.
- 6.4.6 SSI Schaefer Systems International GmbH
- 6.4.7 Rehrig Pacific Company
- 6.4.8 Tosca Services LLC
- 6.4.9 RPP Containers Inc.
- 6.4.10 Corplex SAS
- 6.4.11 Friedola TECH GmbH (Con-Pearl)
- 6.4.12 Friedola TECH GmbH (Con-Pearl)
- 6.4.13 Sohner Plastics LLC
- 6.4.14 Conteyor NV
- 6.4.15 KTP Kunststoff-Palettentechnik GmbH
- 6.4.16 Wellplast AB
- 6.4.17 AUER Packaging GmbH
- 6.4.18 W.I. Sales Co. Inc.
- 6.4.19 Wisechmann GmbH
- 6.4.20 DW Reusables NV
7 MARKET OPPORTUNITIES AND FUTURE OUTLOOK
- 7.1 White-Space and Unmet-Need Assessment

 可回收運輸包裝市場報告:趨勢、預測與競爭分析(至2035年)
 電子商務和運輸包裝解決方案市場預測至 2034 年—按包裝材料、包裝形式、功能、運輸方式、最終用戶和地區進行全球分析。2034年全球運輸包裝市場預測-按包裝類型、材料、產品類型、功能、最終用戶和地區分類的分析
 2026-2030年全球可回收運輸包裝材料市場
 可重複使用運輸包裝市場規模、佔有率和趨勢分析報告:按材料、產品、最終用途、使用模式、地區和細分市場分類(2026-2033 年)2034年可回收運輸包裝市場預測:按產品類型、材料、分銷管道、最終用戶和地區分類的全球分析可回收包裝系統市場預測至2034年—按材料、產品類型、系統、所有權類型、應用、最終用戶和地區分類的全球分析可重複使用運輸包裝市場預測至2034年-按產品類型、材料、分銷管道、最終用戶和地區分類的全球分析押金返還系統基礎設施市場預測至2034年-按基礎設施組件、容器類型、技術、應用、最終用戶和地區分類的全球分析
 運輸包裝市場規模、佔有率、成長及全球產業分析:按類型、應用和地區的洞察,2026-2034年預測