


 |
市場調查報告書
商品編碼
2124550
軟體配置分析:市場佔有率分析、產業趨勢與統計、成長預測(2026-2031)Software Composition Analysis - Market Share Analysis, Industry Trends & Statistics, Growth Forecasts (2026 - 2031) |
||||||

※ 本網頁內容可能與最新版本有所差異。詳細情況請與我們聯繫。
據 Mordor Intelligence 稱,2025 年軟體配置分析市場價值為 3,646.9 億美元,預計到 2031 年將達到 9816.2 億美元,而 2026 年為 4301.2 億美元,預測期(2026-2031 年)的複合成長率為 17.95%。
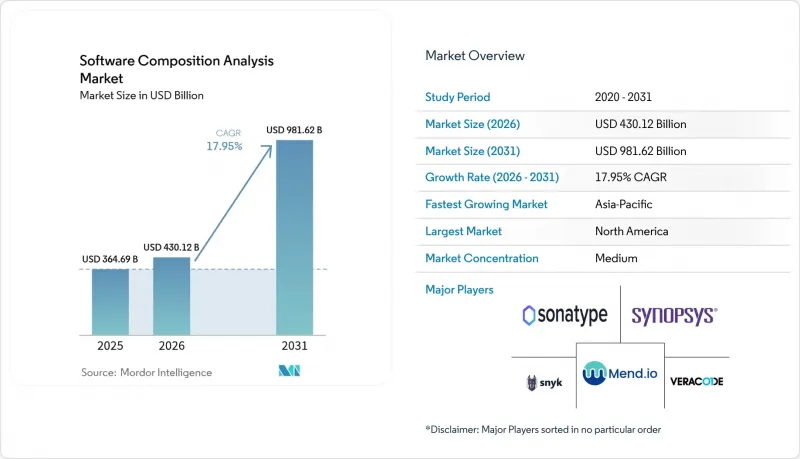
本報告按組件(解決方案、服務)、部署模式(雲端、本地部署、混合部署)、組織規模(大型企業、中小企業)、產業(IT與電信、銀行、金融服務和保險、零售與電子商務等)以及地區進行細分。市場預測以美元計價。
全球軟體配置分析市場趨勢及洞察
對開放原始碼元件的依賴
超過 99% 的企業程式碼庫中都存在開放原始碼庫,這造成了傳統應用程式安全工具無法彌補的可見性缺口。套件管理器和容器鏡像加劇了傳遞依賴關係,這意味著如今平均每個雲端原生應用都整合了數百個跨多種語言的第三方模組。 2024 年,主要程式碼庫中存在漏洞和惡意軟體的軟體包數量增加了 28%,迫使安全團隊實施持續監控和自動化盤點。儘管存在這些風險,但企業仍依賴開源,開放原始碼它每年可節省約 8.8 兆美元的開發成本,而且在以創新為主導的藍圖中放棄開放原始碼是不可行的。
SBOM 和合規監管要求
在美國,根據第14028號行政命令和網路安全與基礎設施安全局(CISA)制定的安全軟體開發認證框架,聯邦供應商必須提交經認證的軟體建構材料(SBOM),該框架將於2024年3月生效。歐盟的《網路彈性法案》將於2024年12月生效,該法案強制要求所有包含數位元素的產品都必須創建SBOM,並對違規行為處以最高可達全球銷售額2.5%的罰款。日本經濟產業省(METI)也發布了類似的指南,顯示全球政策趨勢正在趨同。由於合規要求,採用軟體配置分析(SCA)的採購方式正在擴展到製造業、汽車業、醫療業和工業自動化等行業,而這些產業先前一直將軟體安全視為次要問題。
SCA領域專家短缺
光是在美國,網路安全專業人員缺口就高達22.5萬人,遠超市場需求,導致許多組織缺乏解讀詳細依賴關係圖、確定漏洞優先順序和製定修復策略所需的專業知識。由於軟體配置分析涉及開發、法律和採購等多個部門,傳統的安全人員招募方式無法彌補這項技能缺口。企業報告稱,培訓一名新的分析師需要6到12個月的時間,這導致企業更加依賴供應商服務和託管安全服務供應商,推高了整體擁有成本(TCO)。
細分市場分析
到 2025 年,解決方案將佔總收入的 66.80%。這反映出企業傾向於選擇整合套件,將漏洞檢測、授權和 SBOM 自動化整合到一個統一的主機中。強大的策略引擎、開發者外掛程式和工作流程編配功能正在推動重疊安全功能的整合。服務板塊雖然規模仍然較小,但預計到 2031 年將以 18.05% 的複合年成長率成長。這是因為大多數組織缺乏深厚的專業知識來微調掃描策略、將工具整合到複雜的 CI/CD 管道中以及解讀細微的授權風險。因此,諮詢、整合和託管檢測服務可以幫助企業將其平台投資轉化為實際應用。
擁有數千個涵蓋多種語言的儲存庫的組織正擴大利用專業服務合作夥伴來客製化掃描效能、設計糾正措施方案,並將結果整合到管治、風險和合規 (GRC) 儀表板中。對於中型買家而言,託管服務透過提供承包的儀表板和專家級故障排除,縮短了部署時間。因此,儘管平台使用費仍然是軟體配置分析 (SCA) 市場的主要收入來源,但業務收益的成長速度已經超過了純粹的授權擴張。
預計到2025年,雲端託管產品將佔62.10%的市場佔有率,複合年成長率(CAGR)為19.05%,凸顯了SaaS的經濟模式與敏捷軟體開發流程的協同效應。即時資料庫更新、強大的運算能力以及與GitHub和GitLab Actions的直接整合,使得無需專用基礎設施即可實現高頻掃描。在國防、關鍵基礎設施和高度監管的金融機構中,本地部署仍然至關重要,因為資料主權和出口管制法規限制了程式碼的外部流動。
混合解決方案正逐漸成為一種切實可行的折衷方案,它允許企業在本地掃描器上保留敏感原始碼,同時從雲端 API 獲取即時漏洞資訊。供應商正透過人工智慧驅動的修復提案和利用雲端 GPU叢集進行模型訓練的容器鏡像掃描來凸顯自身優勢。這種技術深度正在擴大原生 SaaS領導企業與傳統本地部署企業之間的效能差距,預算分配也正從永久授權轉向雲端訂閱。
區域分析
北美仍然是我們最大的區域貢獻者,預計2025年將占我們總收入的27.10%。這主要得益於美國聯邦政府的採購要求,該要求規定所有政府軟體承包商必須提交軟體工程物料清單 (SBOM) 並獲得安全開發認證。該地區擁有強大的創業投資生態系統、成熟的DevSecOps文化,以及眾多平台供應商,這些都加速了私部門對相關技術的應用。
在歐洲,隨著《網路韌性法案》於 2024 年 12 月實施,成長動能正在增強。該法案強制要求所有在歐盟境內銷售的數位產品在 2027 年前提交 SBOM(基於服務的製造聲明)。德國憑藉其出口導向製造業基礎,在早期採用方面處於領先地位,而英國則透過金融服務現代化計劃和加強國家基礎設施的舉措,保持著支出勢頭。
預計到2031年,亞太地區的年複合成長率(CAGR)將達到18.88%,位居全球最高。日本已透過經濟產業省發布了詳細的軟體配置物料清單(SBOM)指南,目前由多家大型企業組成的聯盟正在試行通用工具,以簡化實施流程。中國正在投資發展國內軟體配置分析(SCA)能力,以保護其戰略產業;而印度的IT服務業正在將SBOM的創建納入與跨國公司的合約中。隨著公共部門數位化進程的加速,東南亞國家面臨更多供應鏈威脅,因此需要採取積極主動的措施,這也凸顯了它們對SBOM日益成長的興趣。
其他好處:
- Excel格式的市場預測(ME)表
- 3個月的分析師支持
目錄
第1章:引言
- 研究假設和市場定義
- 調查範圍
第2章:調查方法
第3章執行摘要
第4章 市場狀況
- 市場概覽
- 市場促進因素
- 對開放原始碼元件的依賴
- SBOM 和合規方面的監理義務
- 供應鍊網路攻擊日益加劇
- 左移DevSecOps預算
- 網路保險承保要求
- AI產生的程式碼擴展了傳遞依賴關係。
- 市場限制因素
- 具備SCA認證的人員短缺
- 大量假陽性導致的疲勞
- 許可證疲勞正在縮小掃描範圍。
- 運行時完整性工具正在蠶食 SCA 方面的支出。
- 供應鏈分析
- 監理情勢
- 技術展望
- 波特五力模型
- 對影響市場的宏觀經濟因素進行評估
第5章 市場規模與成長預測
- 按組件
- 解決方案
- 服務
- 部署模式
- 雲
- 現場
- 混合
- 按組織規模
- 大公司
- 小型企業
- 按行業分類
- IT/通訊
- BFSI
- 零售與電子商務
- 政府
- 醫療保健和生命科學
- 製造業
- 車
- 能源公用事業
- 其他行業
- 按地區
- 北美洲
- 美國
- 加拿大
- 墨西哥
- 南美洲
- 巴西
- 阿根廷
- 其他南美國家
- 歐洲
- 德國
- 英國
- 法國
- 義大利
- 西班牙
- 其他歐洲國家
- 亞太地區
- 中國
- 日本
- 印度
- 韓國
- 東南亞
- 其他亞太國家
- 中東和非洲
- 中東
- 沙烏地阿拉伯
- 阿拉伯聯合大公國
- 土耳其
- 其他中東國家
- 非洲
- 南非
- 奈及利亞
- 埃及
- 其他非洲國家
- 中東
- 北美洲
第6章 競爭情勢
- 市場集中度
- 策略趨勢
- 市佔率分析
- 公司簡介
- Synopsys Inc.
- Sonatype Inc.
- Snyk Ltd.
- Veracode Inc.
- Mend.io(White Source Ltd.)
- Flexera(Revenera)
- Contrast Security Inc.
- OpenText Corp.
- Perforce Software Inc.
- Checkmarx Ltd.
- GitLab Inc.
- GitHub(Microsoft Corp.)
- JFrog Ltd.
- Black Duck(Synopsys)
- Endor Labs
- Datadog Inc.
- Palo Alto Networks(Prisma Cloud)
- IBM Corp.
- Broadcom(Symantec)
- Micro Focus(OpenText)
- nexB Inc.
- Qwiet AI
- SecureStack
第7章 市場機會與未來展望
According to Mordor Intelligence, the software composition analysis market size was valued at USD 364.69 billion in 2025 and estimated to grow from USD 430.12 billion in 2026 to reach USD 981.62 billion by 2031, at a CAGR of 17.95% during the forecast period (2026-2031).
This report is Segmented by Component (Solutions, Services), Deployment Mode (Cloud, On-Premises, Hybrid), Organization Size (Large Enterprises, Small and Medium Enterprises), Industry Vertical (IT and Telecom, BFSI, Retail and E-Commerce, and More), and by Geography. The Market Forecasts are Provided in Terms of Value (USD).
Global Software Composition Analysis Market Trends and Insights
Dependence on Open-Source Components
Open-source libraries appear in more than 99% of enterprise codebases, creating visibility gaps that legacy application security tooling cannot bridge. Package managers and container images multiply transitive dependencies, so an average cloud-native application now incorporates hundreds of third-party modules across several languages. Vulnerable or malicious packages grew 28% in major repositories during 2024, forcing security teams to adopt continuous monitoring and inventory automation. Despite risk exposure, organizations retain open-source reliance because it saves an estimated USD 8.8 trillion in annual development costs, making abandonment impractical for innovation-driven roadmaps.
Regulatory Mandates for SBOM and Compliance
In the United States, federal suppliers must now deliver attested SBOMs under Executive Order 14028 and CISA's March 2024 Secure Software Development Attestation framework.The European Union's Cyber Resilience Act, effective December 2024, obliges SBOM creation for every product with digital elements and imposes penalties of up to 2.5% of global turnover for non-compliance. Japan's Ministry of Economy, Trade and Industry (METI) has issued similar guidelines, signaling converging global policy momentum. Compliance imperatives extend Software Composition Analysis procurement into manufacturing, automotive, healthcare, and industrial automation domains where software security was previously peripheral.
Shortage of SCA-Skilled Talent
The United States alone trails demand by 225,000 cybersecurity workers, leaving many organizations without the expertise to interpret detailed dependency graphs, prioritize vulnerabilities, and craft remediation policies. Because Software Composition Analysis spans development, legal, and procurement functions, the skills gap cannot be bridged through traditional security hiring alone. Firms report six-to-twelve-month onboarding cycles for new analysts, driving reliance on vendor professional services and managed security providers, which elevates total cost of ownership.
Other drivers and restraints analyzed in the detailed report include:
- Escalating Supply-Chain Cyber-attacks
- Shift-Left DevSecOps Budgets
- High False-Positive Fatigue
For complete list of drivers and restraints, kindly check the Table Of Contents.
Segment Analysis
Solutions generated 66.80% revenue in 2025, reflecting enterprise preference for unified suites that combine vulnerability detection, license governance, and SBOM automation in a single console. Extensive policy engines, developer plug-ins, and workflow orchestration capabilities encourage consolidation of overlapping security functions. Services, though smaller, accelerate at 18.05% CAGR through 2031 because most organizations lack deep expertise to fine-tune scan policies, embed tooling into sprawling CI/CD pipelines, and interpret nuanced license risks. Consulting, integration, and managed detection offerings therefore help enterprises operationalize platform investments.
Organizations with thousands of repositories across diverse languages increasingly engage specialist service partners to customize scan performance, design remediation playbooks, and integrate results into governance, risk, and compliance dashboards. For mid-market buyers, managed services offset onboarding time by providing turnkey dashboards and expert triage. As a result, services revenue growth outpaces pure license expansion, even though platform fees continue to anchor the Software Composition Analysis market.
Cloud-hosted products secured 62.10% share in 2025 and display a 19.05% CAGR outlook, underscoring how SaaS economics resonate with agile software pipelines. Instant database updates, elastic compute capacity, and direct integration with GitHub or GitLab actions enable high-frequency scans without dedicated infrastructure. On-premises deployments remain essential in defense, critical infrastructure, and highly regulated financial institutions where data sovereignty or export-control rules prevent external code movement.
Hybrid patterns emerge as a pragmatic middle path, allowing enterprises to retain sensitive source code in local scanners while pulling real-time vulnerability intelligence from cloud APIs. Vendors differentiate through AI-supported remediation suggestions and container image scanning that leverage cloud GPU clusters for model training. This technical depth widens the performance gap between native-SaaS leaders and legacy on-premise incumbents, steering budget allocations toward cloud subscriptions over perpetual licenses.
Complete Report Scope:
- By Component
- Solutions
- Services
- By Deployment Mode
- Cloud
- On-premises
- Hybrid
- By Organisation Size
- Large Enterprises
- Small and Medium Enterprises
- By Industry Vertical
- IT and Telecom
- BFSI
- Retail and E-commerce
- Government
- Healthcare and Life Sciences
- Manufacturing
- Automotive
- Energy and Utilities
- Other Verticals
- By Geography
- North America
- United States
- Canada
- Mexico
- South America
- Brazil
- Argentina
- Rest of South America
- Europe
- Germany
- United Kingdom
- France
- Italy
- Spain
- Rest of Europe
- Asia-Pacific
- China
- Japan
- India
- South Korea
- Southeast Asia
- Rest of Asia-Pacific
- Middle East and Africa
- Middle East
- Saudi Arabia
- United Arab Emirates
- Turkey
- Rest of Middle East
- Africa
- South Africa
- Nigeria
- Egypt
- Rest of Africa
- Middle East
- North America
Geography Analysis
North America remained the largest regional contributor with 27.10% of 2025 revenue, anchored by U.S. federal procurement mandates that oblige every government software contractor to furnish SBOMs and secure-development attestations. The region benefits from deep venture-capital ecosystems, mature DevSecOps cultures, and a concentration of platform vendors that accelerate private-sector adoption.
Europe's trajectory strengthens following the December 2024 enactment of the Cyber Resilience Act, which obliges SBOMs for any digital product sold in the bloc by 2027. Germany drives early uptake thanks to its export-oriented manufacturing base, while the United Kingdom maintains spending momentum through financial-services modernization programs and national infrastructure hardening initiatives.
Asia-Pacific posts the fastest 18.88% CAGR through 2031. Japan promulgated detailed SBOM guidelines via METI, and a consortium of major enterprises now pilots common tooling stacks to streamline adoption. China invests in domestic Software Composition Analysis capacity to protect strategic industries, whereas India's IT-services sector embeds SBOM generation into contracts with multinational customers. Southeast Asian economies show rising interest as public-sector digitalization initiatives expose them to supply-chain threats that demand proactive controls.
- Synopsys Inc.
- Sonatype Inc.
- Snyk Ltd.
- Veracode Inc.
- Mend.io (White Source Ltd.)
- Flexera (Revenera)
- Contrast Security Inc.
- OpenText Corp.
- Perforce Software Inc.
- Checkmarx Ltd.
- GitLab Inc.
- GitHub (Microsoft Corp.)
- JFrog Ltd.
- Black Duck (Synopsys)
- Endor Labs
- Datadog Inc.
- Palo Alto Networks (Prisma Cloud)
- IBM Corp.
- Broadcom (Symantec)
- Micro Focus (OpenText)
- nexB Inc.
- Qwiet AI
- SecureStack
Additional Benefits:
- The market estimate (ME) sheet in Excel format
- 3 months of analyst support
TABLE OF CONTENTS
1 INTRODUCTION
- 1.1 Study Assumptions and Market Definition
- 1.2 Scope of the Study
2 RESEARCH METHODOLOGY
3 EXECUTIVE SUMMARY
4 MARKET LANDSCAPE
- 4.1 Market Overview
- 4.2 Market Drivers
- 4.2.1 Dependence on Open-Source Components
- 4.2.2 Regulatory Mandates for SBOM and Compliance
- 4.2.3 Escalating Supply-Chain Cyber-attacks
- 4.2.4 Shift-Left DevSecOps Budgets
- 4.2.5 Cyber-insurance Underwriting Requirements
- 4.2.6 AI Code-Generation Expanding Transitive Dependencies
- 4.3 Market Restraints
- 4.3.1 Shortage of SCA-Skilled Talent
- 4.3.2 High False-Positive Fatigue
- 4.3.3 License Fatigue Curtailing Scan Scope
- 4.3.4 Run-time Integrity Tools Cannibalising SCA Spend
- 4.4 Supply-Chain Analysis
- 4.5 Regulatory Landscape
- 4.6 Technological Outlook
- 4.7 Porter's Five Forces
- 4.7.1 Bargaining Power of Buyers
- 4.7.2 Bargaining Power of Suppliers
- 4.7.3 Threat of New Entrants
- 4.7.4 Threat of Substitutes
- 4.7.5 Intensity of Competitive Rivalry
- 4.8 Assesment of Macroeconomic Factors on the market
5 MARKET SIZE AND GROWTH FORECASTS (VALUE)
- 5.1 By Component
- 5.1.1 Solutions
- 5.1.2 Services
- 5.2 By Deployment Mode
- 5.2.1 Cloud
- 5.2.2 On-premises
- 5.2.3 Hybrid
- 5.3 By Organisation Size
- 5.3.1 Large Enterprises
- 5.3.2 Small and Medium Enterprises
- 5.4 By Industry Vertical
- 5.4.1 IT and Telecom
- 5.4.2 BFSI
- 5.4.3 Retail and E-commerce
- 5.4.4 Government
- 5.4.5 Healthcare and Life Sciences
- 5.4.6 Manufacturing
- 5.4.7 Automotive
- 5.4.8 Energy and Utilities
- 5.4.9 Other Verticals
- 5.5 By Geography
- 5.5.1 North America
- 5.5.1.1 United States
- 5.5.1.2 Canada
- 5.5.1.3 Mexico
- 5.5.2 South America
- 5.5.2.1 Brazil
- 5.5.2.2 Argentina
- 5.5.2.3 Rest of South America
- 5.5.3 Europe
- 5.5.3.1 Germany
- 5.5.3.2 United Kingdom
- 5.5.3.3 France
- 5.5.3.4 Italy
- 5.5.3.5 Spain
- 5.5.3.6 Rest of Europe
- 5.5.4 Asia-Pacific
- 5.5.4.1 China
- 5.5.4.2 Japan
- 5.5.4.3 India
- 5.5.4.4 South Korea
- 5.5.4.5 Southeast Asia
- 5.5.4.6 Rest of Asia-Pacific
- 5.5.5 Middle East and Africa
- 5.5.5.1 Middle East
- 5.5.5.1.1 Saudi Arabia
- 5.5.5.1.2 United Arab Emirates
- 5.5.5.1.3 Turkey
- 5.5.5.1.4 Rest of Middle East
- 5.5.5.2 Africa
- 5.5.5.2.1 South Africa
- 5.5.5.2.2 Nigeria
- 5.5.5.2.3 Egypt
- 5.5.5.2.4 Rest of Africa
- 5.5.5.1 Middle East
- 5.5.1 North America
6 COMPETITIVE LANDSCAPE
- 6.1 Market Concentration
- 6.2 Strategic Moves
- 6.3 Market Share Analysis
- 6.4 Company Profiles (includes Global-level Overview, Market-level Overview, Core Segments, Financials, Strategic Information, Market Rank/Share, Products and Services, Recent Developments)
- 6.4.1 Synopsys Inc.
- 6.4.2 Sonatype Inc.
- 6.4.3 Snyk Ltd.
- 6.4.4 Veracode Inc.
- 6.4.5 Mend.io (White Source Ltd.)
- 6.4.6 Flexera (Revenera)
- 6.4.7 Contrast Security Inc.
- 6.4.8 OpenText Corp.
- 6.4.9 Perforce Software Inc.
- 6.4.10 Checkmarx Ltd.
- 6.4.11 GitLab Inc.
- 6.4.12 GitHub (Microsoft Corp.)
- 6.4.13 JFrog Ltd.
- 6.4.14 Black Duck (Synopsys)
- 6.4.15 Endor Labs
- 6.4.16 Datadog Inc.
- 6.4.17 Palo Alto Networks (Prisma Cloud)
- 6.4.18 IBM Corp.
- 6.4.19 Broadcom (Symantec)
- 6.4.20 Micro Focus (OpenText)
- 6.4.21 nexB Inc.
- 6.4.22 Qwiet AI
- 6.4.23 SecureStack
7 MARKET OPPORTUNITIES AND FUTURE OUTLOOK
- 7.1 White-Space and Unmet-Need Assessment

 軟體配置分析市場:按組件、部署模型、組織規模、產業和地區分類
 軟體配置分析市場規模、佔有率和成長分析(按部署模式、垂直產業、組件和地區分類)-2026-2033年產業預測
 自動化測試、軟體成分分析和 SBOM 工具:AI 增強型分析已成為主流