

 |
市場調查報告書
商品編碼
2124545
開放原始碼服務:市場佔有率分析、產業趨勢與統計、成長預測(2026-2031)Open Source Service - Market Share Analysis, Industry Trends & Statistics, Growth Forecasts (2026 - 2031) |
||||||

※ 本網頁內容可能與最新版本有所差異。詳細情況請與我們聯繫。
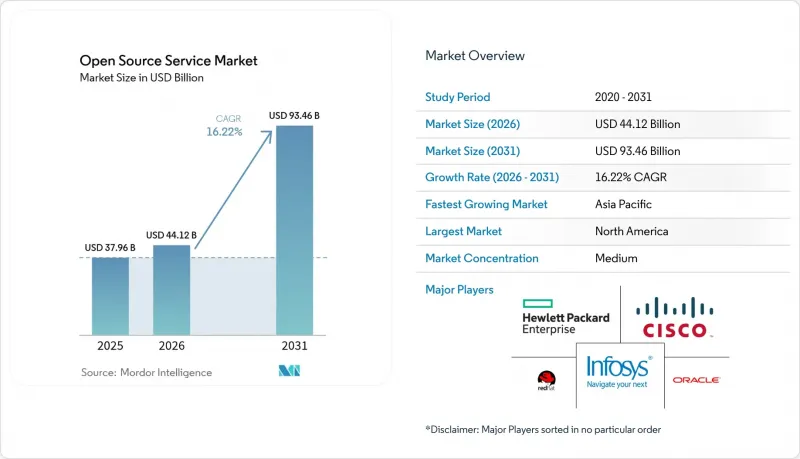
根據 Mordor Intelligence 預測,開放原始碼服務市場規模將從 2025 年的 379.6 億美元成長到 2026 年的 441.2 億美元,然後在 2031 年達到 934.6 億美元,2026 年至 2031 年的複合年成長率為 16.2%。
本報告按服務類型(諮詢與實施、支援、維護與管理及其他)、部署方式(本地部署、雲端部署)、應用領域(基礎設施管理、應用開發與整合及其他)、最終用戶產業(銀行、金融服務和保險業及其他)以及地區進行細分。市場預測以美元計價。
全球開放原始碼服務市場趨勢與洞察
降低整體擁有成本 (TCO) 並縮短上市時間
為了降低許可成本並加快解決方案部署,各組織機構正在採用開放原始碼。到 2025 年,53% 的機構將節省節省成本作為採用開源軟體的主要動機。金融服務公司尤其體現了這種轉變,78% 的公司表示採用開放原始碼帶來了更大的價值,90% 的公司認為這種方法對其未來的營運至關重要。借助免費框架實現的 AI 專案快速原型製作縮短了採購週期,但對安全部署到生產環境日益成長的需求正在推動付費支援合約的成長。
雲端原生和DevOps的採用正在迅速成長。
推廣容器化和 GitOps 的公司高度依賴開放原始碼工具,這增加了對專家諮詢的需求。目前,90% 的受訪公司使用容器,86% 的公司運行 Kubernetes叢集,85% 的公司需要專家協助管理這些環境。德國電信等電信集團正在應用這些方法重建其 5G 網路,這充分展現了開放標準的擴充性。
安全和漏洞問題
儘管91%的金融機構依賴開放原始碼安全,但備受矚目的供應鏈攻擊事件提高了人們對風險的認知。聯邦政府對CVE系統的資助將於2025年4月終止,這將使漏洞追蹤變得更加困難。近期在Linux和Ruby-SAML中發現的漏洞凸顯了漏洞檢測的長期滯後,促使企業購買專業的監控和修補程式服務。
細分市場分析
2025年,隨著企業應對複雜的遷移挑戰,諮詢和實施領域在開放原始碼服務市場仍將佔據42.74%的佔有率。同時,隨著企業轉向基於結果的合約和持續最佳化,託管服務預計將以17.6%的複合年成長率成長。面對容器的無序擴張(85%的企業需要容器支援生產工作負載),企業往往更傾向於長期託管合約而非臨時支援。
培訓和認證行業正在快速成長,52% 的管理者傾向於聘用持有認證資格的人員。同時,對於擴展多元化技術堆疊的組織而言,支援、維護和管理仍然至關重要。開放原始碼服務市場正受益於這種多層次的需求結構,將技能短缺轉化為供應商持續的商機。
到2025年,本地部署解決方案將佔開放原始碼服務市場的67.78%,這反映了監管和資料主權方面的需求。然而,隨著混合架構的日益成熟,雲端採用率正以18.03%的複合年成長率穩定成長。電信業者報告稱,雲端遷移的成功率高達77%,但他們仍保留私有環境來處理高度敏感的工作負載。
容器技術的普及模糊了部署模式之間的界限,因為90%的企業都在本地和公共雲端平台上運行容器化程式碼。這種整合使得開放原始碼服務市場在所有基礎設施模式下都具有更強的適應性,並擴大了整合專家的工作範圍。
區域分析
預計到2025年,北美將佔全球開源軟體收入的37.35%,這主要得益於成熟的企業應用、豐富的開源人才儲備以及創業投資對商業開放原始碼新創企業的支持。金融服務聯盟(例如FINOS)正在促進程式碼共用,而大規模併購(例如IBM以64億美元收購HashiCorp)表明,成熟企業正在增加對開放原始碼產品組合的投資。該地區的價值提案著重於複雜且高利潤的諮詢交易。
亞太地區是成長最快的地區,預計到2031年複合年成長率將達到16.92%。中國正將開放原始碼定位為實現技術自主的基石,而印度的IT服務業正將其專業知識輸出至全球。亞太地區的企業在全球現代化指標方面處於主導,其中67%的企業正在使用開放原始碼基礎設施工具。日本、韓國和澳洲的電信業者正在部署基於Kubernetes的5G核心網,從而維持了該地區服務發展的強勁勢頭。
歐洲的發展趨勢正受惠於《數位市場法案》和各國主權保護計畫。德國採用 openDesk 以及瑞士聯邦法律《EMBAG》正在加速企業擺脫專有軟體套件的趨勢。擁有合規專業知識和多語言交付團隊的服務供應商正在滿足不斷成長的需求,為整個歐洲的開放原始碼服務市場帶來強勁的前景。
其他好處:
- Excel格式的市場預測(ME)表
- 3個月的分析師支持
目錄
第1章:引言
- 市場分析與定義的前提條件
- 分析範圍
第2章 分析方法
第3章執行摘要
第4章 市場狀況
- 市場概覽
- 市場促進因素
- 降低擁有成本,縮短上市時間。
- 互通性和客製化柔軟性
- 雲端原生和DevOps的採用正在迅速成長。
- 企業數位轉型預算
- 歐盟的《數位市場法》推動了開放標準的推廣。
- 避免供應商鎖定,並專注於永續性。
- 市場限制因素
- 安全和漏洞問題
- 熟練的開放原始碼人才短缺
- 許可證合規的複雜性
- 社區專案取消的風險
- 價值鏈分析
- 監理情勢
- 技術展望
- 波特五力分析
第5章:預測市場規模與成長率
- 按服務類型
- 諮詢和實施
- 支援、維護和管理
- 託管服務
- 培訓和認證
- 透過部署方法
- 現場
- 雲
- 透過使用
- 基礎設施管理
- 應用開發與整合
- 數據管理與分析
- 安全合規性
- 按最終用戶行業分類
- 銀行、金融服務和保險業 (BFSI)
- 資訊科技/通訊
- 製造業
- 政府/公共部門
- 醫學與生命科學
- 其他終端用戶產業
- 按地區
- 北美洲
- 美國
- 加拿大
- 墨西哥
- 歐洲
- 德國
- 英國
- 法國
- 義大利
- 西班牙
- 其他歐洲國家
- 亞太地區
- 中國
- 日本
- 印度
- 韓國
- 澳洲
- 其他亞太國家
- 南美洲
- 巴西
- 阿根廷
- 其他南美國家
- 中東和非洲
- 中東
- 沙烏地阿拉伯
- 阿拉伯聯合大公國
- 土耳其
- 其他中東國家
- 非洲
- 南非
- 埃及
- 奈及利亞
- 其他非洲國家
- 中東
- 北美洲
第6章 競爭情勢
- 市場集中度
- 策略趨勢
- 市佔率分析
- 公司簡介
- Accenture plc
- Atos SE
- AWS(Amazon Web Services)
- Cisco Systems Inc.
- Deloitte
- Google LLC
- HCL Technologies
- Hewlett Packard Enterprise
- IBM Corporation
- Infosys Ltd.
- NTT Data
- Oracle Corporation
- Red Hat Inc.
- SUSE
- Tata Consultancy Services(TCS)
- Tech Mahindra
- VMware(Tanzu)
- Wipro Ltd.
- Canonical Ltd.
- HashiCorp
第7章 市場機會與未來展望
According to Mordor Intelligence, the open source service market size is expected to grow from USD 37.96 billion in 2025 to USD 44.12 billion in 2026 and is forecast to reach USD 93.46 billion by 2031 at 16.22% CAGR over 2026-2031.
This report is Segmented by Service Type (Consulting and Implementation, Support, Maintenance, and Management, and More), Deployment Mode (On-Premise and Cloud), Application (Infrastructure Management, Application Development and Integration, and More), End-User Industry (Banking, Financial Services and Insurance (BFSI), and More), and Geography. The Market Forecasts are Provided in Terms of Value (USD).
Global Open Source Service Market Trends and Insights
Reduced Cost of Ownership and Time-to-Market
Organizations select open source to cut licensing fees and accelerate solution rollout. In 2025, 53% cited cost reduction as their prime adoption impulse. Financial-services firms illustrate this shift: 78% reported higher value from open-source implementations and 90% deemed the approach vital for future operations. Rapid prototyping in AI projects, made possible by freely available frameworks, trims procurement cycles, yet the need for secure production rollouts fuels paid support engagements.
Cloud-Native and DevOps Adoption Surge
Enterprises pursuing containerization and GitOps rely heavily on open-source tooling, pushing demand for specialized consulting. Container usage now spans 90% of surveyed firms, with 86% running Kubernetes clusters, while 85% require professional assistance to manage these environments. Telecommunications groups such as Deutsche Telekom apply these practices to re-architect 5G networks, proving the scalability of open standards.
Security and Vulnerability Concerns
Although 91% of financial institutions express confidence in open-source security, high-profile supply-chain attacks elevate risk perceptions. The April 2025 withdrawal of federal funding for the CVE system complicates vulnerability tracking. Recent flaws in Linux and Ruby-SAML spotlight long discovery lags, prompting enterprises to purchase professional monitoring and patching services.
Other drivers and restraints analyzed in the detailed report include:
- Enterprise Digital-Transformation Budgets
- Interoperability and Customisation Flexibility
- Scarcity of Skilled Open-Source Talent
For complete list of drivers and restraints, kindly check the Table Of Contents.
Segment Analysis
Consulting and Implementation retained a 42.74% Open Source Service market share in 2025 as enterprises tackled complex migrations. Managed Services, however, is forecast to post a 17.6% CAGR as firms pivot toward outcome-based engagements and continuous optimization. Enterprises confronting container sprawl-85% need help with production workloads-prefer long-term managed contracts to ad-hoc support.
Training and Certification grows quickly because 52% of managers favor certified hires, while Support, Maintenance and Management remains a staple for organizations scaling diverse stacks. The Open Source Service market benefits from this layered demand structure, turning skill scarcity into recurring-revenue opportunities for service vendors.
On-premise held 67.78% of the Open Source Service market size in 2025, reflecting regulatory and data-sovereignty needs. Yet cloud deployments are advancing at an 18.03% CAGR as hybrid architectures normalize. Telecom operators report 77% effectiveness for cloud migrations, but maintain private environments for sensitive workloads.
Container adoption blurs deployment distinctions because 90% of firms run containerized code on both on-premise and public-cloud platforms. This convergence keeps the Open Source Service market resilient across infrastructure models and expands the addressable scope for integration specialists.
Complete Report Scope:
- By Service Type
- Consulting and Implementation
- Support, Maintenance and Management
- Managed Services
- Training and Certification
- By Deployment Mode
- On-premise
- Cloud
- By Application
- Infrastructure Management
- Application Development and Integration
- Data Management and Analytics
- Security and Compliance
- By End-user Industry
- Banking, Financial Services and Insurance (BFSI)
- IT and Telecom
- Manufacturing
- Government and Public Sector
- Healthcare and Life Sciences
- Other End-user Industries
- By Geography
- North America
- United States
- Canada
- Mexico
- Europe
- Germany
- United Kingdom
- France
- Italy
- Spain
- Rest of Europe
- Asia-Pacific
- China
- Japan
- India
- South Korea
- Australia
- Rest of Asia-Pacific
- South America
- Brazil
- Argentina
- Rest of South America
- Middle East and Africa
- Middle East
- Saudi Arabia
- United Arab Emirates
- Turkey
- Rest of Middle East
- Africa
- South Africa
- Egypt
- Nigeria
- Rest of Africa
- Middle East
- North America
Geography Analysis
North America accounted for 37.35% of 2025 revenue thanks to mature enterprise adoption, a deep talent pool, and venture-capital backing for commercial open-source startups. Financial-services consortia such as FINOS encourage code sharing, and large-scale M&A-IBM's USD 6.4 billion HashiCorp purchase-shows incumbents doubling down on open-source portfolios. The region's value proposition centers on complex, high-margin consulting engagements.
Asia-Pacific is the fastest-growing region, projected at 16.92% CAGR through 2031. China positions open source as a pillar of tech self-reliance, while India's IT services sector exports expertise worldwide. APAC organizations lead global modernization metrics, with 67% using open-source infrastructure tools. Telecommunications carriers in Japan, South Korea, and Australia deploy Kubernetes-driven 5G cores, sustaining regional service momentum.
Europe's trajectory benefits from the Digital Markets Act and national sovereignty programs. Germany's openDesk rollout and Switzerland's federal EMBAG law are spurring migration away from proprietary suites. Service providers with compliance know-how and multilingual delivery teams capture rising demand, making the Open Source Service market outlook robust across the continent.
- Accenture plc
- Atos SE
- AWS (Amazon Web Services)
- Cisco Systems Inc.
- Deloitte
- Google LLC
- HCL Technologies
- Hewlett Packard Enterprise
- IBM Corporation
- Infosys Ltd.
- NTT Data
- Oracle Corporation
- Red Hat Inc.
- SUSE
- Tata Consultancy Services (TCS)
- Tech Mahindra
- VMware (Tanzu)
- Wipro Ltd.
- Canonical Ltd.
- HashiCorp
Additional Benefits:
- The market estimate (ME) sheet in Excel format
- 3 months of analyst support
TABLE OF CONTENTS
1 INTRODUCTION
- 1.1 Study Assumptions and Market Definition
- 1.2 Scope of the Study
2 RESEARCH METHODOLOGY
3 EXECUTIVE SUMMARY
4 MARKET LANDSCAPE
- 4.1 Market Overview
- 4.2 Market Drivers
- 4.2.1 Reduced cost of ownership and time-to-market
- 4.2.2 Interoperability and customisation flexibility
- 4.2.3 Cloud-native and DevOps adoption surge
- 4.2.4 Enterprise digital-transformation budgets
- 4.2.5 EU Digital Markets Act-driven open standards push
- 4.2.6 Sustainability-led vendor-lock-in avoidance
- 4.3 Market Restraints
- 4.3.1 Security and vulnerability concerns
- 4.3.2 Scarcity of skilled open-source talent
- 4.3.3 Licence-compliance complexity
- 4.3.4 Risk of community project abandonment
- 4.4 Value Chain Analysis
- 4.5 Regulatory Landscape
- 4.6 Technological Outlook
- 4.7 Porter's Five Forces Analysis
- 4.7.1 Bargaining Power of Suppliers
- 4.7.2 Bargaining Power of Buyers
- 4.7.3 Threat of New Entrants
- 4.7.4 Threat of Substitutes
- 4.7.5 Intensity of Competitive Rivalry
5 MARKET SIZE AND GROWTH FORECASTS (VALUE)
- 5.1 By Service Type
- 5.1.1 Consulting and Implementation
- 5.1.2 Support, Maintenance and Management
- 5.1.3 Managed Services
- 5.1.4 Training and Certification
- 5.2 By Deployment Mode
- 5.2.1 On-premise
- 5.2.2 Cloud
- 5.3 By Application
- 5.3.1 Infrastructure Management
- 5.3.2 Application Development and Integration
- 5.3.3 Data Management and Analytics
- 5.3.4 Security and Compliance
- 5.4 By End-user Industry
- 5.4.1 Banking, Financial Services and Insurance (BFSI)
- 5.4.2 IT and Telecom
- 5.4.3 Manufacturing
- 5.4.4 Government and Public Sector
- 5.4.5 Healthcare and Life Sciences
- 5.4.6 Other End-user Industries
- 5.5 By Geography
- 5.5.1 North America
- 5.5.1.1 United States
- 5.5.1.2 Canada
- 5.5.1.3 Mexico
- 5.5.2 Europe
- 5.5.2.1 Germany
- 5.5.2.2 United Kingdom
- 5.5.2.3 France
- 5.5.2.4 Italy
- 5.5.2.5 Spain
- 5.5.2.6 Rest of Europe
- 5.5.3 Asia-Pacific
- 5.5.3.1 China
- 5.5.3.2 Japan
- 5.5.3.3 India
- 5.5.3.4 South Korea
- 5.5.3.5 Australia
- 5.5.3.6 Rest of Asia-Pacific
- 5.5.4 South America
- 5.5.4.1 Brazil
- 5.5.4.2 Argentina
- 5.5.4.3 Rest of South America
- 5.5.5 Middle East and Africa
- 5.5.5.1 Middle East
- 5.5.5.1.1 Saudi Arabia
- 5.5.5.1.2 United Arab Emirates
- 5.5.5.1.3 Turkey
- 5.5.5.1.4 Rest of Middle East
- 5.5.5.2 Africa
- 5.5.5.2.1 South Africa
- 5.5.5.2.2 Egypt
- 5.5.5.2.3 Nigeria
- 5.5.5.2.4 Rest of Africa
- 5.5.5.1 Middle East
- 5.5.1 North America
6 COMPETITIVE LANDSCAPE
- 6.1 Market Concentration
- 6.2 Strategic Moves
- 6.3 Market Share Analysis
- 6.4 Company Profiles (includes Global level Overview, Market level overview, Core Segments, Financials as available, Strategic Information, Market Rank/Share, Products and Services, Recent Developments)
- 6.4.1 Accenture plc
- 6.4.2 Atos SE
- 6.4.3 AWS (Amazon Web Services)
- 6.4.4 Cisco Systems Inc.
- 6.4.5 Deloitte
- 6.4.6 Google LLC
- 6.4.7 HCL Technologies
- 6.4.8 Hewlett Packard Enterprise
- 6.4.9 IBM Corporation
- 6.4.10 Infosys Ltd.
- 6.4.11 NTT Data
- 6.4.12 Oracle Corporation
- 6.4.13 Red Hat Inc.
- 6.4.14 SUSE
- 6.4.15 Tata Consultancy Services (TCS)
- 6.4.16 Tech Mahindra
- 6.4.17 VMware (Tanzu)
- 6.4.18 Wipro Ltd.
- 6.4.19 Canonical Ltd.
- 6.4.20 HashiCorp
7 MARKET OPPORTUNITIES AND FUTURE OUTLOOK
- 7.1 White-space and Unmet-need Assessment

 社群平台市場規模、佔有率和成長分析:按平台類型、部署方式、組織規模、最終用戶、定價模式和地區分類-2026-2033年產業預測
 開放原始碼服務市場-2026-2032年全球市場預測
 開放原始碼軟體(OSS) 市場規模、佔有率和成長分析:按類型、部署方式、組織規模、最終用途和地區分類-2026-2033 年產業預測
 開放原始碼服務市場:按最終用戶、服務、行業和地區分類Arduino 相容產品市場:依產品類型、最終用戶、組件、通路和地區分類。
 2026年全球開放原始碼審計市場報告2026年全球開放原始碼巨量資料工具市場報告2026年全球開放原始碼掃描市場報告
 Arduino相容市場分析及至2035年預測:類型、產品類型、服務、技術、組件、應用、最終用戶、模組、功能2026年全球開放原始碼軟體市場報告