


 |
市場調查報告書
商品編碼
2124525
照護現場(POC)資料管理軟體:市場佔有率分析、產業趨勢與統計、成長預測(2026-2031)Point-of-Care Data Management Software - Market Share Analysis, Industry Trends & Statistics, Growth Forecasts (2026 - 2031) |
||||||

※ 本網頁內容可能與最新版本有所差異。詳細情況請與我們聯繫。
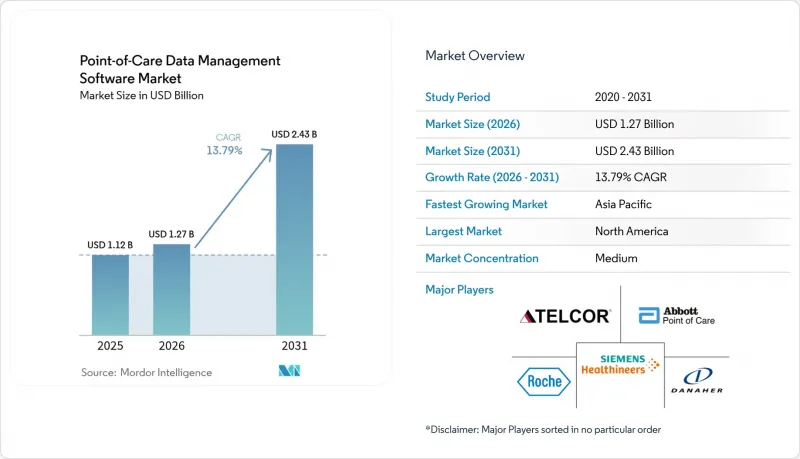
根據 Mordor Intelligence 預測,照護現場(POC) 資料管理軟體的市場規模預計將從 2025 年的 11.2 億美元成長到 2026 年的 12.7 億美元,然後在 2031 年達到 24.3 億美元,2026 年至 2031 年的複合年成長率為 13.9%。
本報告按部署方式(雲端、本地部署、混合部署)、最終用戶(醫院/加護病房、診斷中心、診所/門診部、居家醫療等)、應用領域(感染疾病診斷設備、血糖監測等)、組件(軟體平台、服務)和地區進行細分。市場預測以美元計價。
全球照護現場檢測(POC)資料管理軟體市場趨勢與洞察
靈活連接方法和介面解決方案的創新
醫療保健系統需要可互通的中間件,透過標準化的 FHIR R4 API 連接 200 多種不同的照護現場(POC) 裝置。此功能由美國醫療保險和醫療補助服務中心 (CMS) 的互通性和病患存取規則所驅動。供應商現在將連接性視為核心基礎設施,而非僅僅是附加功能,以避免數據孤島並加速臨床決策。 5G 和邊緣運算節點的出現降低了雲端原生部署的延遲,使擁有多個地點的營運商能夠整合跨分散式設施的工作流程。美國食品藥物管理局 (FDA) 的數位健康軟體預核准計畫進一步強調了連接性的重要性,將其納入監管審查,從而獎勵持續的性能監控。因此,買方在簽訂合約時,現在優先考慮中間件功能的深度和麵向未來的介面藍圖。
擴大醫療基礎設施預算
2024年,全球各國政府在醫療基礎設施項目上投資了2000億美元,其中相當一部分資金被分配給了包括照護現場(POC)數據管理軟體在內的數位平台。諸如印度的國家數位健康使命和中國的「健康中國2030」等項目正在將預算轉向IT現代化,這為能夠滿足各國數據本地化法規的供應商創造了新的機會。官民合作關係擴大將軟體條款納入建設項目競標中,有效地將以前可選的技術變成了強制性要求。隨著新醫院和診斷中心的運作,為基於價值的醫療保健儀錶板提供數據的分析套件也成為標配,從而確保軟體採購與設施建設進度保持一致。這種支出激增正在擴大中等收入國家的潛在基本客群,並透過長期維護合約來穩定供應商的收入前景。
高昂的實施和整合成本
全面部署的成本可能在每個醫療機構 50 萬至 200 萬美元之間,這對於 IT 人員空缺率高達 40% 的小規模和鄉村醫院而言,無疑是一大障礙。舊有系統的不一致增加了介面編碼和工作流程重新設計的負擔,往往導致工期超出預算週期。如果將年度維護費、員工培訓費和升級訂閱費也計算在內,總擁有成本還會進一步增加。對於患者數量較少的醫療機構而言,投資回報模式仍然脆弱,這促使它們轉向採用 SaaS 模式並依賴津貼分級收費的方案。能夠以低部署價格提供模組化雲端託管服務的供應商可以刺激潛在需求,並抵消複合年成長率放緩的影響。
細分市場分析
即使到了2025年,本地部署仍將佔總收入的51.62%,這顯示內部伺服器在直接資料管理方面有著舉足輕重的地位。然而,雲端解決方案正以15.88%的複合年成長率快速成長,這主要得益於其強大的災害復原能力、自動修補程式和彈性儲存等優勢。混合部署方案正在彌合轉型過程中的差距。許多系統正在將分析處理遷移到符合HIPAA標準的雲端,同時將對延遲敏感的模組保留在本地。擁有多個辦公地點的連鎖企業正在強調以雲端為中心的儀表板,這些儀表板可以跨園區同步效能指標,並減少冗餘基礎設施。美國食品藥物管理局(FDA)近期發布的指南將經過檢驗的雲端配置視為與本地環境等效,這進一步緩解了資訊長(CIO)的擔憂,並鼓勵企業購買SaaS模式。推遲硬體升級所節省的費用通常用於網路安全升級,從而加快了轉型步伐。
雲端供應商正大力宣傳 FedRAMP 和 HITRUST 認證,以吸引聯邦政府和學術機構客戶,這削弱了傳統本地部署服務商先前享有的領先優勢。此外,勒索軟體威脅日益加劇,異地備份變得至關重要,如今許多雲端服務合約已將其作為標準功能提供。同時,處理基因組數據的研究機構仍依賴本地叢集來最大化計算吞吐量。然而,即使在這些領域,容器化工作負載也能在高峰需求期間為雲端提供突發容量,預示著未來邊界模糊的混合架構將成為主流。隨著時間的推移,基於服務的定價模式已將服務商的關注點從永久許可轉向以客戶維繫為導向的藍圖,其中包含豐富的 AI 模組和 API 市場,從而使參與生態系統實現盈利。
預計到2025年,醫院和加護病房仍將佔據最大佔有率,達到46.15%,這主要得益於急診容量目標和快速提供檢測結果的義務。然而,居家醫療計畫實現了14.71%的複合年成長率,這主要得益於聯邦醫療保險「居家醫院」計畫的擴展以及人口老化的趨勢。攜帶式分析儀和遠端醫療工具包的普及,推動了對輕量級、基於瀏覽器的控制面板的需求,以便看護者能夠在家中存取患者資訊。診斷中心正在整合自動化檢驗規則以應對激增的檢體量,而診所則在固定費率支付模式下利用照護現場(POC)數據來縮短就診週期。
居家醫療服務提供者正努力應對不穩定的寬頻連線品質問題,因此對「存轉」架構的興趣日益濃厚,這種架構能夠在連線恢復後同步資料。醫院持續投資於全公司範圍的中間件,以檢測品管偏差並整合試劑庫存數據,從而提高供應鏈效率。門診診所正在採用共用服務模式,透過授權使用集中式分析工具,同時維持對本地醫療設備池的自主管理。 「其他」類別(涵蓋長期照護和職業健康機構)正在不斷擴展,這催生了對適用於非醫院工作流程的模組化使用者介面的需求,並拓寬了目標收入來源。
區域分析
預計到2025年,北美將維持38.21%的市場佔有率,這得益於美國國立衛生研究院(NIH)的津貼、生物醫學高級研究與發展局(BARDA)的DRIVe計畫以及成熟的電子健康記錄(EHR)普及率。美國醫院正在部署分析工具以滿足聯邦醫療保險優勢計劃(Medicare Advantage)的品質指標,而加拿大各省的醫療系統則在投資改善對依賴中間件互通性的本地醫療服務的訪問。隨著創業投資的湧入和可預測的FDA核准流程,該地區正成為人工智慧密集型模組的試驗場,為供應商提供早期回饋。
亞太地區預計將以16.52%的複合年成長率成長,成為全球成長最快的地區。中國150億美元的醫療數位化預算正被投入到渴望部署雲端資料看板的省級醫院。印度的「阿尤斯曼·巴拉特數位醫療計畫」(Ayushman Bharat Digital Mission)正在推動互通性,並引導採購者選擇符合標準的軟體。日本正利用「社會5.0」理念支持一項老年護理試點項目,該項目將家庭監測設備與集中式分析相結合。新加坡正發揮區域部署中心的作用,向東南亞輸出專業知識。監管環境的多樣性使得擁有靈活的資料主權設定能力和多語言介面的平台更具優勢。
在歐洲,我們看到在主導的推動下,數位化技術正穩步普及。德國的《數位健康法案》為醫院的IT現代化提供資金,而英國的NHS數位化宣傳活動則推動所有急診信託機構向通用互通性標準過渡。法國和西班牙正在利用歐盟復甦基金實現遠端醫療和檢查室IT的現代化。嚴格的GDPR(一般資料保護規則)要求採用標準化的同意管理和加密功能,雖然延長了引進週期,但也提高了可靠性。擁有預先檢驗的合規模板的供應商在競標中更具優勢。南美洲以及中東和非洲的市場佔有率落後於歐洲,但隨著公私合作基礎建設從一開始就強制引入數位化工具包,這些地區的成長率也達到了15%左右。
其他好處:
- Excel格式的市場預測(ME)表
- 3個月的分析師支持
目錄
第1章:引言
- 市場分析與定義的前提條件
- 分析範圍
第2章 分析方法
第3章執行摘要
第4章 市場狀況
- 市場概覽
- 市場促進因素
- 靈活連接方法和介面解決方案的創新
- 擴大醫療基礎設施預算
- 政府資助即時檢測
- 支付方式向績效薪酬轉變
- 人工智慧驅動的合理抗生素使用分析模組
- 加強網路安全合規要求
- 市場限制因素
- 高昂的實施和整合成本
- 資料隱私和網路安全威脅
- 碎片化的傳統設備韌體系統
- 本地設施缺乏熟練的IT人員
- 宏觀經濟因素的影響
- 產業價值鏈分析
- 監理情勢
- 技術展望
- 波特五力分析
第5章:預測市場規模與成長率
- 透過部署方法
- 基於雲端的
- 現場
- 混合
- 最終用戶
- 醫院/加護病房
- 診斷中心
- 門診/診所
- 居家醫療
- 其他最終用戶
- 透過使用
- 感染疾病醫療設備
- 血糖監測
- 凝血監測
- 尿液檢查
- 心臟代謝監測
- 癌症標記
- 血液學
- 其他概念驗證應用
- 按組件
- 軟體平台
- 中介軟體
- 服務
- 按地區
- 北美洲
- 美國
- 加拿大
- 墨西哥
- 歐洲
- 英國
- 德國
- 法國
- 義大利
- 其他歐洲國家
- 亞太地區
- 中國
- 日本
- 印度
- 韓國
- 其他亞洲國家
- 中東
- 以色列
- 沙烏地阿拉伯
- 阿拉伯聯合大公國
- 土耳其
- 其他中東國家
- 非洲
- 南非
- 埃及
- 其他非洲國家
- 南美洲
- 巴西
- 阿根廷
- 其他南美國家
- 北美洲
第6章 競爭情勢
- 市場集中度
- 策略趨勢
- 市佔率分析
- 公司簡介
- Siemens Healthineers AG(Conworx)
- Abbott Point of Care Inc.(Alere Inc.)
- Danaher Corporation(HemoCue AB and Radiometer Medical ApS)
- F. Hoffmann-La Roche Ltd
- TELCOR Inc.
- Orchard Software Corporation
- Randox Laboratories Ltd
- Thermo Fisher Scientific Inc.
- EKF Diagnostics Holdings plc
- HORIBA Ltd
- Nova Biomedical Corporation
- Sysmex Corporation
- Werfen SA
- Alcor Scientific Inc.
- PTS Diagnostics LLC
- Masimo Corporation
- Becton, Dickinson and Company
- Beckman Coulter Inc.
- Medtronic plc
第7章 市場機會與未來展望
According to Mordor Intelligence, the point-of-care data management software market size is expected to grow from USD 1.12 billion in 2025 to USD 1.27 billion in 2026 and is forecast to reach USD 2.43 billion by 2031 at 13.79% CAGR over 2026-2031.
This report is Segmented by Deployment Mode (Cloud-Based, On-Premise, and Hybrid), End User (Hospitals/Critical Care Units, Diagnostic Centers, Clinics/Outpatient, Home Healthcare, and More), Application (Infectious Disease Devices, Glucose Monitoring, and More), Component (Software Platform, and Services), and Geography. The Market Forecasts are Provided in Terms of Value (USD).
Global Point-of-Care Data Management Software Market Trends and Insights
Innovation in Flexible Connectivity and Interface Solutions
Health systems are demanding interoperable middleware that links more than 200 distinct point-of-care devices through standardized FHIR R4 APIs, a capability spurred by CMS's Interoperability and Patient Access Rule. Vendors now treat connectivity as core infrastructure, not add-on code, to avoid data silos and accelerate clinical decision-making. The arrival of 5G and edge-computing nodes cuts latency for cloud-native deployments, letting multi-site operators harmonize workflows across dispersed facilities. FDA's Digital Health Software Precertification Program further elevates connectivity by embedding it in regulatory review, creating an incentive for continuous performance monitoring. As a result, buyers prioritize middleware depth and future-proof interface roadmaps when awarding contracts.
Expansion of Healthcare Infrastructure Budgets
Governments spent USD 200 billion on health-infrastructure projects in 2024, earmarking sizable funds for digital platforms that include point-of-care data management software. Programs like India's National Digital Health Mission and China's Healthy China 2030 channel budget toward IT modernization, opening doors for vendors able to meet country-specific data-localization rules. Private-public partnerships often bundle software clauses into construction tenders, effectively converting optional tech into mandatory kit. As new hospitals and diagnostic centers go live, they specify analytics suites that feed value-based care dashboards, ensuring software procurement aligns with bricks-and-mortar schedules. This spends surge enlarges the addressable base in mid-income economies and smooths revenue visibility for suppliers through long-term maintenance deals.
High Deployment and Integration Costs
Comprehensive rollouts cost USD 500,000-USD 2 million per facility, a hurdle that stalls adoption in smaller or rural hospitals where 40% of IT posts sit vacant. Legacy-system heterogeneity inflates interface coding and workflow redesign, often stretching timelines past budget cycles. Total cost of ownership widens when annual maintenance, staff training, and upgrade subscriptions enter the calculus. For facilities with thin patient volumes, payback models remain weak, nudging them toward grant funding or SaaS options with phased billing. Vendors able to package modular, cloud-hosted offerings at lower entry prices can unlock pent-up demand and counter this drag on CAGR.
Other drivers and restraints analyzed in the detailed report include:
- Government Funding Initiatives for POC Testing
- Data Privacy and Cybersecurity Threats
For complete list of drivers and restraints, kindly check the Table Of Contents.
Segment Analysis
On-premises deployments still commanded 51.62% revenue in 2025, showing the historical sway of in-house servers for direct data custody. Yet cloud solutions are sprinting at a 15.88% CAGR, fuelled by robust disaster-recovery, auto-patching, and elastic storage benefits. A hybrid approach acts as a transition bridge: many systems keep latency-sensitive modules on-site while pushing analytics to HIPAA-compliant clouds. Multi-site chains prize cloud-centric dashboards that synchronize performance metrics across campuses, trimming duplicated infrastructure. FDA's recent guidance equating validated cloud configurations with local installations further eases CIO concerns, nudging purchase orders toward SaaS models. Savings from hardware refresh deferral often finance cybersecurity upgrades, accelerating the migration curve.
Cloud vendors tout FedRAMP and HITRUST credentials to win federal and academic accounts, denting the head-start enjoyed by legacy on-premises incumbents. Rising ransomware threats also make off-site backups imperative, a default feature in many cloud contracts. Conversely, research institutes handling genomic data still lean on local clusters to maximize compute throughput. Even here, containerized workloads permit burst capacity in the cloud during peak demand, showcasing a future where line-blurring hybrid architectures dominate. Over time, service-based pricing shifts vendor focus from perpetual licenses to retention-driven roadmaps rich in AI modules and API marketplaces that monetize ecosystem participation.
Hospitals and critical-care units retained the lion's 46.15% share in 2025, supported by emergency-department throughput targets and lab turnaround mandates. Nevertheless, home-health programs are clocking a 14.71% CAGR, buoyed by Medicare's Hospital-at-Home expansion and aging-population dynamics. Portable analyzers and telehealth kits feed a need for lightweight, browser-based dashboards that caregiver's access from patient residences. Diagnostic centers integrate auto-verification rules to handle ballooning specimen loads while clinics lean on point-of-care data to shorten visit cycles under capitated payment plans.
Home-care operators grapple with variable broadband quality, propelling interest in store-and-forward architecture that syncs when connectivity resumes. Hospitals continue to invest in enterprise-wide middleware that flags quality-control drifts and consolidates reagent inventory data, improving supply chain efficiency. Outpatient clinics adopt shared-service models, licensing centralized analytics but maintaining autonomy over local device pools. The growing "other" category spanning long-term care and occupational-health sites creates opportunities for modular UI skins tailored to non-hospital workflows, widening addressable revenue.
Complete Report Scope:
- By Deployment Mode
- Cloud-Based
- On-Premise
- Hybrid
- By End User
- Hospitals / Critical Care Units
- Diagnostic Centers
- Clinics / Outpatient
- Home Healthcare
- Other End Users
- By Application
- Infectious Disease Devices
- Glucose Monitoring
- Coagulation Monitoring
- Urinalysis
- Cardiometabolic Monitoring
- Cancer Markers
- Hematology
- Other POC Applications
- By Component
- Software Platform
- Middleware
- Services
- By Geography
- North America
- United States
- Canada
- Mexico
- Europe
- United Kingdom
- Germany
- France
- Italy
- Rest of Europe
- Asia-Pacific
- China
- Japan
- India
- South Korea
- Rest of Asia
- Middle East
- Israel
- Saudi Arabia
- United Arab Emirates
- Turkey
- Rest of Middle East
- Africa
- South Africa
- Egypt
- Rest of Africa
- South America
- Brazil
- Argentina
- Rest of South America
- North America
Geography Analysis
North America maintained a 38.21% share in 2025, anchored by NIH grants, BARDA's DRIVe program, and mature EHR penetration. U.S. hospitals deploy analytics to satisfy Medicare Advantage quality metrics, whereas Canada's provincial systems fund rural-access upgrades that hinge on middleware interoperability. Venture capital flows and predictable FDA pathways make the region a test bed for AI-rich modules, giving suppliers early feedback loops.
Asia Pacific is set to compound at 16.52% CAGR, the fastest worldwide. China's USD 15 billion health-digitization budget funnels into county-level hospitals eager for cloud-hosted dashboards. India's Ayushman Bharat Digital Mission enforces interoperability, nudging buyers toward standards-compliant software. Japan leverages Society 5.0 to back aging-care pilots that marry home-monitoring kits with centralized analytics. Singapore acts as the regional deployment hub, exporting expertise across Southeast Asia. The mosaic of regulations rewards platforms sporting flexible data-sovereignty toggles and multilingual interfaces.
Europe exhibits steady, regulation-driven uptake. Germany's Digital Healthcare Act finances hospital IT overhauls, while the United Kingdom's NHS Digital campaign pushes all acute trusts onto a shared interoperability standard. France and Spain tap EU Recovery funds for telemedicine and lab IT modernization. Strict GDPR rules require baked-in consent management and encryption, extending deployment cycles but enhancing trust. Suppliers that pre-validate compliance templates gain bidding advantages. South America, the Middle East, and Africa trail in share but post mid-teens growth as public-private buildouts stipulates digital kits from the outset.
- Siemens Healthineers AG (Conworx)
- Abbott Point of Care Inc. (Alere Inc.)
- Danaher Corporation (HemoCue AB and Radiometer Medical ApS)
- F. Hoffmann-La Roche Ltd
- TELCOR Inc.
- Orchard Software Corporation
- Randox Laboratories Ltd
- Thermo Fisher Scientific Inc.
- EKF Diagnostics Holdings plc
- HORIBA Ltd
- Nova Biomedical Corporation
- Sysmex Corporation
- Werfen S.A.
- Alcor Scientific Inc.
- PTS Diagnostics LLC
- Masimo Corporation
- Becton, Dickinson and Company
- Beckman Coulter Inc.
- Medtronic plc
Additional Benefits:
- The market estimate (ME) sheet in Excel format
- 3 months of analyst support
TABLE OF CONTENTS
1 INTRODUCTION
- 1.1 Study Assumptions and Market Definition
- 1.2 Scope of the Study
2 RESEARCH METHODOLOGY
3 EXECUTIVE SUMMARY
4 MARKET LANDSCAPE
- 4.1 Market Overview
- 4.2 Market Drivers
- 4.2.1 Innovation in Flexible Connectivity and Interface Solutions
- 4.2.2 Expansion of Healthcare Infrastructure Budgets
- 4.2.3 Government Funding Initiatives for POC Testing
- 4.2.4 Payor Shift Toward Outcome-Based Reimbursement
- 4.2.5 AI-Driven Analytics Modules for Antimicrobial Stewardship
- 4.2.6 Growing Cybersecurity Compliance Requirements
- 4.3 Market Restraints
- 4.3.1 High Deployment and Integration Costs
- 4.3.2 Data Privacy and Cybersecurity Threats
- 4.3.3 Fragmented Legacy Device Firmware Ecosystem
- 4.3.4 Shortage of Skilled IT Staff in Rural Facilities
- 4.4 Impact of Macroeconomic Factors
- 4.5 Industry Value-Chain Analysis
- 4.6 Regulatory Landscape
- 4.7 Technological Outlook
- 4.8 Porter's Five Forces Analysis
- 4.8.1 Bargaining Power of Suppliers
- 4.8.2 Bargaining Power of Buyers
- 4.8.3 Threat of New Entrants
- 4.8.4 Threat of Substitutes
- 4.8.5 Intensity of Competitive Rivalry
5 MARKET SIZE AND GROWTH FORECASTS (VALUE)
- 5.1 By Deployment Mode
- 5.1.1 Cloud-Based
- 5.1.2 On-Premise
- 5.1.3 Hybrid
- 5.2 By End User
- 5.2.1 Hospitals / Critical Care Units
- 5.2.2 Diagnostic Centers
- 5.2.3 Clinics / Outpatient
- 5.2.4 Home Healthcare
- 5.2.5 Other End Users
- 5.3 By Application
- 5.3.1 Infectious Disease Devices
- 5.3.2 Glucose Monitoring
- 5.3.3 Coagulation Monitoring
- 5.3.4 Urinalysis
- 5.3.5 Cardiometabolic Monitoring
- 5.3.6 Cancer Markers
- 5.3.7 Hematology
- 5.3.8 Other POC Applications
- 5.4 By Component
- 5.4.1 Software Platform
- 5.4.2 Middleware
- 5.4.3 Services
- 5.5 By Geography
- 5.5.1 North America
- 5.5.1.1 United States
- 5.5.1.2 Canada
- 5.5.1.3 Mexico
- 5.5.2 Europe
- 5.5.2.1 United Kingdom
- 5.5.2.2 Germany
- 5.5.2.3 France
- 5.5.2.4 Italy
- 5.5.2.5 Rest of Europe
- 5.5.3 Asia-Pacific
- 5.5.3.1 China
- 5.5.3.2 Japan
- 5.5.3.3 India
- 5.5.3.4 South Korea
- 5.5.3.5 Rest of Asia
- 5.5.4 Middle East
- 5.5.4.1 Israel
- 5.5.4.2 Saudi Arabia
- 5.5.4.3 United Arab Emirates
- 5.5.4.4 Turkey
- 5.5.4.5 Rest of Middle East
- 5.5.5 Africa
- 5.5.5.1 South Africa
- 5.5.5.2 Egypt
- 5.5.5.3 Rest of Africa
- 5.5.6 South America
- 5.5.6.1 Brazil
- 5.5.6.2 Argentina
- 5.5.6.3 Rest of South America
- 5.5.1 North America
6 COMPETITIVE LANDSCAPE
- 6.1 Market Concentration
- 6.2 Strategic Moves
- 6.3 Market Share Analysis
- 6.4 Company Profiles {(includes Global level Overview, Market level overview, Core Segments, Financials as available, Strategic Information, Market Rank / Share for key companies, Products and Services, and Recent Developments)}
- 6.4.1 Siemens Healthineers AG (Conworx)
- 6.4.2 Abbott Point of Care Inc. (Alere Inc.)
- 6.4.3 Danaher Corporation (HemoCue AB and Radiometer Medical ApS)
- 6.4.4 F. Hoffmann-La Roche Ltd
- 6.4.5 TELCOR Inc.
- 6.4.6 Orchard Software Corporation
- 6.4.7 Randox Laboratories Ltd
- 6.4.8 Thermo Fisher Scientific Inc.
- 6.4.9 EKF Diagnostics Holdings plc
- 6.4.10 HORIBA Ltd
- 6.4.11 Nova Biomedical Corporation
- 6.4.12 Sysmex Corporation
- 6.4.13 Werfen S.A.
- 6.4.14 Alcor Scientific Inc.
- 6.4.15 PTS Diagnostics LLC
- 6.4.16 Masimo Corporation
- 6.4.17 Becton, Dickinson and Company
- 6.4.18 Beckman Coulter Inc.
- 6.4.19 Medtronic plc
7 MARKET OPPORTUNITIES AND FUTURE OUTLOOK
- 7.1 White-Space and Unmet-Need Assessment

 用於下一代機器人感知和自主系統的多模態感測器融合
 2026年全球戰場資料融合系統市場報告2026年全球數據融合市場報告
 資料遷移市場預測至 2034 年—按遷移類型、部署模式、組織規模、企業應用、最終用戶和地區分類的全球分析
 床邊資料管理軟體市場規模、佔有率、趨勢和預測:按產品、應用、最終用戶和地區分類,2026-2034 年
 資料融合市場:2026年至2032年全球市場預測(依組件、業務功能、通路、部署類型、組織規模及最終用戶產業分類)資料遷移市場:按元件、資料類型、部署模式、產業和組織規模分類 - 全球預測(2026-2032 年)
 2035年床邊資料管理軟體市場分析及預測:按類型、產品類型、服務、技術、組件、應用、部署類型、最終用戶和功能分類資料遷移市場分析及預測(至 2035 年):按類型、產品類型、服務、技術、元件、應用、部署類型、最終使用者、流程和解決方案分類全球資料融合市場規模、佔有率、趨勢和成長分析報告(2026-2034年)