


 |
市場調查報告書
商品編碼
2124516
持續整合(CI)工具:市場佔有率分析、產業趨勢與統計、成長預測(2026-2031)Continuous Integration Tools - Market Share Analysis, Industry Trends & Statistics, Growth Forecasts (2026 - 2031) |
||||||

※ 本網頁內容可能與最新版本有所差異。詳細情況請與我們聯繫。
據 Mordor Intelligence 稱,2025 年持續整合 (CI) 工具市值為 17.3 億美元,預計到 2031 年將從 2026 年的 20.9 億美元成長至 53.6 億美元,預測期(2026-2031 年)的複合年成長率為 20.72%。
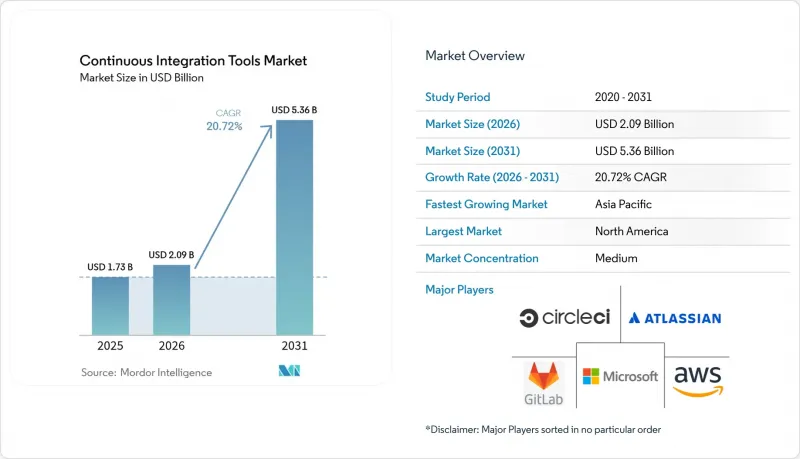
本報告按部署方式(本地部署、雲端原生SaaS、混合部署)、組織規模(大型企業、中小企業)、最終用戶產業(IT與電信、銀行、金融服務和保險、零售與電子商務等)、採用階段(建置自動化、測試自動化、發布與實施等)以及地區進行細分。市場預測以美元(USD)計價。
全球持續整合 (CI) 工具市場趨勢與洞察
需要提高 DevOps 的採用率並縮短發布週期。
為了追趕每天執行數十次配置的雲端原生競爭對手,企業正在重組其交付流程。 IBM 2024 年的一項調查顯示,83% 的高階主管將現代化列為首要任務,但只有 27% 的企業完成了遷移。這種執行差距促使企業持續投資於能夠將建置、測試和部署整合到單一自動化工作流程中的平台。整合工具鏈減少了交接環節,並消除了由獨立解決方案造成的延遲。因此,提供整合套件的供應商正在逐步取代持續整合 (CI) 工具市場中的標準伺服器。
雲端原生軟體開發的興起
預計到 2025 年,全球雲端原生應用程式總數將達到 7.5 億。容器化微服務需要能夠編配並行建置、動態測試環境和 GitOps 式部署的 CI/CD 管線。傳統的自架 Jenkins 等解決方案依賴插件來滿足這些需求,從而增加了維護負擔。因此,企業正傾向於採用具有原生 Kubernetes 整合和多重雲端功能的解決方案,推動持續整合 (CI) 工具市場採用混合模式和 SaaS 模式。
缺乏 CI/CD 平台工程技能
能夠編寫管線腳本、保護 Kubernetes叢集以及管理 GitOps 部署的人才需求遠超供給,導致招募延遲和諮詢成本飆升。這種人才短缺增加了整體擁有成本 (TCO),並延緩了部署進度。供應商正在透過提供低程式碼管線設計器和託管服務來應對這項挑戰,從而減少對內部專業知識的依賴。然而,人才短缺仍然是阻礙在複雜的企業環境中快速部署持續整合 (CI) 工具的因素。
細分市場分析
雲端原生 SaaS 的普及透過消除基礎設施維護和加速用戶上線,持續創造收入。同時,混合雲的普及預計將以 15.52% 的複合年成長率 (CAGR) 實現最高成長,凸顯了受監管買家對敏感工作負載進行本地控制的需求。隨著供應商部署符合 NIST SP 800-204D 零信任建議的彈性部署方案,混合雲端部署的持續整合 (CI) 工具市場預計將快速擴張。採用私有代理執行和客戶管理加密金鑰的 SaaS 供應商在解決合規性障礙的同時,也保留了最初推動雲端普及的易用性優勢。
企業正擴大採用「兩全其美」的策略,即在本地部署建置工作進程,同時利用雲端控制面板進行視覺化和分析。這種架構既能限制資料洩露,又能保持彈性擴展以應對突發工作負載,這種平衡在持續整合 (CI) 工具市場引起了廣泛關注。能夠跨環境同步工件儲存、金鑰管理和策略執行的供應商正成為首選合作夥伴。
目前,大型企業佔據了60.58%的收入佔有率,這反映了它們在DevOps成熟度和資源可用性方面的歷史領先地位。然而,由於付費使用制和免費增值模式的經濟實惠,中小企業(SME)的持續整合(CI)工具市場規模正在迅速擴大。 CircleCI的入門級方案(每用戶360美元)表明,新創公司可以輕鬆入門。隨著中小企業規模的擴大,使用時長自然會增加,進而提升供應商的經常性收入。
這種民主化趨勢正在擴大基本客群,並促使供應商利用專有範本、自動化管治和內建安全掃描來簡化客戶匯入流程。這些改進也使尋求降低內部成本的大型企業受益,從而形成良性循環,推動持續整合 (CI) 工具市場的擴張。
區域分析
北美地區佔總收入的36.05%,這主要得益於其較高的DevOps滲透率、創業投資以及國防採購(目前國防採購強制要求提交SBOM報告)。美國企業傾向於選擇整合持續整合(CI)、持續交付(CD)、安全掃描和基礎設施配置等功能的綜合套件,這推動了持續整合(CI)工具市場的平台整合。預計加拿大和墨西哥將透過近岸外包計畫和中型製造商採用雲端技術實現進一步成長。
亞太地區預計將成為成長最快的地區,複合年成長率將達到14.32%。印度、韓國和新加坡的政府獎勵正在津貼雲端遷移,而資料本地化法規則鼓勵買家選擇混合部署。在中國,私有雲端上的AI模型更受歡迎,與透過託管控制平面管理的本地運行程序一致,這為柔軟性的供應商創造了新的機會。此外,印度電腦緊急應變小組(CERT-In)的2024年SBOM(系統行為目標手冊)指令也推動了印度對合規自動化的需求。
在歐洲,受《一般資料保護規範》(GDPR) 和即將到來的《歐盟網路彈性法案》的推動,市場保持著穩定成長的勢頭。這兩項法規都提高了供應鏈的安全要求。買家正在評估能夠保證資料居住並產生自動審計追蹤的解決方案,並將預算分配給擁有區域託管和加密認證的供應商。德國、法國和英國仍然是最大的市場貢獻者,而斯堪地那維亞和東歐國家對持續整合 (CI) 工具的需求也在不斷成長。
其他好處:
- Excel格式的市場預測(ME)表
- 3個月的分析師支持
目錄
第1章:引言
- 市場分析與定義的前提條件
- 分析範圍
第2章 分析方法
第3章執行摘要
第4章 市場狀況
- 市場概覽
- 市場促進因素
- DevOps 的日益普及和對更短發布週期的需求不斷成長
- 雲端原生軟體開發的興起
- 遠距/混合辦公模式的擴展
- 透過人工智慧驅動的編碼整合提高建置頻率
- 左移安全(DevSecOps)的要求
- 開放原始碼元件供應鏈中的安全性問題
- 市場限制因素
- 缺乏 CI/CD 平台工程技能
- 傳統工具鏈的複雜性與遷移成本
- 加強對雲端支出(FinOps)的監控
- SaaS CI 中的監管資料主權挑戰
- 產業生態系統分析
- 監理情勢
- 技術展望
- 波特五力分析
第5章:預測市場規模與成長率
- 透過部署方法
- 現場
- 雲端原生SaaS
- 混合
- 按最終用戶公司規模分類
- 大公司
- 中小企業
- 按應用階段
- 建立自動化
- 測試自動化
- 發布與實施
- 監測和回饋
- 按最終用戶行業分類
- 資訊科技/通訊
- 銀行、金融服務和保險業 (BFSI)
- 零售與電子商務
- 醫學與生命科學
- 媒體與娛樂
- 教育
- 製造業
- 政府/公共部門
- 按地區
- 北美洲
- 美國
- 加拿大
- 墨西哥
- 歐洲
- 德國
- 英國
- 法國
- 俄羅斯
- 其他歐洲國家
- 亞太地區
- 中國
- 日本
- 印度
- 韓國
- 澳洲
- 其他亞太國家
- 中東和非洲
- 中東
- 沙烏地阿拉伯
- 阿拉伯聯合大公國
- 其他中東國家
- 非洲
- 南非
- 埃及
- 其他非洲國家
- 中東
- 南美洲
- 巴西
- 阿根廷
- 其他南美國家
- 北美洲
第6章 競爭情勢
- 市場集中度
- 策略趨勢
- 市佔率分析
- 公司簡介
- Atlassian Corporation Plc
- Amazon Web Services, Inc.(AWS)
- Microsoft Corporation(Azure DevOps and GitHub)
- GitLab Inc.
- Circle Internet Services, Inc.(CircleCI)
- CloudBees, Inc.
- JetBrains sro
- IBM Corporation
- Micro Focus International Plc(OpenText)
- Buddy Works sp. z oo sp. k.
- Thoughtworks, Inc.
- Travis CI GmbH
- CodeShip GmbH
- Bitrise Ltd.
- Harness Inc.
- Buildkite Pty Ltd.
- Semaphore(Rendered Text doo)
- Drone.io(Harness)
- AppVeyor Systems Inc.
- SUSE LLC(Rancher Pipelines)
第7章 市場機會與未來展望
According to Mordor Intelligence, the continuous integration tools market size was valued at USD 1.73 billion in 2025 and estimated to grow from USD 2.09 billion in 2026 to reach USD 5.36 billion by 2031, at a CAGR of 20.72% during the forecast period (2026-2031).
This report is Segmented by Deployment Type (On-Premise, Cloud-Native SaaS, and Hybrid), Organization Size (Large Enterprise, and Small and Medium Enterprise), End-User Industry (IT and Telecom, BFSI, Retail and E-Commerce, and More), Application Stage (Build Automation, Testing Automation, Release and Deployment, and More), and Geography. The Market Forecasts are Provided in Terms of Value (USD).
Global Continuous Integration Tools Market Trends and Insights
Growing DevOps adoption and need for shorter release cycles
Enterprises are rearchitecting their delivery pipelines to match cloud-native competitors that deploy dozens of times a day. An IBM 2024 survey reveals that 83% of executives rank modernization as a top priority, yet only 27% have completed the transition . That execution gap fuels sustained investment in platforms that collapse build, test, and deploy into a single automated workflow. Integrated tool chains also reduce handoffs, eliminating latency caused by point solutions. Consequently, vendors offering consolidated suites are steadily displacing standard-built servers in the continuous integration tools market.
Rising cloud-native software development
The global stock of cloud-native applications is expected to hit 750 million by 2025. Containerized microservices require CI/CD pipelines that can orchestrate concurrent builds, dynamic test environments, and GitOps-style deployments. Legacy solutions, such as self-hosted Jenkins, rely on plugins to meet those needs, creating additional maintenance overhead. Enterprises therefore gravitate toward offerings with native Kubernetes integration and multi-cloud support, reinforcing hybrid and SaaS models inside the continuous integration tools market.
Skill shortages in CI/CD platform engineering
The demand for personnel who can script pipelines, secure Kubernetes clusters, and manage GitOps deployments exceeds the supply, driving hiring delays and increased consulting fees. The scarcity elevates the total cost of ownership and slows adoption timelines. Vendors respond with low-code pipeline designers and managed services that reduce the need for in-house expertise. Still, the talent gap hinders the adoption velocity of continuous integration tools in complex enterprise environments.
Other drivers and restraints analyzed in the detailed report include:
- AI-assisted coding increases build frequency
- Expansion of remote/hybrid work models
- Legacy toolchain complexity and migration costs
For complete list of drivers and restraints, kindly check the Table Of Contents.
Segment Analysis
Cloud-native SaaS deployment retained revenue as it removes infrastructure maintenance and accelerates onboarding. Hybrid deployment, however, is forecast to log the highest 15.52% CAGR, underscoring that regulated buyers want local control over sensitive workloads. The continuous integration tools market size for hybrid implementations is projected to expand sharply as vendors roll out flexible deployment blueprints that mirror zero-trust recommendations from NIST.SP 800-204D. SaaS providers that incorporate private-agent execution or customer-managed encryption keys address compliance barriers without compromising the usability edge that originally drove cloud adoption.
Enterprises increasingly adopt a "best of both" stance, hosting build workers on-premise while leveraging cloud dashboards for visibility and analytics. This architecture limits data egress yet preserves elastic scaling for burst workloads, a balance that resonates within the continuous integration tools market. Vendors able to synchronize artifact stores, secrets management, and policy enforcement across environments are emerging as preferred partners.
Large enterprises currently hold 60.58% revenue share, reflecting their historical lead in DevOps maturity and resource availability. Nonetheless, the continuous integration tools market size attributed to small and medium enterprises is rising quickly due to the affordability of consumption-based pricing and freemium tiers. CircleCI's entry-level plans at USD 360 per seat illustrate low barriers for start-ups. As SMEs scale, they naturally grow usage hours, boosting vendor recurring revenue.
The democratization trend broadens the customer base and pushes vendors to streamline onboarding with opinionated templates, automated governance, and embedded security scanning. Those improvements also benefit large organizations seeking to reduce internal overhead, creating a virtuous cycle that underpins the expansion of the continuous integration tools market.
Complete Report Scope:
- By Deployment Type
- On-premise
- Cloud-native SaaS
- Hybrid
- By End-user Enterprise Size
- Large Enterprises
- Small and Medium Enterprises (SMEs)
- By Application Stage
- Build Automation
- Testing Automation
- Release and Deployment
- Monitoring and Feedback
- By End-User Industry
- IT and Telecom
- BFSI
- Retail and E-commerce
- Healthcare and Life Sciences
- Media and Entertainment
- Education
- Manufacturing
- Government and Public Sector
- By Geography
- North America
- United States
- Canada
- Mexico
- Europe
- Germany
- United Kingdom
- France
- Russia
- Rest of Europe
- Asia-Pacific
- China
- Japan
- India
- South Korea
- Australia
- Rest of Asia-Pacific
- Middle East and Africa
- Middle East
- Saudi Arabia
- United Arab Emirates
- Rest of Middle East
- Africa
- South Africa
- Egypt
- Rest of Africa
- Middle East
- South America
- Brazil
- Argentina
- Rest of South America
- North America
Geography Analysis
North America contributes 36.05% revenue, fueled by deep DevOps penetration, venture capital, and defense procurement that now requires SBOM reporting. U.S. enterprises prefer comprehensive suites that combine CI, CD, security scanning, and infrastructure provisioning, reinforcing platform consolidation in the continuous integration tools market. Canada and Mexico provide supplemental growth through near-shoring initiatives and cloud adoption among mid-sized manufacturers.
The Asia-Pacific region is projected to experience the fastest growth, with a 14.32% CAGR. Government incentives in India, South Korea, and Singapore subsidize cloud migration; however, data-localization laws prompt buyers to opt for hybrid deployments. China's preference for private-cloud AI models aligns with on-premise runners managed from hosted control planes, opening an avenue for flexible vendors. CERT-In's 2024 SBOM mandate likewise drives demand for compliance automation across India.
Europe maintains steady momentum underpinned by GDPR and the forthcoming EU Cyber Resilience Act, both of which elevate supply-chain security requirements. Buyers validate solutions that can guarantee data residency and produce automated audit trails, steering budget toward providers with regional hosting and encryption certificates. Germany, France, and the United Kingdom remain the largest contributors, while Scandinavian and Eastern European countries represent expanding greenfield demand in the continuous integration tools market.
- Atlassian Corporation Plc
- Amazon Web Services, Inc. (AWS)
- Microsoft Corporation (Azure DevOps and GitHub)
- GitLab Inc.
- Circle Internet Services, Inc. (CircleCI)
- CloudBees, Inc.
- JetBrains s.r.o.
- IBM Corporation
- Micro Focus International Plc (OpenText)
- Buddy Works sp. z o.o. sp. k.
- Thoughtworks, Inc.
- Travis CI GmbH
- CodeShip GmbH
- Bitrise Ltd.
- Harness Inc.
- Buildkite Pty Ltd.
- Semaphore (Rendered Text d.o.o.)
- Drone.io (Harness)
- AppVeyor Systems Inc.
- SUSE LLC (Rancher Pipelines)
Additional Benefits:
- The market estimate (ME) sheet in Excel format
- 3 months of analyst support
TABLE OF CONTENTS
1 INTRODUCTION
- 1.1 Study Assumptions and Market Definition
- 1.2 Scope of the Study
2 RESEARCH METHODOLOGY
3 EXECUTIVE SUMMARY
4 MARKET LANDSCAPE
- 4.1 Market Overview
- 4.2 Market Drivers
- 4.2.1 Growing DevOps adoption and need for shorter release cycles
- 4.2.2 Rising cloud-native software development
- 4.2.3 Expansion of remote/hybrid work models
- 4.2.4 Integration of AI-assisted coding increasing build frequenc
- 4.2.5 Shift-left security (DevSecOps) mandates
- 4.2.6 Supply-chain security concerns around open-source components
- 4.3 Market Restraints
- 4.3.1 Skill shortages in CI/CD platform engineering
- 4.3.2 Legacy toolchain complexity and migration costs
- 4.3.3 Escalating cloud expenditure scrutiny (FinOps)
- 4.3.4 Regulatory data-sovereignty hurdles for SaaS CI
- 4.4 Industry Ecosystem Analysis
- 4.5 Regulatory Landscape
- 4.6 Technological Outlook
- 4.7 Porter's Five Forces Analysis
- 4.7.1 Threat of New Entrants
- 4.7.2 Bargaining Power of Buyers
- 4.7.3 Bargaining Power of Suppliers
- 4.7.4 Threat of Substitutes
- 4.7.5 Intensity of Competitive Rivalry
5 MARKET SIZE AND GROWTH FORECASTS (VALUE)
- 5.1 By Deployment Type
- 5.1.1 On-premise
- 5.1.2 Cloud-native SaaS
- 5.1.3 Hybrid
- 5.2 By End-user Enterprise Size
- 5.2.1 Large Enterprises
- 5.2.2 Small and Medium Enterprises (SMEs)
- 5.3 By Application Stage
- 5.3.1 Build Automation
- 5.3.2 Testing Automation
- 5.3.3 Release and Deployment
- 5.3.4 Monitoring and Feedback
- 5.4 By End-User Industry
- 5.4.1 IT and Telecom
- 5.4.2 BFSI
- 5.4.3 Retail and E-commerce
- 5.4.4 Healthcare and Life Sciences
- 5.4.5 Media and Entertainment
- 5.4.6 Education
- 5.4.7 Manufacturing
- 5.4.8 Government and Public Sector
- 5.5 By Geography
- 5.5.1 North America
- 5.5.1.1 United States
- 5.5.1.2 Canada
- 5.5.1.3 Mexico
- 5.5.2 Europe
- 5.5.2.1 Germany
- 5.5.2.2 United Kingdom
- 5.5.2.3 France
- 5.5.2.4 Russia
- 5.5.2.5 Rest of Europe
- 5.5.3 Asia-Pacific
- 5.5.3.1 China
- 5.5.3.2 Japan
- 5.5.3.3 India
- 5.5.3.4 South Korea
- 5.5.3.5 Australia
- 5.5.3.6 Rest of Asia-Pacific
- 5.5.4 Middle East and Africa
- 5.5.4.1 Middle East
- 5.5.4.1.1 Saudi Arabia
- 5.5.4.1.2 United Arab Emirates
- 5.5.4.1.3 Rest of Middle East
- 5.5.4.2 Africa
- 5.5.4.2.1 South Africa
- 5.5.4.2.2 Egypt
- 5.5.4.2.3 Rest of Africa
- 5.5.4.1 Middle East
- 5.5.5 South America
- 5.5.5.1 Brazil
- 5.5.5.2 Argentina
- 5.5.5.3 Rest of South America
- 5.5.1 North America
6 COMPETITIVE LANDSCAPE
- 6.1 Market Concentration
- 6.2 Strategic Moves
- 6.3 Market Share Analysis
- 6.4 Company Profiles {(includes Global level Overview, Market level overview, Core Segments, Financials as available, Strategic Information, Market Rank/Share for key companies, Products and Services, and Recent Developments)}
- 6.4.1 Atlassian Corporation Plc
- 6.4.2 Amazon Web Services, Inc. (AWS)
- 6.4.3 Microsoft Corporation (Azure DevOps and GitHub)
- 6.4.4 GitLab Inc.
- 6.4.5 Circle Internet Services, Inc. (CircleCI)
- 6.4.6 CloudBees, Inc.
- 6.4.7 JetBrains s.r.o.
- 6.4.8 IBM Corporation
- 6.4.9 Micro Focus International Plc (OpenText)
- 6.4.10 Buddy Works sp. z o.o. sp. k.
- 6.4.11 Thoughtworks, Inc.
- 6.4.12 Travis CI GmbH
- 6.4.13 CodeShip GmbH
- 6.4.14 Bitrise Ltd.
- 6.4.15 Harness Inc.
- 6.4.16 Buildkite Pty Ltd.
- 6.4.17 Semaphore (Rendered Text d.o.o.)
- 6.4.18 Drone.io (Harness)
- 6.4.19 AppVeyor Systems Inc.
- 6.4.20 SUSE LLC (Rancher Pipelines)
7 MARKET OPPORTUNITIES and FUTURE OUTLOOK
- 7.1 White-space and Unmet-need Assessment

 持續交付市場:按組件、最終用戶產業、部署模式和組織規模分類 - 2026-2032 年全球預測持續整合工具市場:按工具類型、應用類型、產業、部署模式和組織規模分類 - 全球預測(2026-2032 年)
 2026年全球持續交付市場報告2026年全球持續整合工具市場報告
 持續整合工具市場 - 全球產業規模、佔有率、趨勢、機會及預測(按部署模式、最終用戶產業、組織規模、地區和競爭格局分類,2021-2031 年)
 持續交付市場規模、佔有率和成長分析(按部署類型、組件、組織規模、最終用戶產業和地區分類)-2026-2033年產業預測
 持續整合工具市場預測至 2032 年:按組件、工具類型、部署模型、組織規模、應用、最終用戶和地區進行的全球分析
 持續整合工具市場報告:趨勢、預測與競爭分析(至 2031 年)
 持續交付:市場佔有率分析、產業趨勢與統計、成長預測(2025-2030 年)
 持續交付市場、規模、佔有率、趨勢、行業分析報告:按部署、公司規模、最終用途、地區 - 市場預測,2024-2032 年