


 |
市場調查報告書
商品編碼
2124506
行動學習:市場佔有率分析、產業趨勢與統計、成長預測(2026-2031)Mobile Learning - Market Share Analysis, Industry Trends & Statistics, Growth Forecasts (2026 - 2031) |
||||||

※ 本網頁內容可能與最新版本有所差異。詳細情況請與我們聯繫。
根據 Mordor Intelligence 估計,行動學習市場在 2026 年的價值為 957.7 億美元,預計在預測期(2026-2031 年)內將以 15.89% 的複合年成長率成長,到 2031 年達到 2002.4 億美元。
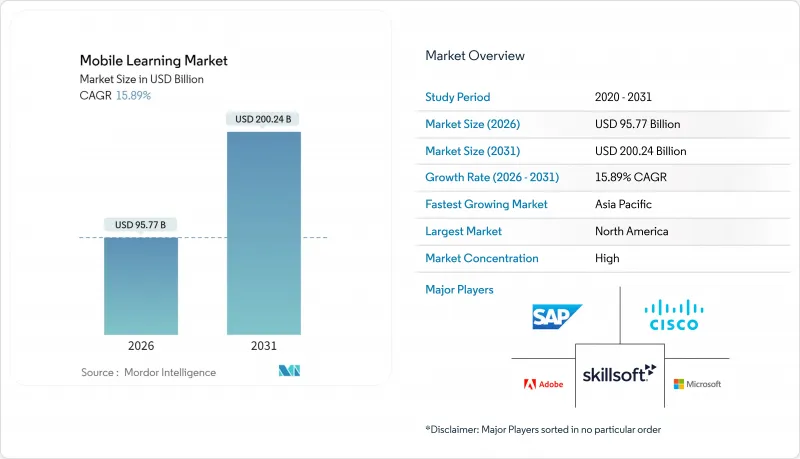
本報告按解決方案(電子書、互動式評估、行動和影片課件等)、應用(課堂學習、企業培訓、模擬學習等)、最終用戶(教育機構、企業)、提供者類型(內容提供者、服務供應商)和地區進行細分。市場預測以美元計價。
全球行動學習市場趨勢與洞察
企業學習與發展(L&D)領域數位化學習解決方案的快速普及;
隨著混合辦公模式在2024年逐漸普及,企業預算也開始轉向行動優先管道。財富500強企業如今已將相當一部分培訓預算分配給智慧型手機相容模組,LinkedIn Learning在2024年高達78%的企業採用率也印證了這一趨勢。與僅限桌面端的課程相比,行動優先課程的完成率和熟練度指標始終更高,從而顯著提升了生產力。將即時學習融入工作流程工具,能夠加速目標達成。此外,一旦平台運作,新增學員的邊際成本幾乎為零,從而實現規模化發展,重新定義競爭優勢。
公司中 BYOD(自備設備辦公)政策的普及
2024年,美國國家標準與技術研究院 (NIST) 發布了分階段的安全指南,加速了自帶設備辦公室 (BYOD) 的普及,並消除了資訊長)的疑慮。員工更傾向在通勤途中使用個人智慧型手機,企業也能因此節省40%至60%的硬體成本。然而,風險正逐漸轉移到網路安全領域,終端漏洞的日益增加迫使企業投資行動威脅防護許可證,平均每位用戶每年需花費15至25美元。儘管增加了安全成本,但自備設備辦公的經濟效益仍然強勁,推動了其更廣泛的應用。
對行動基礎設施的大量初始投資
中型企業平均花費 120 萬至 280 萬美元將行動學習管理系統與其現有的人力資源和身分驗證系統整合。其中近一半的支出用於與舊有系統的整合,而非學習平臺本身。儘管雲端原生供應商提供現成的 API,但客製化流程平均仍需 6 至 9 個月,從而延緩了價值實現的時間。小規模企業往往會推遲採用,或依賴消費級工具,這進一步加劇了與大型企業之間的技能差距。
細分市場分析
行動教育市場預計到2031年將以16.82%的複合年成長率成長,其主要驅動力是企業加速提升桌面課程的行動友善性,而非委託製作成本高昂的新內容。到2025年,以電子書為主導的行動學習市場將佔總收入的30.46%,這表明電子書作為基礎內容形式具有成本效益。現有內容的行動友善度顯著縮短了交付週期,從12個月縮短至3個月,這在當今技術技能五年內就可能過時的時代,無疑是一項決定性優勢。同時,即使在低頻寬環境下,電子書仍然至關重要,因為學習者只需下載一次即可離線學習,確保即使在資料通訊敏感地區也能存取行動學習市場。
互動式評估、遊戲化測驗和人工智慧驅動的自適應測試是對主要評估形式的補充。 IBM 的 Watson 驅動的形成性評估工具可將評分工作量減少 60%,使教師能夠專注於教學而非評分。支援 xAPI 等開放資料標準的供應商具有優勢,因為它們允許買家自由組合電子書、互動影片和類比內容,而無需綁定到特定供應商。強制使用專有容器的平台可能會失去客戶流失,因為企業往往會優先考慮開放性,以確保其數位圖書館的未來發展。
即使到了2025年,在K-12(幼兒園至高中)和學位課程體係依然完善的情況下,面授學習仍將佔總收入的36.67%,但由於模擬學習能夠有效減少醫療、航空和能源等行業的關鍵錯誤,其複合年成長率將達到17.33%。隨著AR和VR模組在5G網路上的普及,模擬學習在行動學習市場的佔有率預計將會上升。企業學習與發展(L&D)團隊正致力於切實減少錯誤和停機時間,而教育科技供應商透過將分析儀表板與模擬庫捆綁在一起,如今已能在數月而非數年內展現投資回報。
基於行動裝置的作業拓展正在模糊課堂的界限,並將夜晚轉變為持續學習的機會。零售和旅館業的連鎖公司正在推行基於情境的短期培訓,新員工可以在48小時內完成,從而將他們掌握工作技能所需的時間縮短一半。同時,零工和自由工作者正在推動自主學習,他們通常自費獲得可攜式的、與雇主無關的認證,這一趨勢正在推動行動平台取代桌面入口網站。
區域分析
預計到2025年,北美將佔全球收入的31.36%,這得益於明確的《家庭教育權利和隱私法案》(FERPA)指南,該法案緩解了人們對教育機構部署中數據共用的擔憂。財富500強企業每年在每位員工的行動學習與發展(L&D)方面投入1200美元,而加拿大聯邦政府一項要求所有公務員培訓在2027年前轉移到行動平台的指令預計將帶來額外的3.3億美元收入。墨西哥的汽車產業叢集也正在效仿,為輪班工人部署了一款西班牙語應用程式。
亞太地區是成長最快的市場,預計到2031年將以18.15%的複合年成長率成長,這主要得益於印度DIKSHA平台在2024年創下的60億次訪問量,以及中國計劃在2027年前強制推行移動端K-12教育內容。日本已累計2,400億日圓(約16億美元)用於公立學校的維修,而韓國則正充分利用國內OEM廠商的優勢。三星透過運用其自主研發的行動工具,將新員工培訓成本降低了35%。在印尼和菲律賓,基礎設施不足正在減緩市場成長,但離線同步功能在一定程度上彌補了網路覆蓋的不足。
在歐洲,由於平均每次實施GDPR合規成本高達230萬歐元(260萬美元),行動教育的成長僅限於十幾個百分點。在德國,行動模組已被納入學徒制計畫;在英國,與數位證書掛鉤的簽證積分系統使微徽章註冊量增加了40%。南美洲、中東和非洲仍需長期努力,但試點計畫正在蓬勃發展。巴西已在5000所農村學校部署了設備;沙烏地阿拉伯已撥款180億沙烏地裡亞爾(48億美元)作為其「2030願景」的一部分;奈及利亞已強制要求170所大學實施行動內容。
其他好處:
- Excel格式的市場預測(ME)表
- 3個月的分析師支持
目錄
第1章:引言
- 研究假設和市場定義
- 調查範圍
第2章:調查方法
第3章執行摘要
第4章 市場狀況
- 市場概覽
- 市場促進因素
- 數位學習解決方案在企業學習與發展(L&D)領域的快速普及;
- 公司內部 BYOD(自備設備辦公室)政策的趨勢
- 智慧型手機、平板電腦和筆記型電腦的全球普及率正在上升。
- 5G 的全球推廣將使高清影片和利用擴增實境 (AR) 的行動講座成為可能。
- 人工智慧驅動的高度個人化微學習分析可提高投資報酬率
- 零工經濟中憑證的可移植性正在推動行動微憑證的普及。
- 市場限制因素
- 對行動基礎設施的大量初始投資
- 個人設備上的資料安全和隱私合規風險
- 設備和作業系統碎片化導致內容維修成本。
- 智慧型手機價格波動和供應鏈限制正在推高總擁有成本。
- 產業價值鏈分析
- 監理情勢
- 技術展望
- 波特五力分析
第5章 市場規模與成長預測
- 透過解決方案
- 電子書
- 互動式評估
- 移動和影片學習材料
- M-Enablement
- 其他解決方案
- 透過使用
- 課堂學習
- 企業培訓
- 利用模擬進行學習
- 線上實踐培訓
- 獨立學習
- 最終用戶
- 學術機構
- 公司
- 按提供者類型
- 內容提供者
- 服務供應商
- 按地區
- 北美洲
- 美國
- 加拿大
- 墨西哥
- 南美洲
- 巴西
- 阿根廷
- 其他南美國家
- 歐洲
- 德國
- 英國
- 法國
- 義大利
- 西班牙
- 其他歐洲國家
- 亞太地區
- 中國
- 日本
- 印度
- 韓國
- ASEAN
- 其他亞太國家
- 中東
- 沙烏地阿拉伯
- 阿拉伯聯合大公國
- 其他中東國家
- 非洲
- 南非
- 奈及利亞
- 其他非洲國家
- 北美洲
第6章 競爭情勢
- 市場集中度
- 策略趨勢
- 市佔率分析
- 公司簡介
- SAP SE
- Microsoft Corporation
- Adobe Inc.
- Skillsoft Corporation
- Cisco Systems, Inc.
- Citrix Systems, Inc.
- Dell Technologies Inc.
- International Business Machines Corporation
- AT&T Inc.
- Upside Learning Solutions Pvt. Ltd.
- Learning Technologies Group plc
- Coursera Inc.
- Udemy, Inc.
- D2L Corporation
- Blackboard Inc.
- Docebo Inc.
- Cornerstone OnDemand, Inc.
- Pluralsight, Inc.
- 360Learning SA
- Allen Interactions Inc.
- Instructure Holdings, Inc.
- Google LLC
- Apple Inc.
- Oracle Corporation
- Promethean Limited
- NetDimensions Limited
第7章 市場機會與未來展望
According to Mordor Intelligence, the mobile learning market size is estimated at USD 95.77 billion in 2026, and is expected to reach USD 200.24 billion by 2031, at a CAGR of 15.89% during the forecast period (2026-2031).
This report is Segmented by Solution (E-Books, Interactive Assessment, Mobile and Video-Based Courseware, and More), by Application (In-Class Learning, Corporate Learning, Simulation-Based Learning, and More), End-User (Academic Institutes, and Corporate Enterprises), Provider Type (Content Providers, and Service Providers), and Geography. The Market Forecasts are Provided in Terms of Value (USD).
Global Mobile Learning Market Trends and Insights
Rapid Adoption of Digital Learning Solutions in Corporate L&D
Corporate budgets pivoted toward mobile-first channels after hybrid work took hold in 2024. Fortune 500 firms now direct most training spend to smartphone-ready modules, a stance validated when LinkedIn Learning registered 78% corporate usage in 2024. Mobile-first programs consistently post higher completion and proficiency metrics than desktop-only equivalents, delivering measurable productivity dividends. Just-in-time learning embedded inside workflow tools drives quota attainment, and the marginal cost of adding each learner approaches zero once the platform is live, letting scale redefine competitive advantage.
Bring-Your-Own-Device Policies Across Enterprises
BYOD acceptance accelerated in 2024 when NIST issued step-by-step security guidelines, reducing chief information officer hesitation. Workers prefer using personal phones on commutes, and enterprises reap 40%-60% hardware savings. Yet, risk shifts to cybersecurity; endpoint vulnerability counts climb, forcing investments in mobile threat defense licenses that average USD 15-25 per user annually. Even with added security spend, the economics remain favorable, supporting wider adoption.
High Upfront Investment in Mobile-Ready Infrastructure
Mid-sized enterprises spend USD 1.2-2.8 million integrating mobile learning management systems with existing HR and authentication stacks. Nearly half of that total funds legacy-system connectors rather than the learning platform itself. Although cloud-native vendors offer pre-built APIs, customization still averages six to nine months, slowing time-to-value. Smaller companies often postpone adoption or rely on consumer-grade tools, deepening skill gaps versus larger peers.
Other drivers and restraints analyzed in the detailed report include:
- Rising Global Penetration of Smartphones, Tablets and Laptops
- Global 5G Roll-Out Enabling High-Definition Video and AR Mobile Courses
- Data-Security and Privacy Compliance Risks on Personal Devices
For complete list of drivers and restraints, kindly check the Table Of Contents.
Segment Analysis
M-enablement is growing at 16.82% CAGR through 2031 as enterprises fast-track desktop-course conversions rather than commission expensive net-new productions. The mobile learning market size attributed to e-books represented 30.46% of overall revenue in 2025, confirming the format's cost-effectiveness for foundational content. Retrofits slash delivery cycles from 12 months to 3 months, a decisive edge when tech skills now expire in half a decade. E-books, however, remain vital in low-bandwidth settings because learners can download once and study offline, keeping the mobile learning market accessible in data-cost-sensitive geographies.
Interactive assessments, gamified quizzes, and AI-driven adaptive testing supplement core formats. IBM's Watson-powered formative tools cut grading workloads by 60%, freeing faculty to coach rather than mark. Vendors that support open data standards like xAPI hold an advantage because buyers can mix and match e-books, interactive video, and simulations without vendor lock-in. Platforms forcing proprietary containers risk churn as enterprises favor openness to future-proof their digital libraries.
In-class learning still held 36.67% revenue share in 2025 due to entrenched K-12 and degree programs, yet simulation-based learning is tracking a 17.33% CAGR because it mitigates high-stakes mistakes in healthcare, aviation, and energy. The mobile learning market share of simulations is expected to rise as AR and VR modules become mainstream on 5G networks. Corporate L&D teams value the measurable drop in errors and downtime, and ed-tech vendors now bundle simulation libraries with analytics dashboards, proving ROI in months rather than years.
Mobile homework extensions blur the classroom boundary, turning evenings into continuous learning windows. Retail and hospitality chains deploy bite-sized scenario training that new hires consume within 48 hours, halving ramp-up time. Gig-workers and freelancers meanwhile drive independent learning, often self-funding portable credentials that cross employers, a trend reinforcing mobile platforms over desktop portals.
Complete Report Scope:
- By Solution
- E-Books
- Interactive Assessment
- Mobile and Video-Based Courseware
- M-Enablement
- Other Solutions
- By Application
- In-Class Learning
- Corporate Learning
- Simulation-Based Learning
- Online On-the-Job Training
- Independent Learning
- By End-User
- Academic Institutes
- Corporate Enterprises
- By Provider Type
- Content Providers
- Service Providers
- By Geography
- North America
- United States
- Canada
- Mexico
- South America
- Brazil
- Argentina
- Rest of South America
- Europe
- Germany
- United Kingdom
- France
- Italy
- Spain
- Rest of Europe
- Asia-Pacific
- China
- Japan
- India
- South Korea
- ASEAN
- Rest of Asia-Pacific
- Middle East
- Saudi Arabia
- United Arab Emirates
- Rest of Middle East
- Africa
- South Africa
- Nigeria
- Rest of Africa
- North America
Geography Analysis
North America commanded 31.36% of 2025 global revenue, supported by clear FERPA guidance that eased data-sharing concerns for institutional deployments. Fortune 500 companies spend USD 1,200 per employee annually on mobile L&D, and Canada's federal directive to migrate all civil-service training to mobile platforms by 2027 adds USD 330 million in incremental procurement. Mexico's automotive clusters follow suit, rolling out Spanish-language apps for shift workers.
Asia Pacific is the fastest-growing arena at 18.15% CAGR to 2031, powered by India's DIKSHA platform's 6 billion sessions in 2024 and China's upcoming 2027 deadline for mobile-ready K-12 content. Japan earmarked JPY 240 billion (USD 1.6 billion) to retrofit public schools, and South Korea leverages domestic OEM strength - Samsung cut new-hire training costs 35% using internal mobile tools. Uneven infrastructure tempers gains in Indonesia and the Philippines, though offline-sync capabilities partly offset network gaps.
Europe trails at mid-teens growth due to GDPR compliance costs that average EUR 2.3 million (USD 2.6 million) per rollout. Germany's apprenticeship system integrates mobile modules, and the United Kingdom's visa points regime tied to digital credentials drove a 40% increase in micro-badge enrollments. South America, Middle East, and Africa remain longer-term plays yet reveal pilot momentum: Brazil equips 5,000 rural schools, Saudi Arabia allocates SAR 18 billion (USD 4.8 billion) under Vision 2030, and Nigeria mandates mobile content across 170 universities.
- SAP SE
- Microsoft Corporation
- Adobe Inc.
- Skillsoft Corporation
- Cisco Systems, Inc.
- Citrix Systems, Inc.
- Dell Technologies Inc.
- International Business Machines Corporation
- AT&T Inc.
- Upside Learning Solutions Pvt. Ltd.
- Learning Technologies Group plc
- Coursera Inc.
- Udemy, Inc.
- D2L Corporation
- Blackboard Inc.
- Docebo Inc.
- Cornerstone OnDemand, Inc.
- Pluralsight, Inc.
- 360Learning SA
- Allen Interactions Inc.
- Instructure Holdings, Inc.
- Google LLC
- Apple Inc.
- Oracle Corporation
- Promethean Limited
- NetDimensions Limited
Additional Benefits:
- The market estimate (ME) sheet in Excel format
- 3 months of analyst support
TABLE OF CONTENTS
1 INTRODUCTION
- 1.1 Study Assumptions and Market Definition
- 1.2 Scope of the Study
2 RESEARCH METHODOLOGY
3 EXECUTIVE SUMMARY
4 MARKET LANDSCAPE
- 4.1 Market Overview
- 4.2 Market Drivers
- 4.2.1 Rapid Adoption of Digital Learning Solutions in Corporate L&D
- 4.2.2 Bring-Your-Own-Device (BYOD) Policies Across Enterprises
- 4.2.3 Rising Global Penetration of Smartphones, Tablets and Laptops
- 4.2.4 Global 5G Roll-Out Enabling High-Definition Video and AR Mobile Courses
- 4.2.5 AI-driven Hyper-Personalised Micro-Learning Analytics Boosting ROI
- 4.2.6 Gig-economy Credential Portability Catalysing Mobile Micro-credentials
- 4.3 Market Restraints
- 4.3.1 High Upfront Investment in Mobile-ready Infrastructure
- 4.3.2 Data-security and Privacy Compliance Risks on Personal Devices
- 4.3.3 Device/OS Fragmentation Inflating Content-maintenance Costs
- 4.3.4 Smartphone Tariff Volatility and Supply-chain Constraints Raising TCO
- 4.4 Industry Value Chain Analysis
- 4.5 Regulatory Landscape
- 4.6 Technological Outlook
- 4.7 Porter's Five Forces Analysis
- 4.7.1 Bargaining Power of Suppliers
- 4.7.2 Bargaining Power of Buyers
- 4.7.3 Threat of New Entrants
- 4.7.4 Threat of Substitutes
- 4.7.5 Intensity of Competitive Rivalry
5 MARKET SIZE AND GROWTH FORECASTS (VALUE)
- 5.1 By Solution
- 5.1.1 E-Books
- 5.1.2 Interactive Assessment
- 5.1.3 Mobile and Video-Based Courseware
- 5.1.4 M-Enablement
- 5.1.5 Other Solutions
- 5.2 By Application
- 5.2.1 In-Class Learning
- 5.2.2 Corporate Learning
- 5.2.3 Simulation-Based Learning
- 5.2.4 Online On-the-Job Training
- 5.2.5 Independent Learning
- 5.3 By End-User
- 5.3.1 Academic Institutes
- 5.3.2 Corporate Enterprises
- 5.4 By Provider Type
- 5.4.1 Content Providers
- 5.4.2 Service Providers
- 5.5 By Geography
- 5.5.1 North America
- 5.5.1.1 United States
- 5.5.1.2 Canada
- 5.5.1.3 Mexico
- 5.5.2 South America
- 5.5.2.1 Brazil
- 5.5.2.2 Argentina
- 5.5.2.3 Rest of South America
- 5.5.3 Europe
- 5.5.3.1 Germany
- 5.5.3.2 United Kingdom
- 5.5.3.3 France
- 5.5.3.4 Italy
- 5.5.3.5 Spain
- 5.5.3.6 Rest of Europe
- 5.5.4 Asia-Pacific
- 5.5.4.1 China
- 5.5.4.2 Japan
- 5.5.4.3 India
- 5.5.4.4 South Korea
- 5.5.4.5 ASEAN
- 5.5.4.6 Rest of Asia-Pacific
- 5.5.5 Middle East
- 5.5.5.1 Saudi Arabia
- 5.5.5.2 United Arab Emirates
- 5.5.5.3 Rest of Middle East
- 5.5.6 Africa
- 5.5.6.1 South Africa
- 5.5.6.2 Nigeria
- 5.5.6.3 Rest of Africa
- 5.5.1 North America
6 COMPETITIVE LANDSCAPE
- 6.1 Market Concentration
- 6.2 Strategic Moves
- 6.3 Market Share Analysis
- 6.4 Company Profiles (includes Global level Overview, Market Level Overview, Core Segments, Financials as Available, Strategic Information, Market Rank/Share for Key Companies, Products and Services, and Recent Developments)
- 6.4.1 SAP SE
- 6.4.2 Microsoft Corporation
- 6.4.3 Adobe Inc.
- 6.4.4 Skillsoft Corporation
- 6.4.5 Cisco Systems, Inc.
- 6.4.6 Citrix Systems, Inc.
- 6.4.7 Dell Technologies Inc.
- 6.4.8 International Business Machines Corporation
- 6.4.9 AT&T Inc.
- 6.4.10 Upside Learning Solutions Pvt. Ltd.
- 6.4.11 Learning Technologies Group plc
- 6.4.12 Coursera Inc.
- 6.4.13 Udemy, Inc.
- 6.4.14 D2L Corporation
- 6.4.15 Blackboard Inc.
- 6.4.16 Docebo Inc.
- 6.4.17 Cornerstone OnDemand, Inc.
- 6.4.18 Pluralsight, Inc.
- 6.4.19 360Learning SA
- 6.4.20 Allen Interactions Inc.
- 6.4.21 Instructure Holdings, Inc.
- 6.4.22 Google LLC
- 6.4.23 Apple Inc.
- 6.4.24 Oracle Corporation
- 6.4.25 Promethean Limited
- 6.4.26 NetDimensions Limited
7 MARKET OPPORTUNITIES AND FUTURE OUTLOOK
- 7.1 White-space and Unmet-Need Assessment

 全球行動學習市場規模、佔有率、趨勢和成長分析報告(2026-2034)
 行動學習市場:全球市場預測,2026-2032年
 高等教育行動學習市場規模、佔有率和成長分析:按學習形式、部署形式、設備類型、應用、最終用戶和地區分類-2026-2033年產業預測
 企業行動學習市場規模、佔有率和成長分析:按組件、解決方案類型、學習類型、組織規模、最終用途和地區分類-2026-2033年產業預測
 行動學習市場規模、佔有率和成長分析:按學習類型、平台類型、部署模式、應用、最終用戶、設備類型和地區分類-2026-2033年產業預測
 2026年高等教育行動學習全球市場報告2026年全球企業行動學習市場報告
 行動學習市場預測至2034年-全球分析(按組件、設備類型、學習模式、應用、最終用戶和地區分類)
 企業行動學習市場規模、佔有率、趨勢和預測:按解決方案、應用、用戶類型和地區分類(2026-2034 年)企業行動學習市場:2026-2032年全球市場預測(依設備類型、交付方式、部署方式、產業及組織規模分類)