


 |
市場調查報告書
商品編碼
2124481
礦業實驗室自動化:市場佔有率分析、產業趨勢與統計及成長預測(2026-2031 年)Mining Laboratory Automation - Market Share Analysis, Industry Trends & Statistics, Growth Forecasts (2026 - 2031) |
||||||

※ 本網頁內容可能與最新版本有所差異。詳細情況請與我們聯繫。
據 Mordor Intelligence 稱,2026 年礦業實驗室自動化市場規模估計為 79.5 億美元,高於 2025 年的 72.2 億美元,預計到 2031 年將達到 128.8 億美元。
預計 2026 年至 2031 年的複合年成長率為 10.13%。
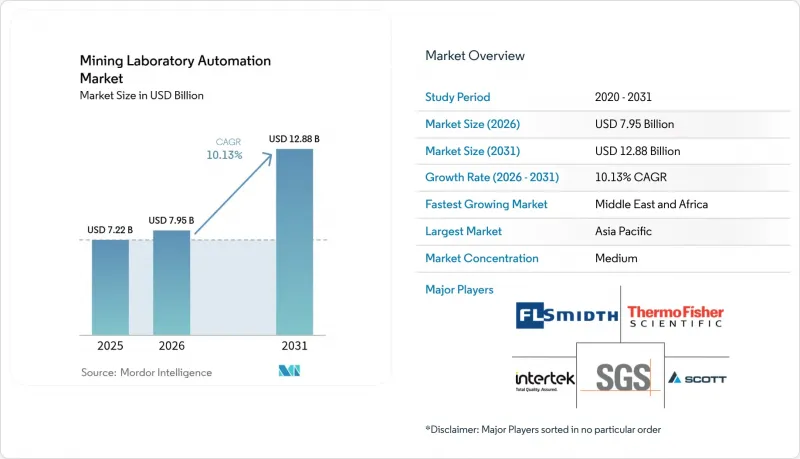
本報告按產品(機器人、實驗室資訊管理系統、貨櫃實驗室等)、自動化程度(整套實驗室、模組化實驗室)、採礦階段(探勘、生產、礦山關閉等)、商品(鐵礦石、銅、黃金、電池用礦物)、最終用戶(大型礦業公司、中型和新興礦業公司)以及地區進行細分。市場預測以美元計價。
全球礦業實驗室自動化市場趨勢及洞察。
澳洲一項以數位化為先導的採樣計劃,涵蓋從礦場到港口的整個流程。
大型礦業公司目前正將自主鑽機、自動化破碎機和機器人煙火生產線整合到一個統一的資料主幹網路中,從而在幾分鐘內將地球化學分析結果轉化為規劃軟體所需的資料。力拓集團報告稱,透過在其機器人實驗室設施中實施預測性維護,每年可節省 2 億美元的成本;而必和必拓位於智利的斯賓塞礦在 2024 年實現了三個月的完全自主運作,且無任何事故發生。持續的數據流消除了人工操作的瓶頸,降低了 40% 的污染風險,並在大規模鐵礦石開採作業中將礦石回收率提高了 3-5%。
智利銅礦強制報告現場分析結果。
監管規定將品質控制分析時間限制在四小時內,迫使智利礦場採用自動化樣品製備和攜帶式X光螢光光譜儀,以便在90分鐘內得出結果。智利國家銅業公司(Codelco)與ABB公司簽訂了一份價值25億美元的契約,其中包括電氣化和實驗室自動化改造,這使得領先採用這些技術的礦山銅回收率提高了2-3個百分點。秘魯也正在實施類似的法規。
中型礦山資本投資的回收期超過3年。
中型礦業公司在評估實驗室自動化投資時面臨巨大的財務壓力。這是因為較長的投資回收期往往超出了資本資源有限的公司可接受的風險閾值。 SRK顧問公司對礦業營運成本的分析顯示,如果投資回收期超過36個月,初始投資超過500萬美元的自動化專案通常會受到董事會的嚴格審查。大宗商品價格的波動進一步加劇了這個挑戰。特別是黃金和基底金屬礦業,其價格年波動幅度可能超過20%,使得長期投資報酬率的計算變得不可靠。 Tech Resources公司的Quebrada Blanca II專案就是一個典型的例子。該專案的開發成本飆升至85億至90億美元,遠超最初的預算,凸顯了大規模自動化舉措成本超支的風險。儘管設備融資和租賃協議正在成為潛在的解決方案,但由於擔心技術過時和維護責任,這些方案的應用仍然有限。
細分市場分析
到2025年,機器人技術將佔據礦業實驗室自動化市場33.60%的最大佔有率。這主要源自於保護工人免受高溫爐和致癌性粉塵危害的需求。 Scott Automation的承包單元可在密封環境中完成破碎、研磨、稱重和火法鑄造等工序,從而提高處理能力和可重複性。實驗室資訊管理系統(LIMS)雖然規模較小,但成長速度最快,複合年成長率達12.15%,因為經營團隊更重視資料完整性和監管可追溯性,而非硬體處理速度。貨櫃式實驗室滿足了探勘活動快速部署的需求,一個40英尺的模組即可在三週內投入運作。自動化分析儀採用人工智慧校準技術,在提高精度的同時,還能減少試劑用量。
企業正青睞模組化的獨立系統,這些系統能夠取代研磨、分割和熔化等單一工序,同時又不影響整體工作流程的穩定性。到2025年,這些系統將佔據礦業實驗室自動化市場50.20%的佔有率。隨著投資回報的不斷積累,整個實驗室自動化市場正以每年14.51%的速度成長,尤其是在樣品量龐大的主要鐵礦石和銅礦產區,趨勢更為顯著。 ABB與安捷倫合作推出的整合式機器人和化學分析功能的「獨立」系統,顯示市場正朝著提供涵蓋整個製造流程解決方案的供應商生態系統轉變。
區域分析
到2025年,亞太地區將佔全球銷售額的31.20%,這主要得益於澳洲自主化的鐵礦石供應鏈和中國龐大的非鐵金屬生產能力。 2022年,澳洲採礦業與機器人相關的支出達到630億美元,預計2030年將飆升至2,180億美元,趨勢也出現在實驗室領域。日本和韓國供應的精密感測器和人工智慧晶片能夠提高分析精度。
在主權財富基金的推動下,中東和非洲地區實現了最高的複合年成長率,達到14.86%。沙烏地阿拉伯礦業公司Maaden與Hexagon合作,在該地區開設了首個數位化礦場(預算20億美元),已成為磷酸鹽、黃金和銅礦資產實驗室自動化的典範案例。在非洲,由於基礎設施薄弱和熟練技術人員短缺,實驗室自動化部署主要依賴貨櫃式實驗室和遠端監控。
在北美,隨著傳統的鈾、鉀和貴金屬分析設施逐漸過時,現代化需求持續成長。供應商被迫維修,以確保互通性並應對勞動力環境,包括工會的存在。歐洲的情況則較為複雜。北歐鐵礦石生產商率先採用了「中心輻射式」自動化實驗室模式,為眾多衛星礦山提供支持,但在整個歐盟範圍內,數據主權問題使得基於雲端的實驗室資訊管理系統(LIMS)模式的實施變得複雜。在南美洲,智利關於分析結果報告期的立法以及秘魯的鋰礦熱潮都推動了這一趨勢。
其他好處:
- Excel格式的市場預測(ME)表
- 3個月的分析師支持
目錄
第1章:引言
- 研究假設和市場定義
- 調查範圍
第2章:調查方法
第3章執行摘要
第4章 市場狀況
- 市場概覽
- 市場促進因素
- 澳洲的數位化優先「礦坑到港口」採樣計劃
- 智利銅礦現場分析結果的報告義務
- 西非大型金礦對品位控制的需求迅速成長
- 巴西對尾礦壩實施更嚴格的監測規定
- 北歐國家貨櫃式「樞紐輻射」實驗室的興起
- 人工智慧驅動的機器人樣品製備預測性維護
- 市場限制因素
- 中型礦山資本投資回收期為3年。
- 傳統檢測硬體之間互通性的限制。
- 非洲和加勒比地區機器人工程師短缺
- 數據主權障礙阻礙了歐盟採用基於雲端的LIMS
- 價值供應鏈分析
- 監理展望
- 技術展望
- 波特五力分析
- 主要用途
- 研究所
- 礦場地下實驗室
- 主要用例
- 砲孔品質保證/品管的自動化輪班制
- 環境基準ESG 報告
第5章 市場規模與成長預測
- 依產品
- 機器人技術
- 實驗室資訊管理系統(LIMS)
- 貨櫃實驗室
- 自動化分析儀和樣品製備裝置
- 按自動化級別
- 實驗室全面自動化(TLA)
- 模組/孤島自動化
- 採礦階段
- 探勘與品位管理
- 礦業開發與規劃
- 生產和選礦
- 礦山關閉和環境監測
- 加工產品
- 鐵礦石
- 銅
- 金子
- 煤炭和電池用礦物(鎳、鋰、鈷)
- 按地區
- 北美洲
- 美國
- 加拿大
- 墨西哥
- 歐洲
- 英國
- 德國
- 法國
- 義大利
- 其他歐洲國家
- 亞太地區
- 中國
- 日本
- 印度
- 韓國
- 其他亞太國家
- 中東
- 以色列
- 沙烏地阿拉伯
- 阿拉伯聯合大公國
- 土耳其
- 其他中東國家
- 非洲
- 南非
- 埃及
- 其他非洲國家
- 南美洲
- 巴西
- 阿根廷
- 其他南美國家
- 北美洲
第6章 競爭情勢
- 策略趨勢
- 市佔率分析
- 公司簡介
- FLSmidth A/S
- Bruker Corporation
- Thermo Fisher Scientific Inc.
- Intertek Group PLC
- SGS SA
- ALS Limited
- Bureau Veritas SA
- Rocklabs(SCOTT Technology)
- HERZOG Automation Corp.
- Malvern Panalytical Ltd.
- Nucomat
- PerkinElmer Inc.
- Agilent Technologies Inc.
- Metso Outotec Oyj
- CEM Corporation
- Element Materials Technology
- Online LIMS Canada Ltd.
- QMetrix Group
- Sentry Equipment Corp.
- CITIC Heavy Industries Robotic Lab Systems
第7章 市場機會與未來展望
According to Mordor Intelligence, mining laboratory automation market size in 2026 is estimated at USD 7.95 billion, growing from 2025 value of USD 7.22 billion with 2031 projections showing USD 12.88 billion, growing at 10.13% CAGR over 2026-2031.
This report is Segmented by Product (Robotics, LIMS, Container Labs, and More), Automation Level (Total Lab, Modular), Mining Phase (Exploration, Production, Closure, and More), Commodity (Iron Ore, Copper, Gold, Battery Minerals), End User (Large Mining Enterprises, Mid-Tier and Junior Miners), and Geography. The Market Forecasts are Provided in Terms of Value (USD).
Global Mining Laboratory Automation Market Trends and Insights
Digital-first "Pit-to-Port" Sampling Initiatives in Australia
Mining majors now integrate autonomous drills, automated crushers, and robotic fire-assay lines into unified data backbones that push geochemical results into planning software within minutes. Rio Tinto reports annual savings of USD 200 million after deploying predictive maintenance on robotic lab assets, while BHP's Spence mine in Chile logged three months of full autonomy with zero safety incidents in 2024. Continuous data flow removes manual choke points, cuts contamination risk by 40%, and lifts ore recovery 3-5% in large iron-ore operations.
Mandatory On-site Assay Turn-around in Chilean Copper Mines
Four-hour regulatory limits for grade-control assays have forced Chilean sites to adopt automated sample preparation and portable XRF units capable of 90-minute results. Codelco's USD 2.5 billion agreement with ABB bundles electrification and laboratory automation, giving early movers 2-3-point boosts in copper recovery and shaping similar mandates in Peru.
CAPEX Pay-back > 3 Years for Mid-Tier Mines
Mid-tier mining operations face significant financial constraints when evaluating laboratory automation investments, as extended payback periods often exceed acceptable risk thresholds for companies with limited capital resources. SRK Consulting's analysis of mining operational costs reveals that automation projects requiring initial investments above USD 5 million typically face scrutiny from boards when payback periods extend beyond 36 months. The challenge is compounded by volatile commodity prices that make long-term ROI calculations unreliable, particularly for gold and base metal operations where price fluctuations can exceed 20% annually. Teck Resources' Quebrada Blanca II project exemplifies this challenge, with development costs escalating to USD 8.5-9 billion significantly above initial estimates, highlighting the risk of cost overruns in major automation initiatives. Equipment financing options and leasing arrangements are emerging as potential solutions, but adoption remains limited due to concerns about technology obsolescence and maintenance responsibilities.
Other drivers and restraints analyzed in the detailed report include:
- Rapid Grade-Control Needs in West African Gold Super-Pits
- AI-Enabled Predictive Maintenance for Robotic Sample Prep
- Limited Inter-operability Between Legacy Assay Hardware
For complete list of drivers and restraints, kindly check the Table Of Contents.
Segment Analysis
Robotics generated the largest 33.60% slice of the Mining Laboratory Automation market in 2025, underpinned by the need to shield personnel from high-temperature furnaces and carcinogenic dust. Scott Automation's turnkey cells now deliver crushing, milling, weighing, and fire-assay pouring in sealed environments, lifting throughput and repeatability. LIMS, while smaller, is the fastest climber at 12.15% CAGR, as executives value data integrity and regulatory traceability more than incremental hardware speed. Container labs meet exploration campaigns that require rapid mobilization; one 40-foot module can be on-line within three weeks. Automated analyzers adopt AI-assisted calibration, trimming reagent use and boosting precision.
Firms prefer modular islands that replace discrete tasks-crushing, splitting, or fusion-without destabilizing whole workflows. Such systems accounted for 50.20% of the Mining Laboratory Automation market share in 2025. As payback proof accumulates, total lab automation grows 14.51% per year, particularly in iron-ore and copper hubs where sample volumes are extreme. ABB's alliance with Agilent to provide integrated robotic-chemistry islands signals a shift toward vendor ecosystems that deliver cradle-to-gate solutions.
Complete Report Scope:
- By Product
- Robotics
- Laboratory Information Management Systems (LIMS)
- Container Laboratory
- Automated Analyzers and Sample Preparation Equipment
- By Automation Level
- Total Lab Automation (TLA)
- Modular / Island Automation
- By Mining Phase
- Exploration and Grade Control
- Mine Development and Planning
- Production and Beneficiation
- Closure and Environmental Monitoring
- By Commodity Processed
- Iron Ore
- Copper
- Gold
- Coal and Battery Minerals (Ni, Li, Co)
- By Geography
- North America
- United States
- Canada
- Mexico
- Europe
- United Kingdom
- Germany
- France
- Italy
- Rest of Europe
- Asia-Pacific
- China
- Japan
- India
- South Korea
- Rest of Asia-Pacific
- Middle East
- Israel
- Saudi Arabia
- United Arab Emirates
- Turkey
- Rest of Middle East
- Africa
- South Africa
- Egypt
- Rest of Africa
- South America
- Brazil
- Argentina
- Rest of South America
- North America
Geography Analysis
Asia-Pacific anchored 31.20% of global revenue in 2025, with Australia's autonomous iron-ore chain and China's vast base-metal capacity driving demand. Australian robotics spending in mining stood at USD 63 billion in 2022 and is projected to jump to USD 218 billion by 2030, a trend mirrored in laboratory settings. Japan and South Korea supply precision sensors and AI chips that sharpen assay accuracy.
Middle East & Africa records the quickest 14.86% CAGR, catalyzed by sovereign funds. Saudi miner Ma'aden's tie-up with Hexagon to open the region's first digital mine-budgeted at USD 2 billion-sets a template for lab automation across phosphate, gold, and copper assets. African deployments lean heavily on container labs and remote monitoring to sidestep weak infrastructure and scarce technicians.
North America shows steady replacement demand as legacy uranium, potash, and precious-metal labs age. Vendors must navigate inter-operability retrofits and unionized labor environments. Europe's picture is mixed: Nordic iron-ore producers pioneer hub-and-spoke automated labs that support numerous satellite mines, but the wider EU struggles with data-sovereignty hurdles that complicate cloud-based LIMS models. South America benefits from Chile's assay-turn-around law and Peru's lithium boom.
- FLSmidth A/S
- Bruker Corporation
- Thermo Fisher Scientific Inc.
- Intertek Group PLC
- SGS SA
- ALS Limited
- Bureau Veritas SA
- Rocklabs (SCOTT Technology)
- HERZOG Automation Corp.
- Malvern Panalytical Ltd.
- Nucomat
- PerkinElmer Inc.
- Agilent Technologies Inc.
- Metso Outotec Oyj
- CEM Corporation
- Element Materials Technology
- Online LIMS Canada Ltd.
- QMetrix Group
- Sentry Equipment Corp.
- CITIC Heavy Industries Robotic Lab Systems
Additional Benefits:
- The market estimate (ME) sheet in Excel format
- 3 months of analyst support
TABLE OF CONTENTS
1 INTRODUCTION
- 1.1 Study Assumptions and Market Definition
- 1.2 Scope of the Study
2 RESEARCH METHODOLOGY
3 EXECUTIVE SUMMARY
4 MARKET LANDSCAPE
- 4.1 Market Overview
- 4.2 Market Drivers
- 4.2.1 Digital-first "Pit-to-Port" Sampling Initiatives in Australia
- 4.2.2 Mandatory On-site Assay Turn-around in Chilean Copper Mines
- 4.2.3 Rapid Grade-Control Needs in West African Gold Super-Pits
- 4.2.4 Stricter Tailings-Dam Monitoring Rules in Brazil
- 4.2.5 Rise of Containerized "Hub-and-Spoke" Labs Across the Nordics
- 4.2.6 AI-Enabled Predictive Maintenance for Robotic Sample Prep
- 4.3 Market Restraints
- 4.3.1 CAPEX Pay-back to 3 Years for Mid-Tier Mines
- 4.3.2 Limited Inter-operability Between Legacy Assay Hardware
- 4.3.3 Scarcity of Robotics Technicians in Africa and Caribbeans
- 4.3.4 Data-sovereignty Barriers to Cloud-Hosted LIMS in EU
- 4.4 Value / Supply-Chain Analysis
- 4.5 Regulatory Outlook
- 4.6 Technological Outlook
- 4.7 Porter's Five Forces Analysis
- 4.7.1 Bargaining Power of Suppliers
- 4.7.2 Bargaining Power of Buyers
- 4.7.3 Threat of New Entrants
- 4.7.4 Threat of Substitutes
- 4.7.5 Competitive Rivalry
- 4.8 Key Applications
- 4.8.1 Laboratories
- 4.8.2 Mine-site In-Pit Labs
- 4.9 Major Use-Cases
- 4.9.1 Automated Shift-Based Blast-Hole QA/QC
- 4.9.2 Environmental Baseline and ESG Reporting
5 MARKET SIZE AND GROWTH FORECASTS (VALUE)
- 5.1 By Product
- 5.1.1 Robotics
- 5.1.2 Laboratory Information Management Systems (LIMS)
- 5.1.3 Container Laboratory
- 5.1.4 Automated Analyzers and Sample Preparation Equipment
- 5.2 By Automation Level
- 5.2.1 Total Lab Automation (TLA)
- 5.2.2 Modular / Island Automation
- 5.3 By Mining Phase
- 5.3.1 Exploration and Grade Control
- 5.3.2 Mine Development and Planning
- 5.3.3 Production and Beneficiation
- 5.3.4 Closure and Environmental Monitoring
- 5.4 By Commodity Processed
- 5.4.1 Iron Ore
- 5.4.2 Copper
- 5.4.3 Gold
- 5.4.4 Coal and Battery Minerals (Ni, Li, Co)
- 5.5 By Geography
- 5.5.1 North America
- 5.5.1.1 United States
- 5.5.1.2 Canada
- 5.5.1.3 Mexico
- 5.5.2 Europe
- 5.5.2.1 United Kingdom
- 5.5.2.2 Germany
- 5.5.2.3 France
- 5.5.2.4 Italy
- 5.5.2.5 Rest of Europe
- 5.5.3 Asia-Pacific
- 5.5.3.1 China
- 5.5.3.2 Japan
- 5.5.3.3 India
- 5.5.3.4 South Korea
- 5.5.3.5 Rest of Asia-Pacific
- 5.5.4 Middle East
- 5.5.4.1 Israel
- 5.5.4.2 Saudi Arabia
- 5.5.4.3 United Arab Emirates
- 5.5.4.4 Turkey
- 5.5.4.5 Rest of Middle East
- 5.5.5 Africa
- 5.5.5.1 South Africa
- 5.5.5.2 Egypt
- 5.5.5.3 Rest of Africa
- 5.5.6 South America
- 5.5.6.1 Brazil
- 5.5.6.2 Argentina
- 5.5.6.3 Rest of South America
- 5.5.1 North America
6 COMPETITIVE LANDSCAPE
- 6.1 Strategic Moves
- 6.2 Market Share Analysis
- 6.3 Company Profiles (includes Global Level Overview, Market Level Overview, Core Segments, Financials as available, Strategic Information, Market Rank/Share for key companies, Products and Services, and Recent Developments)
- 6.3.1 FLSmidth A/S
- 6.3.2 Bruker Corporation
- 6.3.3 Thermo Fisher Scientific Inc.
- 6.3.4 Intertek Group PLC
- 6.3.5 SGS SA
- 6.3.6 ALS Limited
- 6.3.7 Bureau Veritas SA
- 6.3.8 Rocklabs (SCOTT Technology)
- 6.3.9 HERZOG Automation Corp.
- 6.3.10 Malvern Panalytical Ltd.
- 6.3.11 Nucomat
- 6.3.12 PerkinElmer Inc.
- 6.3.13 Agilent Technologies Inc.
- 6.3.14 Metso Outotec Oyj
- 6.3.15 CEM Corporation
- 6.3.16 Element Materials Technology
- 6.3.17 Online LIMS Canada Ltd.
- 6.3.18 QMetrix Group
- 6.3.19 Sentry Equipment Corp.
- 6.3.20 CITIC Heavy Industries Robotic Lab Systems
7 MARKET OPPORTUNITIES AND FUTURE OUTLOOK
- 7.1 White-space and Unmet-Need Assessment

