


 |
市場調查報告書
商品編碼
2124461
資料歷史:市場佔有率分析、產業趨勢與統計資料、成長預測(2026-2031)Data Historian - Market Share Analysis, Industry Trends & Statistics, Growth Forecasts (2026 - 2031) |
||||||

※ 本網頁內容可能與最新版本有所差異。詳細情況請與我們聯繫。
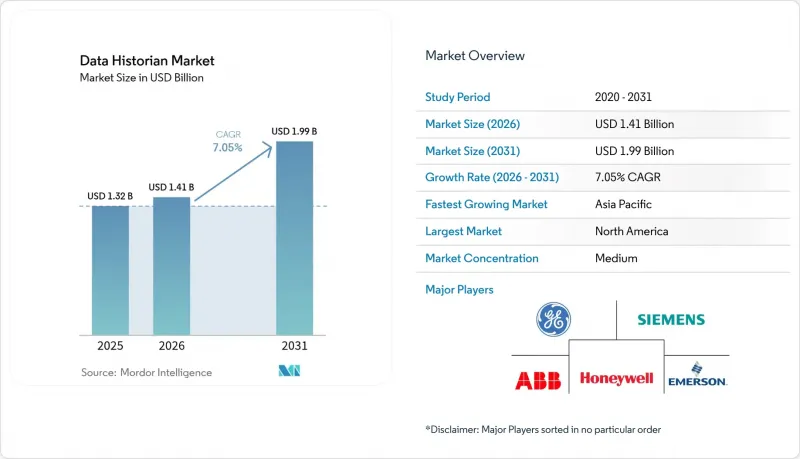
根據 Mordor Intelligence 估計,資料歷史資料庫市場在 2026 年的價值將達到 14.1 億美元,高於 2025 年的 13.2 億美元,預計到 2031 年將達到 19.9 億美元。
預計從 2026 年到 2031 年,其複合年成長率將達到 7.05%。
本報告按組件(軟體、服務)、部署模式(本地部署、雲端部署)、最終用戶(石油天然氣、電力和公用事業、造紙和紙漿、化學和石化、金屬和採礦、其他)、資料處理頻率(即時、近即時、批次/規劃任務)以及地區進行細分。市場規模和預測均以美元計價。
全球數據歷史資料庫市場趨勢及洞察
對整合數據以最佳化工業績效的需求日益成長
製造企業正在用統一的歷史資料平台取代孤立的儲存環境,該平台整合了生產、維護和品質資料集。寶潔公司 (P&G) 實施了 GE Vernova 的雲端歷史資料平台,透過整合資產資料和 ERP 資料流,將流程設定時間縮短了 50%。基於上下文的資料建模能夠自動關聯異質標籤,使操作人員能夠識別下游品質偏差的上游原因,並報告具有可審計溯源的永續性指標。
工業IoT巨量資料流的日益成長
智慧感測器的普及使資料擷取速率從每秒數千個標籤躍升至每秒數百萬個標籤,給傳統的單體資料庫帶來了巨大壓力。 2024年5月,中國工業生產年增5.6%,其中高科技製造業增幅高達10.0%。這表明資料負載正迅速成長,需要壓縮演算法和邊緣分析節點的支援。供應商正透過容器化微服務來應對這項挑戰,這些微服務能夠自動擴展並將不太重要的資料包路由到二級存儲,以確保遠端設施的頻寬。
公司範圍內實施 Historian 系統會帶來較高的整體擁有成本。
端到端專案需要許可證、專用硬體、整合服務和持續升級,這可能會使資本支出增加高達 300%。羅克韋爾自動化 2024 年的財報顯示,其收入下降了 21%,反映出在宏觀經濟不確定性下,公司在分配新預算方面採取了謹慎的態度。隱性成本包括標籤簡化、資料清理、效能調優和員工技能發展,這些都阻礙了中型製造商採用相關技術。
細分市場分析
到2025年,資料歷史資料庫市場中,軟體將佔據65.60%的市場佔有率,這凸顯了市場對整合資料收集、儲存、分析和視覺化功能的套件解決方案的偏好。供應商正擴大提供捆綁時間序列資料壓縮、資產建模和無程式碼儀錶板的訂閱模式,從而減少工廠網路中工具的氾濫。隨著營運商採用整合合作夥伴來實現OT-IT融合、網路安全修補程式和AI管道編配,服務領域到2031年將以8.85%的複合年成長率成長。 HighByte的1200萬美元資金籌措表明,投資者對利用跨多供應商環境的歷史資料庫數據的工業數據運營服務表現出濃厚的興趣。
資料歷史資料庫市場的成長將繼續受到託管服務普及的推動,服務提供者透過持續最佳化、模型重訓練和監管報告等方式來實現獲利。隨著客戶將歷史資料庫生命週期管理外包,專業顧問公司正在深化其在製藥、能源以及食品飲料行業的領域差異化優勢,從而提升其經常性收入前景,並強化數據歷史資料庫市場中「平台+服務」的模式。
2025年,受延遲敏感度、資料主權監管要求以及高風險產業持續採購實務等因素驅動,本地部署仍將佔據資料歷史資料庫市場70.90%的佔有率。工廠將繼續升級容錯移轉叢集維護空氣間隙的備份節點。同時,隨著資訊長們尋求彈性容量、託管安全態勢和微服務敏捷性,雲端實例正以8.20%的複合年成長率快速成長。監管機構目前正在發布關於在經批准的公共區域託管流程資料的指南,從而降低了先前的障礙。
隨著企業將不頻繁更新的標籤數據串流到雲端,同時在本地保留即時循環數據,混合拓撲結構正在數據歷史庫市場佔據主導地位。雲端供應商提供具有確定性故障保護模式的邊緣閘道器,從而簡化了歷史資料集的“遷移和提升”,以用於訓練人工智慧模型。在整個預測期內,按需付費付費使用制預計仍將是總體擁有成本 (TCO) 方面最具優勢的選擇,這將加速離散製造業和快速成長的電氣化行業的工作負載轉移。
區域分析
北美地區憑藉著石油天然氣、發電和汽車組裝等產業的大規模部署,預計到2025年將以35.10%的市佔率主導資料歷史資料庫市場。聯邦基礎設施項目和勞動力現代化津貼正在加速老舊DCS節點向支援API的資料歷史資料庫的升級。西門子在德克薩斯州和加利福尼亞州的100億美元投資清晰地表明了OEM製造和人工智慧資料中心的成長如何推動國內需求。
亞太地區預計將維持最高成長率,到2031年年均複合成長率將達到8.25%,主要得益於中國的數據經濟藍圖和日本先進的舉措計畫。日立和微軟計畫培訓5萬名員工掌握生成式人工智慧調查方法,凸顯了人力資本在歷史資料部署中的重要性。印度針對半導體製造廠和電動車電池工廠的政策獎勵,進一步推動了該地區歷史數據部署的擴展。北京的三年行動計畫也強調了強而有力的政策支持,目標是實現數據產業20%的年成長率,並進行300多個應用案例示範。在歐洲,各方正根據2024年修訂版《一般資料保護規範》(GDPR)的要求穩步推進相關工作,該條例正式規定了資料儲存、審計和傳輸的相關規則。
在歐洲,隨著修訂後的GDPR條款和《數位營運彈性法案》要求企業證明工業資料的血緣關係、存取控制和不可篡改性,市場預計將保持溫和成長。能源密集型產業正在採用歷史資料庫來揭露碳足跡,而歐盟對氫能價值鏈的投資正在刺激整個電解槽集群高頻資料收集的需求。拉丁美洲、中東和非洲的新興經濟體正在建造不受傳統系統限制的新型製程裝置,這使得資料歷史資料庫市場能夠直接過渡到基於雲端的歷史資料庫拓撲結構。儘管該市場仍在發展中,但這代表著一個極具吸引力的長期機會。
其他好處:
- Excel格式的市場預測(ME)表
- 3個月的分析師支持
目錄
第1章:引言
- 研究假設和市場定義
- 調查範圍
第2章:調查方法
第3章執行摘要
第4章 市場狀況
- 市場概覽
- 市場促進因素
- 對整合數據的需求日益成長,以最佳化工業績效
- 工業IoT巨量資料流的總量正在增加。
- 將傳統歷史資料庫遷移到雲端原生微服務架構
- 供應商將歷史資料處理功能捆綁到全端OT平台中
- 法規要求受監管行業長期保存過程資料。
- 人工智慧/機器學習的快速普及需要高品質的歷史資料集。
- 市場限制因素
- 全公司範圍內實施 Historian 的總擁有成本很高。
- 網路安全問題,即OT資料暴露於IT網路/雲端環境中所帶來的安全隱患。
- 缺乏用於管理歷史學家專案的OT-IT整合技能。
- 專有資料模型和許可系統導致的供應商鎖定
- 價值供應鏈分析
- 監理情勢
- 技術展望
- 波特五力分析
- 投資和資金籌措分析
第5章 市場規模與成長預測
- 按組件
- 軟體
- 服務
- 部署模式
- 現場
- 雲
- 按最終用戶行業分類
- 石油和天然氣
- 電力和公用事業
- 化工/石油化工
- 紙漿和造紙
- 金屬和採礦
- 供水/污水處理
- 資料中心
- 食品/飲料
- 製藥
- 更新
- 即時(小於1秒)
- 近乎即時(1秒至1分鐘)
- 批量/週期性(超過 1 分鐘)
- 按地區
- 北美洲
- 美國
- 加拿大
- 墨西哥
- 南美洲
- 巴西
- 阿根廷
- 其他南美國家
- 歐洲
- 德國
- 英國
- 法國
- 義大利
- 西班牙
- 俄羅斯
- 其他歐洲國家
- 亞太地區
- 中國
- 日本
- 印度
- 韓國
- 澳洲和紐西蘭
- 東南亞
- 其他亞太國家
- 中東
- 沙烏地阿拉伯
- UAE
- 土耳其
- 其他中東國家
- 非洲
- 南非
- 埃及
- 奈及利亞
- 其他非洲國家
- 北美洲
第6章 競爭情勢
- 市場集中度
- 策略趨勢
- 市佔率分析
- 公司簡介
- AVEVA Group plc(incl. PI System)
- Honeywell International Inc.
- Siemens AG
- General Electric Company
- ABB Group
- Emerson Electric Co.
- Rockwell Automation Inc.
- Schneider Electric SE
- Yokogawa Electric Corp.
- Aspen Technology Inc.
- Inductive Automation LLC
- Canary Labs Inc.
- ICONICS Inc.
- Mitsubishi Electric Corp.
- Kongsberg Digital AS
- Hitachi Energy Ltd.
- Open Automation Software LLC
- Wonderware(AVEVA)
- InduSoft(Schneider)
- Softing AG
第7章 市場機會與未來展望
According to Mordor Intelligence, the data historian market size in 2026 is estimated at USD 1.41 billion, growing from 2025 value of USD 1.32 billion with 2031 projections showing USD 1.99 billion, growing at 7.05% CAGR over 2026-2031.
This report is Segmented by Component (Software, Services), by Deployment Mode (On-Premise, Cloud), by End-User (Oil and Gas, Power and Utilities, Paper and Pulp, Chemicals and Petrochemicals, Metals and Mining, and More), by Data Frequency (Real-Time, Near-Real-Time, and Batch/Periodic), and by Geography. The Market Sizes and Forecasts are Provided in Terms of Value (USD).
Global Data Historian Market Trends and Insights
Increasing Demand for Consolidated Data to Optimize Industrial Performance
Manufacturing groups are replacing siloed storage silos with unified historian platforms that merge production, maintenance, and quality datasets. Procter & Gamble's adoption of GE Vernova's cloud historian illustrates a 50% reduction in process-setup time through integrated asset and ERP data streams. Contextual data-modeling now automatically links disparate tags, helping operators pinpoint upstream causes of downstream quality deviations and report sustainability metrics with audit-ready lineage.
Rising Volumes of Industrial IoT Big Data Streams
Smart-sensor proliferation is lifting ingestion rates from thousands to millions of tags per second, straining traditional monolithic databases. China's industrial output expanded 5.6% year-on-year in May 2024, accompanied by a 10.0% surge in high-tech manufacturing, underscoring rapidly growing data loads that require compression algorithms and edge-analytics nodes.Vendors are responding with containerized micro-services that auto-scale and route non-critical packets to tier-two storage, preserving bandwidth at remote facilities.
High Total Cost of Ownership for Enterprise-Wide Historian Roll-Outs
End-to-end projects require licenses, specialized hardware, integration services, and ongoing upgrades that can inflate capital outlays by 300%. Rockwell Automation's FY 2024 results revealed a 21% revenue decline, reflecting hesitation to commit fresh budgets amid macro uncertainty. Hidden costs include tag rationalization, data cleansing, performance tuning, and workforce upskilling, constraining adoption among mid-tier manufacturers.
Other drivers and restraints analyzed in the detailed report include:
- Migration of Legacy Historians to Cloud-Native, Micro-Service Architectures
- Vendor Bundling of Historian Functionality Inside Full-Stack OT Platforms
- Cybersecurity Concerns Over Exposing OT Data to IT Networks/Cloud
For complete list of drivers and restraints, kindly check the Table Of Contents.
Segment Analysis
Software accounted for 65.60% of the data historian market share in 2025, validating preference for unified suites that blend collection, storage, analytics, and visualization. Vendors increasingly deliver subscription models that bundle time-series compression, asset models, and no-code dashboards, reducing tool sprawl inside plant networks. The services segment is advancing at a 8.85% CAGR through 2031 as operators enlist integration partners for OT-IT convergence, cybersecurity patching, and AI pipeline orchestration. HighByte's USD 12 million financing round showcased investor appetite for Industrial DataOps services that unlock historian data across multi-vendor fleets.
The data historian market size upside remains tied to managed-services adoption, where providers monetize continuous optimization, model retraining, and regulatory reporting. As customers outsource historian lifecycle management, specialist consultancies deepen domain differentiation in pharmaceuticals, energy, and food & beverage, boosting recurring revenue visibility and reinforcing the platform-plus-services paradigm of the data historian market.
On-premise deployments retained 70.90% of the data historian market in 2025 due to latency sensitivity, sovereignty mandates, and ingrained procurement habits in hazardous industries. Plants continue to upgrade rack-mounted appliances, deploy redundant fail-over clusters, and maintain air-gapped backup nodes. Simultaneously, cloud instances are gaining 8.20% CAGR as CIOs pursue elastic capacity, managed security postures, and micro-service agility. Regulatory bodies now publish guidance on hosting process data in approved public regions, diminishing historical barriers.
Hybrid topologies are becoming mainstream in the data historian market as organizations stream low-frequency tags to the cloud while preserving real-time loops locally. Cloud vendors provide edge gateways with deterministic fail-safe modes, encouraging shift-and-lift of historical datasets for AI model training. Over the forecast horizon, total cost of ownership comparisons will continue to favor consumption-based billing, hastening workload migration in discrete manufacturing and fast-growing electrification verticals.
Complete Report Scope:
- By Component
- Software
- Services
- By Deployment Mode
- On-premise
- Cloud
- By End-user Industry
- Oil and Gas
- Power and Utilities
- Chemicals and Petrochemicals
- Pulp and Paper
- Metals and Mining
- Water and Waste-water
- Data Centers
- Food and Beverages
- Pharmaceuticals
- By Data Frequency
- Real-time (<1 sec)
- Near-real-time (1 sec - 1 min)
- Batch / Periodic (>1 min)
- By Geography
- North America
- United States
- Canada
- Mexico
- South America
- Brazil
- Argentina
- Rest of South America
- Europe
- Germany
- United Kingdom
- France
- Italy
- Spain
- Russia
- Rest of Europe
- APAC
- China
- Japan
- India
- South Korea
- Australia and New Zealand
- Southeast Asia
- Rest of APAC
- Middle East
- Saudi Arabia
- UAE
- Turkey
- Rest of Middle East
- Africa
- South Africa
- Egypt
- Nigeria
- Rest of Africa
- North America
Geography Analysis
North America dominates the data historian market with 35.10% share in 2025, underwritten by large installed bases in oil & gas, power generation, and automotive assembly. Federal infrastructure programs and workforce modernization grants accelerate retrofits of aging DCS nodes into API-enabled historians. Siemens' USD 10 billion investments in Texas and California illustrate how OEM manufacturing and AI data-center growth reinforce domestic demand.
Asia-Pacific delivers the fastest CAGR at 8.25% through 2031 on the back of China's data-economy blueprint and Japan's advanced robotics initiatives. Hitachi and Microsoft plan to upskill 50,000 staff in generative-AI methodologies, highlighting the human-capital dimension of historian adoption. Indian policy incentives for semiconductor fabs and electric-vehicle battery plants further enlarge the regional pipeline of green-field historian installations. Also, Beijing's three-year action plan targets 20% annual data-industry growth and over 300 use-case demonstrations, highlighting strong policy support. Europe maintains steady contributions under reinforced GDPR 2024 mandates that formalize retention, audit, and transfer rules.
Europe records moderate growth as revised GDPR provisions and the Digital Operational Resilience Act compel firms to prove lineage, access controls, and immutability of industrial data. Energy-intensive industries adopt historians to certify carbon-footprint disclosures, while EU investment in hydrogen value chains triggers demand for high-frequency data capture across electrolyzer fleets. Emerging economies in Latin America, Middle East, and Africa remain nascent yet attractive long-term opportunities as they install new process plants without legacy constraints, enabling direct leapfrog to cloud-ready historian topologies within the data historian market.
List of Companies Covered in this Report:
- AVEVA Group plc (incl. PI System)
- Honeywell International Inc.
- Siemens AG
- General Electric Company
- ABB Group
- Emerson Electric Co.
- Rockwell Automation Inc.
- Schneider Electric SE
- Yokogawa Electric Corp.
- Aspen Technology Inc.
- Inductive Automation LLC
- Canary Labs Inc.
- ICONICS Inc.
- Mitsubishi Electric Corp.
- Kongsberg Digital AS
- Hitachi Energy Ltd.
- Open Automation Software LLC
- Wonderware (AVEVA)
- InduSoft (Schneider)
- Softing AG
Additional Benefits:
- The market estimate (ME) sheet in Excel format
- 3 months of analyst support
TABLE OF CONTENTS
1 INTRODUCTION
- 1.1 Study Assumptions and Market Definition
- 1.2 Scope of the Study
2 RESEARCH METHODOLOGY
3 EXECUTIVE SUMMARY
4 MARKET LANDSCAPE
- 4.1 Market Overview
- 4.2 Market Drivers
- 4.2.1 Increasing demand for consolidated data to optimize industrial performance
- 4.2.2 Rising volumes of industrial IoT big data streams
- 4.2.3 Migration of legacy historians to cloud-native, micro-service architectures
- 4.2.4 Vendor bundling of historian functionality inside full-stack OT platforms
- 4.2.5 Regulations mandating long-term process data retention in regulated industries
- 4.2.6 Rapid adoption of AI/ML requiring clean historical datasets
- 4.3 Market Restraints
- 4.3.1 High total cost of ownership for enterprise-wide historian roll-outs
- 4.3.2 Cyber-security concerns over exposing OT data to IT networks/cloud
- 4.3.3 Shortage of OT-IT convergence skillsets to manage historian projects
- 4.3.4 Vendor lock-in due to proprietary data models and licensing schemes
- 4.4 Value / Supply-Chain Analysis
- 4.5 Regulatory Landscape
- 4.6 Technological Outlook
- 4.7 Porter's Five Forces Analysis
- 4.7.1 Bargaining Power of Suppliers
- 4.7.2 Bargaining Power of Buyers
- 4.7.3 Threat of New Entrants
- 4.7.4 Threat of Substitutes
- 4.7.5 Intensity of Competitive Rivalry
- 4.8 Investment and Funding Analysis
5 MARKET SIZE AND GROWTH FORECASTS (VALUE)
- 5.1 By Component
- 5.1.1 Software
- 5.1.2 Services
- 5.2 By Deployment Mode
- 5.2.1 On-premise
- 5.2.2 Cloud
- 5.3 By End-user Industry
- 5.3.1 Oil and Gas
- 5.3.2 Power and Utilities
- 5.3.3 Chemicals and Petrochemicals
- 5.3.4 Pulp and Paper
- 5.3.5 Metals and Mining
- 5.3.6 Water and Waste-water
- 5.3.7 Data Centers
- 5.3.8 Food and Beverages
- 5.3.9 Pharmaceuticals
- 5.4 By Data Frequency
- 5.4.1 Real-time (<1 sec)
- 5.4.2 Near-real-time (1 sec - 1 min)
- 5.4.3 Batch / Periodic (>1 min)
- 5.5 By Geography
- 5.5.1 North America
- 5.5.1.1 United States
- 5.5.1.2 Canada
- 5.5.1.3 Mexico
- 5.5.2 South America
- 5.5.2.1 Brazil
- 5.5.2.2 Argentina
- 5.5.2.3 Rest of South America
- 5.5.3 Europe
- 5.5.3.1 Germany
- 5.5.3.2 United Kingdom
- 5.5.3.3 France
- 5.5.3.4 Italy
- 5.5.3.5 Spain
- 5.5.3.6 Russia
- 5.5.3.7 Rest of Europe
- 5.5.4 APAC
- 5.5.4.1 China
- 5.5.4.2 Japan
- 5.5.4.3 India
- 5.5.4.4 South Korea
- 5.5.4.5 Australia and New Zealand
- 5.5.4.6 Southeast Asia
- 5.5.4.7 Rest of APAC
- 5.5.5 Middle East
- 5.5.5.1 Saudi Arabia
- 5.5.5.2 UAE
- 5.5.5.3 Turkey
- 5.5.5.4 Rest of Middle East
- 5.5.6 Africa
- 5.5.6.1 South Africa
- 5.5.6.2 Egypt
- 5.5.6.3 Nigeria
- 5.5.6.4 Rest of Africa
- 5.5.1 North America
6 COMPETITIVE LANDSCAPE
- 6.1 Market Concentration
- 6.2 Strategic Moves
- 6.3 Market Share Analysis
- 6.4 Company Profiles (includes Global level overview, Market level overview, Core segments, Financials as available, Strategic information, Market rank/share for key companies, Products and Services, and Recent Developments)
- 6.4.1 AVEVA Group plc (incl. PI System)
- 6.4.2 Honeywell International Inc.
- 6.4.3 Siemens AG
- 6.4.4 General Electric Company
- 6.4.5 ABB Group
- 6.4.6 Emerson Electric Co.
- 6.4.7 Rockwell Automation Inc.
- 6.4.8 Schneider Electric SE
- 6.4.9 Yokogawa Electric Corp.
- 6.4.10 Aspen Technology Inc.
- 6.4.11 Inductive Automation LLC
- 6.4.12 Canary Labs Inc.
- 6.4.13 ICONICS Inc.
- 6.4.14 Mitsubishi Electric Corp.
- 6.4.15 Kongsberg Digital AS
- 6.4.16 Hitachi Energy Ltd.
- 6.4.17 Open Automation Software LLC
- 6.4.18 Wonderware (AVEVA)
- 6.4.19 InduSoft (Schneider)
- 6.4.20 Softing AG
7 MARKET OPPORTUNITIES AND FUTURE OUTLOOK
- 7.1 White-space and Unmet-need Assessment

 數據歷史資料庫市場—2026-2032年全球市場預測
 資料歷史資料庫市場規模、佔有率和成長分析:按部署類型、資料來源、最終用戶產業、企業規模、應用程式、交付方式和地區分類-2026-2033年產業預測
 2026年全球數據歷史資料庫市場報告
 數據歷史資料庫市場 - 全球產業規模、佔有率、趨勢、機會、預測:按組件、部署模式、最終用戶、地區和競爭格局分類,2021-2031 年
 資料歷史資料庫市場規模、佔有率、成長及全球產業分析:依類型、應用和地區劃分的洞察與未來預測(2026-2034)全球資料歷史學家市場 – 全球產業分析、規模、佔有率、成長、趨勢、預測 (2031)