


 |
市場調查報告書
商品編碼
2124449
柴油燃料:市場佔有率分析、行業趨勢和統計數據、成長預測(2026-2031)Diesel As Fuel - Market Share Analysis, Industry Trends & Statistics, Growth Forecasts (2026 - 2031) |
||||||

※ 本網頁內容可能與最新版本有所差異。詳細情況請與我們聯繫。
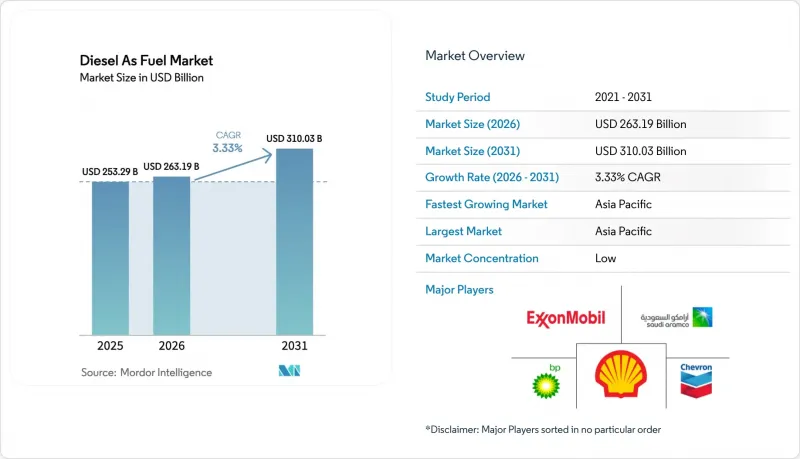
據 Mordor Intelligence 稱,2025 年柴油燃料市場價值為 2,532.9 億美元,預計到 2031 年將達到 3,100.3 億美元,而 2026 年為 2,631.9 億美元,預測期(2026-2031 年)的複合年成長率為 3.33%。
本報告按等級(超低硫柴油、低硫柴油、高硫柴油、生物柴油混合燃料、合成柴油)、應用領域(交通運輸、船舶、工業/建築、農業、發電)和地區(北美、歐洲、亞太、南美、中東和非洲)進行細分。市場規模和預測均以美元計價。
全球柴油燃料市場趨勢及洞察
亞洲新興國家卡車和巴士數量迅速成長
預計2025年,印度、印尼和越南的商用車註冊量將成長11%,超過GDP成長速度,這主要得益於電子商務和冷鏈物流業務向大都會圈擴張。印度的巴拉特馬拉高速公路計畫將新建4,200公里高速公路,將促使營運商採用每噸公里油耗高出18%的重型卡車。東南亞國協推遲實施歐V排放氣體標準意味著柴油引擎在客車市場仍佔據主導地位,預計至少到2029年,柴油需求仍將保持強勁。柴油貨運正透過中國的「一帶一路」走廊流入中亞,由於該地區充電基礎設施不發達,柴油比液化天然氣(LNG)具有30%的成本優勢。這些因素共同推動了全部區域的需求,並為柴油燃料市場創造了結構性利好。
資料中心擴建導致緊急電力需求激增。
預計到2025年,超大規模資料中心業者將運作18吉瓦的資料中心容量,但為了確保99.999%的運轉率,每兆瓦容量大約需要120萬公升的現場柴油儲存。亞馬遜網路服務(AWS)和微軟Azure目前指定使用十六烷值50或更高的超低硫柴油(ULSD),以限制發電機測試期間的顆粒物排放,從而提高了整個行業的採購標準。在印度和撒哈拉以南非洲部分地區等電網可靠性仍然較低的地區,發電機組持續運行,每個設施的年用量超過800萬升。國際能源總署(IEA)預測,到2028年,資料中心備用柴油的需求將以每年9.2%的速度成長,這凸顯了儘管採取了廣泛的脫碳政策,柴油燃料市場仍然具有韌性。
城市公車快速電氣化
2024年,深圳將其全部16,000輛公車更換為純電動公車,每年減少柴油消耗3.45億公升。這項舉措成為其他主要城市效仿的標竿。倫敦於2025年訂購了500輛電動雙層巴士,作為2030年前逐步淘汰柴油車輛計畫的一部分。到2025年,電動公車在全球都市區公車採購的佔比將達到28%,高於2022年的12%,這主要得益於電池成本降至每千瓦時100美元以下以及充電網路的快速發展。同時,由於續航里程的限制,長途和農村線路仍然嚴重依賴柴油車輛,這造成了都市區需求被壓縮而郊區需求持續成長的局面。這對柴油燃料市場產生了複雜的影響。
細分市場分析
隨著監理協議收緊排放標準,含硫量低於15ppm的超低硫柴油(ULSD)在2025年佔市場需求的67.5%。含硫量在15-500ppm範圍內的低硫柴油市場仍面臨煉油資產投資不足的問題,而高硫柴油預計到2028年將萎縮至不到3%的小眾市場。受巴西B15強制摻混、歐盟可再生能源配額以及美國各州稅收優惠政策的推動,B5至B20生物柴油混合燃料市場正以每年7.5%的速度成長。預計2031年,生質柴油混合燃料市場規模將達到720億美元,並將與傳統超低硫柴油(ULSD)共同發展壯大。合成柴油目前仍處於試點階段,但2025年籌集的12億美元創業投資資金顯示其商業化前景光明。
超低硫柴油(ULSD)的溢價抵消了每桶2-3美元的加氫成本,使擁有先進脫硫能力的煉油廠受益。脂肪酸甲酯的混合使用推動了對高十六烷值基礎油的需求,這類基礎油具有良好的氧化穩定性,從而提高了擁有加氫裂解裝置的煉油廠的盈利能力。合成柴油因其生命週期排放量降低85%,被定位為符合碳排放強度上限規定的車隊的合規手段,但其每公升1.80美元的生產成本目前限制了其在高價值細分市場的普及。總體而言,燃料等級的變化表明,環境法規正在重塑柴油燃料市場的價值結構。
區域分析
到2025年,亞太地區將佔全球柴油消費量的42.1%,預計2031年將以每年3.9%的速度成長。在印度,高速公路的擴建和「專用貨運走廊」計畫正將柴油卡車引入服務不足的地區。同時,當地煉油廠已將其超低硫柴油(ULSD)產能提高了12%,以滿足印度第六階段排放標準(Bharat Stage VI)。在中國的一線城市,隨著電動公車的普及,柴油需求正在下降,但由於充電基礎設施不完善,城際貨運仍高度依賴柴油燃料。東南亞國協,特別是印尼和越南,由於歐III引擎的合法性以及電子商務帶來的車輛數量成長,保持了成長勢頭。澳洲的採礦業支撐著對高十六烷值柴油的需求,即使全部區域的脫碳壓力不斷增加,其消費量也保持穩定。
在歐洲,受碳定價機制、低排放氣體區和車輛電氣化的影響,乘用車消費量預計將以每年1.8%的速度下降。德國、法國和英國主導了這一降幅,而重型卡車和船用燃料油的需求則穩定了整體需求。歐盟的《可再生能源指令III》正在加速生質柴油和合成柴油的普及,其中德國和荷蘭擁有大部分先導工廠。由於美國、墨西哥和加拿大之間走廊的強勁貨運量以及資料中心備份需求的不斷成長,北美預計將成長2.1%。到2025年,東岸煉油廠的關閉將導致餾分油庫存緊張,進而引發創紀錄的進口量,並凸顯供應鏈的脆弱性。
南美洲和中東地區正在崛起為成長中心。在巴西,強制使用B15混合燃料和機械化農業正在推動需求成長;而在阿根廷,瓦卡穆爾塔頁岩油氣田的繁榮發展帶動了鑽井作業對柴油需求的成長。沙烏地阿拉伯和阿拉伯聯合大公國(阿拉伯聯合大公國)正在提高超低硫柴油(ULSD)的產能,以滿足國內需求並擴大對非洲和南亞的出口,充分利用其原料成本優勢。撒哈拉以南非洲仍然是一個尚未開發的市場,該地區柴油燃料用於發電、灌溉和採礦,但基礎設施的匱乏阻礙了其發展。雖然南非向歐V排放標準的過渡提高了品質標準,但在主要城市以外的地區,法規的執行力度並不一致,尚未實現完全合規。
其他好處:
- Excel格式的市場預測(ME)表
- 3個月的分析師支持
目錄
第1章:引言
- 研究假設和市場定義
- 調查範圍
第2章:調查方法
第3章執行摘要
第4章 市場狀況
- 市場概覽
- 市場促進因素
- 亞洲新興國家卡車和巴士數量迅速成長
- 資料中心擴建導致緊急電源需求激增。
- 疫情後全球航運貨物噸英里數的復甦
- 政府強制推行超低硫柴油(ULSD)。
- 歐洲合成電子柴油示範計畫增加
- 採礦業從煤炭到高十六烷值柴油混合燃料的過渡
- 市場限制因素
- 城市公車快速電氣化
- 經合組織國家的嚴格碳定價體系
- 人工智慧驅動的最佳化路線規劃可降低長途運輸中的柴油燃料消耗。
- 投資者正擴大撤出石化燃料煉製企業。
- 供應鏈分析
- 監理情勢
- 技術展望
- 波特五力模型
第5章 市場規模與成長預測
- 按年級
- 超低硫柴油(低於15ppm)
- 低硫柴油(15-500 ppm)
- 高硫柴油(超過 500 ppm)
- 生物柴油混合燃料(B5-B20)
- 合成柴油
- 透過使用
- 運輸
- 海上
- 工業與建築
- 農業
- 發電
- 按地區
- 北美洲
- 美國
- 加拿大
- 墨西哥
- 歐洲
- 德國
- 英國
- 法國
- 義大利
- 北歐國家
- 俄羅斯
- 其他歐洲國家
- 亞太地區
- 中國
- 印度
- 日本
- 韓國
- 東南亞國協
- 澳洲和紐西蘭
- 其他亞太國家
- 南美洲
- 巴西
- 阿根廷
- 哥倫比亞
- 其他南美國家
- 中東和非洲
- 沙烏地阿拉伯
- 阿拉伯聯合大公國
- 南非
- 埃及
- 其他中東和非洲國家
- 北美洲
第6章 競爭情勢
- 市場集中度
- 策略趨勢(併購、聯盟、購電協議)
- 市場佔有率分析(主要公司的市場排名和佔有率)
- 公司簡介
- Exxon Mobil
- Chevron
- Shell
- BP
- TotalEnergies
- Saudi Aramco
- Sinopec
- PetroChina
- Rosneft
- Lukoil
- ENI
- Petrobras
- Kuwait Petroleum
- QatarEnergy
- Indian Oil Corp
- Bharat Petroleum
- Reliance Industries
- Valero Energy
- Marathon Petroleum
- SK Energy
第7章 市場機會與未來展望
According to Mordor Intelligence, the diesel as fuel market size was valued at USD 253.29 billion in 2025 and is estimated to grow from USD 263.19 billion in 2026 to reach USD 310.03 billion by 2031, at a CAGR of 3.33% during the forecast period (2026-2031).
This report is Segmented by Grade (Ultra-Low Sulfur Diesel, Low-Sulfur Diesel, High-Sulfur Diesel, Biodiesel Blends, and Synthetic Diesel), Application (Transportation, Marine, Industrial and Construction, Agriculture, and Power Generation), and Geography (North America, Europe, Asia-Pacific, South America, and Middle East and Africa). The Market Sizes and Forecasts are Provided in Terms of Value (USD).
Global Diesel As Fuel Market Trends and Insights
Rapid Truck & Bus Fleet Growth in Emerging Asia
Commercial vehicle registrations in India, Indonesia, and Vietnam climbed 11% in 2025, outstripping GDP growth as e-commerce and cold-chain logistics widen beyond metro hubs. India's Bharatmala highway program added 4,200 km of expressways, encouraging operators to deploy heavier trucks that consume 18% more fuel per ton-kilometer. ASEAN delays in adopting Euro-V emission norms keep diesel engines dominant for buses, effectively locking in demand through at least 2029. China's Belt and Road corridors channel diesel-powered freight into Central Asia, where sparse charging infrastructure preserves a 30% cost edge over liquefied natural gas. Together, these factors lift regional demand and provide a structural tailwind for the diesel fuel market.
Surging Demand for Backup Power in Data-Center Buildouts
Hyperscalers commissioned 18 GW of data-center capacity in 2025, and each megawatt requires roughly 1.2 million L of on-site diesel storage to guarantee 99.999% uptime. Amazon Web Services and Microsoft Azure now specify ULSD with cetane above 50 to limit particulate emissions during generator tests, raising procurement standards industry-wide. Where grids remain unreliable, such as in India and parts of sub-Saharan Africa, gensets run continuously, driving per-facility use above 8 million L annually. The International Energy Agency forecasts 9.2% annual diesel demand growth from data-center backup through 2028, reinforcing the diesel fuel market's resilience despite broader decarbonization policies.
Rapid Electrification of City Bus Fleets
Shenzhen converted its 16,000-bus fleet to battery-electric in 2024, displacing 345 million L of diesel annually and setting a standard replicated by other tier-1 cities. London ordered 500 electric double-deckers in 2025 as part of a diesel phase-out by 2030. Electric buses captured 28% of 2025 global urban procurements, up from 12% in 2022, driven by battery costs below USD 100/kWh and dense charging networks. Intercity and rural routes remain diesel-reliant due to range limits, creating a split that compresses urban demand yet sustains growth in peri-urban segments, with mixed implications for the diesel fuel market.
Other drivers and restraints analyzed in the detailed report include:
- Post-Pandemic Rebound in Global Marine Freight Ton-Miles
- Government-Mandated ULSD Adoption
- Stringent Carbon-Pricing Schemes in OECD Economies
For complete list of drivers and restraints, kindly check the Table Of Contents.
Segment Analysis
ULSD below 15 ppm sulfur captured 67.5% of 2025 demand as regulators converged on tighter emission standards. Low-sulfur diesel in the 15-500 ppm tier lingers in markets with under-invested refinery assets, while high-sulfur grades shrink to a sub-3% niche by 2028. Biodiesel blends from B5 to B20 are advancing 7.5% annually on the back of Brazil's B15 mandate, EU renewable quotas, and U.S. state tax incentives. The diesel fuel market size for biodiesel blends is projected to reach USD 72 billion by 2031, expanding its footprint alongside conventional ULSD. Synthetic diesel remains pilot-scale, yet USD 1.2 billion in 2025 venture funding signals a pathway to commercialization.
Premium pricing on ULSD offsets USD 2-3/bbl hydrotreating costs, rewarding refiners with deep desulfurization capacity. Blending of fatty-acid methyl esters drives demand for high-cetane base stocks that maintain oxidative stability, providing a margin uplift for hydrocracking-equipped plants. Synthetic diesel's 85% lower life-cycle emissions position it as a compliance lever for fleets under carbon-intensity caps, though USD 1.80/L production costs presently confine uptake to high-value niches. Collectively, grade shifts illustrate how environmental mandates are reshaping value pools within the diesel fuel market.
Complete Report Scope:
- By Grade
- Ultra-Low Sulfur Diesel (Less than 15 ppm)
- Low-Sulfur Diesel (15 to 500 ppm)
- High-Sulfur Diesel (Over 500 ppm)
- Biodiesel Blends (B5 to B20)
- Synthetic Diesel
- By Application
- Transportation
- Marine
- Industrial and Construction
- Agriculture
- Power Generation
- By Geography
- North America
- United States
- Canada
- Mexico
- Europe
- Germany
- United Kingdom
- France
- Italy
- NORDIC Countries
- Russia
- Rest of Europe
- Asia-Pacific
- China
- India
- Japan
- South Korea
- ASEAN Countries
- Australia and New Zealand
- Rest of Asia-Pacific
- South America
- Brazil
- Argentina
- Colombia
- Rest of South America
- Middle East and Africa
- Saudi Arabia
- United Arab Emirates
- South Africa
- Egypt
- Rest of Middle East and Africa
- North America
Geography Analysis
Asia-Pacific accounted for 42.1% of 2025 global consumption and is set to grow 3.9% annually through 2031. India's highway expansion and Dedicated Freight Corridor projects channel diesel trucks into underserved regions, while local refiners added 12% ULSD capacity to align with Bharat Stage VI norms. China's tier-1 cities watch demand slide as electric buses proliferate, yet intercity freight remains diesel-intensive due to sparse charging infrastructure. ASEAN economies, notably Indonesia and Vietnam, sustain growth because Euro-III engines remain legal, and e-commerce fuels fleet additions. Australia's mining sector anchors high-cetane diesel demand, preserving volume despite broader regional decarbonization pressures.
Europe experiences a 1.8% annual contraction as carbon pricing, low-emission zones, and fleet electrification shrink passenger-vehicle consumption. Germany, France, and the U.K. lead the decline, though heavy-duty trucking and marine bunker fuel stabilize aggregate demand. EU Renewable Energy Directive III boosts biodiesel and synthetic diesel uptake, with Germany and the Netherlands hosting most pilot plants. North America grows 2.1% on robust freight along the U.S.-Mexico-Canada corridor and escalating data-center backup needs. East Coast refinery closures tightened distillate stocks in 2025, prompting record imports and underscoring supply-chain exposure.
South America and the Middle East emerge as growth pockets. Brazil's B15 mandate and mechanized farming push volumes upward, while Argentina's Vaca Muerta shale boom lifts diesel for drilling operations. Saudi Arabia and the UAE increase ULSD capacity to satisfy domestic demand and export to Africa and South Asia, leveraging feedstock cost advantages. Sub-Saharan Africa remains a frontier, with diesel powering generators, irrigation, and mining, yet infrastructure gaps temper expansion. South Africa's transition to Euro-V standards raises quality benchmarks, but uneven enforcement outside major cities limits full compliance.
- Exxon Mobil
- Chevron
- Shell
- BP
- TotalEnergies
- Saudi Aramco
- Sinopec
- PetroChina
- Rosneft
- Lukoil
- ENI
- Petrobras
- Kuwait Petroleum
- QatarEnergy
- Indian Oil Corp
- Bharat Petroleum
- Reliance Industries
- Valero Energy
- Marathon Petroleum
- SK Energy
Additional Benefits:
- The market estimate (ME) sheet in Excel format
- 3 months of analyst support
TABLE OF CONTENTS
1 Introduction
- 1.1 Study Assumptions & Market Definition
- 1.2 Scope of the Study
2 Research Methodology
3 Executive Summary
4 Market Landscape
- 4.1 Market Overview
- 4.2 Market Drivers
- 4.2.1 Rapid truck & bus fleet growth in emerging Asia
- 4.2.2 Surging demand for backup power in data-center buildouts
- 4.2.3 Post-pandemic rebound in global marine freight ton-miles
- 4.2.4 Government-mandated ultra-low-sulfur diesel (ULSD) adoption
- 4.2.5 Rise of synthetic e-diesel pilots in Europe
- 4.2.6 Mining sector's shift from coal to high-cetane diesel blends
- 4.3 Market Restraints
- 4.3.1 Rapid electrification of city bus fleets
- 4.3.2 Stringent carbon-pricing schemes in OECD economies
- 4.3.3 AI-optimised route planning cutting long-haul diesel usage
- 4.3.4 Growing investor divestment from fossil-fuel refining
- 4.4 Supply-Chain Analysis
- 4.5 Regulatory Landscape
- 4.6 Technological Outlook
- 4.7 Porter's Five Forces
- 4.7.1 Bargaining Power of Suppliers
- 4.7.2 Bargaining Power of Buyers
- 4.7.3 Threat of New Entrants
- 4.7.4 Threat of Substitute Products
- 4.7.5 Competitive Rivalry
5 Market Size & Growth Forecasts
- 5.1 By Grade
- 5.1.1 Ultra-Low Sulfur Diesel (Less than 15 ppm)
- 5.1.2 Low-Sulfur Diesel (15 to 500 ppm)
- 5.1.3 High-Sulfur Diesel (Over 500 ppm)
- 5.1.4 Biodiesel Blends (B5 to B20)
- 5.1.5 Synthetic Diesel
- 5.2 By Application
- 5.2.1 Transportation
- 5.2.2 Marine
- 5.2.3 Industrial and Construction
- 5.2.4 Agriculture
- 5.2.5 Power Generation
- 5.3 By Geography
- 5.3.1 North America
- 5.3.1.1 United States
- 5.3.1.2 Canada
- 5.3.1.3 Mexico
- 5.3.2 Europe
- 5.3.2.1 Germany
- 5.3.2.2 United Kingdom
- 5.3.2.3 France
- 5.3.2.4 Italy
- 5.3.2.5 NORDIC Countries
- 5.3.2.6 Russia
- 5.3.2.7 Rest of Europe
- 5.3.3 Asia-Pacific
- 5.3.3.1 China
- 5.3.3.2 India
- 5.3.3.3 Japan
- 5.3.3.4 South Korea
- 5.3.3.5 ASEAN Countries
- 5.3.3.6 Australia and New Zealand
- 5.3.3.7 Rest of Asia-Pacific
- 5.3.4 South America
- 5.3.4.1 Brazil
- 5.3.4.2 Argentina
- 5.3.4.3 Colombia
- 5.3.4.4 Rest of South America
- 5.3.5 Middle East and Africa
- 5.3.5.1 Saudi Arabia
- 5.3.5.2 United Arab Emirates
- 5.3.5.3 South Africa
- 5.3.5.4 Egypt
- 5.3.5.5 Rest of Middle East and Africa
- 5.3.1 North America
6 Competitive Landscape
- 6.1 Market Concentration
- 6.2 Strategic Moves (M&A, Partnerships, PPAs)
- 6.3 Market Share Analysis (Market Rank/Share for key companies)
- 6.4 Company Profiles (includes Global level Overview, Market level overview, Core Segments, Financials as available, Strategic Information, Products & Services, and Recent Developments)
- 6.4.1 Exxon Mobil
- 6.4.2 Chevron
- 6.4.3 Shell
- 6.4.4 BP
- 6.4.5 TotalEnergies
- 6.4.6 Saudi Aramco
- 6.4.7 Sinopec
- 6.4.8 PetroChina
- 6.4.9 Rosneft
- 6.4.10 Lukoil
- 6.4.11 ENI
- 6.4.12 Petrobras
- 6.4.13 Kuwait Petroleum
- 6.4.14 QatarEnergy
- 6.4.15 Indian Oil Corp
- 6.4.16 Bharat Petroleum
- 6.4.17 Reliance Industries
- 6.4.18 Valero Energy
- 6.4.19 Marathon Petroleum
- 6.4.20 SK Energy
7 Market Opportunities & Future Outlook
- 7.1 White-space & Unmet-Need Assessment


