


 |
市場調查報告書
商品編碼
2124403
服務整合與管理:市場佔有率分析、產業趨勢與統計、成長預測(2026-2031)Service Integration And Management - Market Share Analysis, Industry Trends & Statistics, Growth Forecasts (2026 - 2031) |
||||||

※ 本網頁內容可能與最新版本有所差異。詳細情況請與我們聯繫。
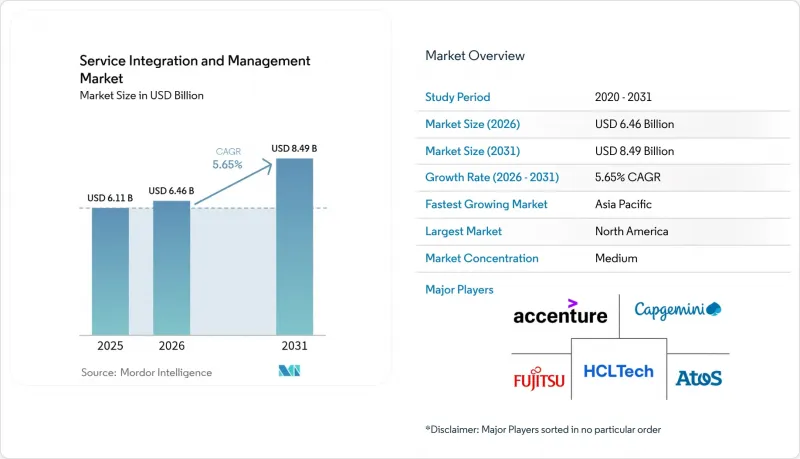
據 Mordor Intelligence 稱,全球服務整合和管理市場預計到 2026 年價值 64.6 億美元,高於 2025 年的 61.1 億美元,預計到 2031 年將達到 84.9 億美元。
預計 2026 年至 2031 年的複合年成長率為 5.65%。
本報告按元件(解決方案和服務)、服務模式(單一供應商模式、混合供應商模式及其他)、部署模式(本地部署、公共雲端及其他)、組織規模(中小企業和大型企業)、最終用戶產業(銀行、金融服務和保險 (BFSI)、IT 和電信及其他)以及地區進行細分。市場預測以美元 (USD) 為單位。
全球服務整合與管理市場趨勢及洞察
多供應商IT外包的複雜性日益增加。
企業通常需要管理 5 到 7 家主要 IT 供應商以及眾多細分領域的供應商,這導致整合點數量呈指數級成長,而傳統的供應商管理方式難以有效控制這些整合點。 IBM 2024 年的一項研究表明,擁有四家或更多主要供應商的企業,其營運成本會增加 40%,災難復原時間會增加 60% 到 80%,這凸顯了管治帶來的財務風險。 SIAM 平台透過建立集中式可見性、標準化 KPI 和衝突規避協議,消除推諉責任,加快根本原因識別,並加強整個供應商生態系統的合規性審計追蹤。
雲端原生微服務架構的激增
儘管 Kubernetes 的採用率預計到 2024 年將達到 96%,但容器化工作負載正在本地叢集和多個公共雲端之間創建短暫的服務相依性。在這種瞬息萬變的環境中,傳統的 ITSM 目錄正逐漸過時。現代 SIAM 解決方案整合了即時服務發現、自動化依賴關係映射和主動編配,能夠動態調整效能基準以擴展微服務,從而確保即使在基礎設施頻繁變更的情況下也能提供一致的用戶體驗。
具備SIAM技能的專家短缺
在北美和歐洲,對SIAM人才的需求比供應高出約40%,導致許多專案的引進週期延長至18至24個月。高技能的從業人員擁有深厚的IT服務管理(ITSM)專業知識、精通雲端架構以及強大的供應商談判技巧,但這類人才十分稀缺。企業正試圖透過建立內部學院和支持外部認證來彌補這一缺口,但短期的人才短缺推高了成本結構,並延緩了價值實現的時間。
細分市場分析
由於諮詢驅動的變革管理項目,服務部門在2025年佔總收入的58.92%。然而,以平台為中心的解決方案正以6.42%的複合年成長率快速擴張,顯示隨著多供應商生態系統的擴展,企業正在向自動化轉型。預計到2031年,服務整合和管理解決方案市場規模將達到36.4億美元。這反映出市場對預先建構管治引擎的強勁需求,這些引擎可以減少對稀缺人力資源的依賴。人工智慧驅動的編配模組、API優先架構和即用型合規套件使得技術投資比持續的諮詢成本更具吸引力,因為它們可以縮短設定時間並支援自助部署。
企業正日益將輕量級諮詢服務與訂閱式平台結合,從而將知識轉移與可重複的自動化流程整合起來。這種混合支出模式正在推動系統整合商的永續成長,這些整合商提供的是解決方案加速器,而非單純的諮詢服務。
隨著成熟度的提高,假設目前的採用曲線繼續保持,從長遠來看,該解決方案在服務整合和管理市場的市場佔有率預計將超過服務本身的市場佔有率。
到2025年,與混合型供應商簽訂的合約將佔總收入的39.20%,從而在內部管理和針對特定技能的選擇性外包之間保持平衡。然而,隨著公司正式建立內部SIAM卓越中心,內部服務整合商模式的成長速度超過了所有其他競爭對手,年複合成長率達到7.29%。這主要得益於認證培訓機會的增加、工具複雜性的降低,以及經營團隊對服務整合作為策略核心能力的認知。
在面臨預算嚴重受限和人才短缺的行業,尤其是受嚴格監管行業的中型企業中,與外部服務整合商簽訂合約仍然十分普遍。對員工技能發展和自動化技術的持續投入,可能會導致企業在預測期內更加重視內部管治。這與董事會要求加強對第三方風險監管的指示一致。
區域分析
北美地區憑藉其在領先地位、豐富的SIAM人才儲備以及SOX和HIPAA等嚴格的監管要求,預計到2025年將保持35.91%的市場佔有率。 5.14%的複合年成長率表明,隨著企業對舊有系統進行現代化改造並整合多重雲端策略,投資將持續成長。成熟的諮詢生態系統和充足的採購預算為先進的大規模部署提供了支持,鞏固了該地區作為創新中心的地位。
亞太地區是成長最快的地區,預計到2031年複合年成長率將達到6.98%。印度、中國和東協主要國家的國家級數位經濟計畫正在推動多供應商轉型項目,而傳統的IT服務管理(ITSM)流程無法應對這些項目。外國直接投資和超大規模資料中心業者資料中心的擴張進一步加劇了服務鏈的複雜性,並加速了對服務整合與存取管理(SIAM)的需求。在日本和韓國,精益營運模式已經成熟,這些國家的企業正在將SIAM整合到其DevOps流程中,以增強跨供應商的課責。
在歐洲,受GDPR、新的人工智慧法規以及更嚴格的第三方風險需求的推動,SIAM的採用率正以每年5.71%的穩定成長。 ISO 20000認證促進了供應商之間標準的統一,而英國脫歐帶來的資料流不確定性則加劇了對透明管治的需求。德國和英國在SIAM的採用方面處於領先地位,而東歐企業正在加速採用,以滿足歐盟的協調目標。永續性指令正在將環境績效納入供應商評估標準,從而擴展了SIAM的關鍵績效指標,使其不再局限於成本和運作。
其他好處
- Excel格式的市場預測(ME)表
- 3個月的分析師支持
目錄
第1章:引言
- 研究假設和市場定義
- 調查範圍
第2章:調查方法
第3章執行摘要
第4章 市場狀況
- 市場概覽
- 市場促進因素
- 多供應商IT外包的複雜性日益增加。
- 雲端原生微服務架構的激增
- 整合式SLA管治平台的需求日益成長
- 加速受監管產業的數位轉型
- 引入混合工作營運模式
- 引入AIOps實現主動服務編配
- 市場限制因素
- 具備SIAM技能的專家短缺
- 缺乏全球標準化的服務水準協議框架
- 與傳統工具鏈互通性相關的挑戰
- 人們普遍認為,企業已經失去了對供應商的直接控制權。
- 產業價值鏈分析
- 監理情勢
- 技術展望
- 波特五力分析
- 宏觀經濟因素的影響
第5章 市場規模與成長預測
- 按組件
- 解決方案
- 商業解決方案
- 技術解決方案
- 服務
- 解決方案
- 按服務模式
- 單一提供者模式
- 混合型提供者模式
- 內部服務整合商模式
- 外部服務整合商模式
- 部署模式
- 現場
- 公共雲端
- 私有雲端
- 混合雲端
- 按組織規模
- 小型企業
- 大公司
- 按最終用戶行業分類
- 銀行、金融服務和保險(BFSI)
- 資訊科技/通訊
- 衛生保健
- 零售
- 製造業
- 政府/公共部門
- 其他
- 按地區
- 北美洲
- 美國
- 加拿大
- 墨西哥
- 南美洲
- 巴西
- 阿根廷
- 其他南美國家
- 歐洲
- 德國
- 英國
- 法國
- 義大利
- 西班牙
- 其他歐洲國家
- 亞太地區
- 中國
- 日本
- 印度
- 韓國
- 東南亞
- 其他亞太國家
- 中東
- 沙烏地阿拉伯
- 阿拉伯聯合大公國
- 土耳其
- 其他中東國家
- 非洲
- 南非
- 奈及利亞
- 其他非洲地區
- 北美洲
第6章 競爭情勢
- 市場集中度
- 策略趨勢
- 市佔率分析
- 公司簡介
- Accenture plc
- AtoS SE
- Capgemini SE
- Fujitsu Limited
- HCL Technologies Limited
- Hewlett Packard Enterprise Company
- International Business Machines Corporation
- Infosys Limited
- Mindtree Limited
- Tata Consultancy Services Limited
- Wipro Limited
- CGI Inc.
- DXC Technology Company
- NTT Data Corporation
- ServiceNow Inc.
- Sopra Steria Group SA
- Tech Mahindra Limited
- Unisys Corporation
- Rackspace Technology Inc.
- Orange Business Services SA
- Cognizant Technology Solutions Corporation
第7章 市場機會與未來展望
According to Mordor Intelligence, the global service integration and management market size in 2026 is estimated at USD 6.46 billion, growing from 2025 value of USD 6.11 billion with 2031 projections showing USD 8.49 billion, growing at 5.65% CAGR over 2026-2031.
This report is Segmented by Component (Solutions and Services), Service Model (Single-Provider Model, Hybrid-Provider Model, and More), Deployment Mode (On-Premise, Public Cloud, and More), Organization Size (Small and Medium Enterprises and Large Enterprises), End-User Industry (BFSI, IT and Telecom, and More), and Geography. The Market Forecasts are Provided in Terms of Value (USD).
Global Service Integration And Management Market Trends and Insights
Rising Multi-Vendor IT Outsourcing Complexity
Enterprises typically manage 5-7 major IT providers plus multiple niche vendors, generating exponential integration touchpoints that legacy vendor management cannot control effectively. IBM's 2024 study reveals that organizations with four or more primary providers incur 40% higher operational overhead and 60-80% longer outage resolution times, underscoring the financial risks associated with fragmented governance. SIAM platforms establish single-pane visibility, standardized KPIs, and dispute-avoidance protocols that eliminate finger-pointing, accelerate root-cause isolation, and strengthen compliance audit trails across the vendor ecosystem.
Surge in Cloud-Native Microservices Architectures
Kubernetes penetration reached 96% in 2024, yet containerized workloads spawn transient service dependencies spanning on-premises clusters and multiple public clouds. Conventional ITSM catalogs become obsolete in this fluid landscape. Modern SIAM solutions embed real-time service discovery, automated dependency mapping, and policy-driven orchestration that dynamically recalibrates performance baselines as microservices scale, ensuring a consistent user experience despite frequent infrastructure changes.
Shortage of SIAM-Skilled Professionals
The demand for SIAM talent outstrips supply by roughly 40% in North America and Europe, resulting in extended implementation cycles of 18-24 months for many programs. Effective practitioners blend deep ITSM expertise, cloud architecture fluency, and vendor-negotiation acuity capabilities rarely found in a single resource. Enterprises are establishing internal academies and sponsoring external certifications to close the gap, yet near-term capacity constraints inflate cost structures and slow time-to-value.
Other drivers and restraints analyzed in the detailed report include:
- Growing Demand for Unified SLA Governance Platforms
- Acceleration of Digital Transformation in Regulated Industries
- Absence of Global Standardized SLA Frameworks
For complete list of drivers and restraints, kindly check the Table Of Contents.
Segment Analysis
The services tranche accounted for 58.92% of 2025 revenue, thanks to consulting-heavy change-management engagements. However, platform-centric solutions are scaling faster at a 6.42% CAGR, signaling an enterprise pivot toward automation as multi-vendor ecosystems expand. The service integration and management market size for solutions is forecast to hit USD 3.64 billion by 2031, reflecting a strong appetite for pre-built governance engines that lower dependency on scarce human expertise. AI-driven orchestration modules, API-first architectures, and out-of-the-box compliance packs cut configuration time and support self-service onboarding, making technology investments more attractive than ongoing consultancy fees.
Enterprises are increasingly combining lightweight advisory engagements with subscription platforms, thereby blending knowledge transfer and repeatable automation. This hybrid spend pattern underpins sustained growth for system integrators offering solution accelerators rather than pure consulting hours.
As maturity rises, the service integration and management market share of solutions is poised to overtake services in the longer term if current adoption curves persist.
Hybrid-provider arrangements accounted for 39.20% of 2025 revenue, striking a balance between internal stewardship and selective outsourcing for niche skills. Yet the internal service integrator model is outpacing all peers, advancing at a 7.29% CAGR as organizations formalize in-house SIAM centers of excellence. Catalysts include increased access to certified training, declining tooling complexity, and executive recognition that service integration constitutes a strategic core competence.
External service integrator contracts still flourish where budget constraints or talent shortages prevail, particularly among mid-market firms in highly regulated sectors. Nevertheless, continuous investment in workforce upskilling and automation may tilt the mix toward internal governance over the forecast period, aligning with board-level mandates for tighter oversight of third-party risk.
Complete Report Scope:
- By Component
- Solutions
- Business Solutions
- Technology Solutions
- Services
- Solutions
- By Service Model
- Single-Provider Model
- Hybrid-Provider Model
- Internal Service Integrator Model
- External Service Integrator Model
- By Deployment Mode
- On-Premise
- Public Cloud
- Private Cloud
- Hybrid Cloud
- By Organization Size
- Small and Medium Enterprises
- Large Enterprises
- By End-User Industry
- Banking, Financial Services and Insurance (BFSI)
- Information Technology and Telecom
- Healthcare
- Retail
- Manufacturing
- Government and Public Sector
- Other End-User Industries
- By Geography
- North America
- United States
- Canada
- Mexico
- South America
- Brazil
- Argentina
- Rest of South America
- Europe
- Germany
- United Kingdom
- France
- Italy
- Spain
- Rest of Europe
- Asia Pacific
- China
- Japan
- India
- South Korea
- South-East Asia
- Rest of Asia Pacific
- Middle East
- Saudi Arabia
- United Arab Emirates
- Turkey
- Rest of Middle East
- Africa
- South Africa
- Nigeria
- Rest of Africa
- North America
Geography Analysis
North America maintained its leadership position with a 35.91% share in 2025, driven by early-mover enterprise adoption, an abundance of SIAM talent, and stringent regulatory requirements such as SOX and HIPAA. Growth at a 5.14% CAGR indicates sustained investment as companies modernize legacy estates and integrate multi-cloud strategies. Mature consultancy ecosystems and favorable procurement budgets support sophisticated, large-scale rollouts, reinforcing the region's status as an innovation hub.
The Asia Pacific is the fastest-growing region, with a 6.98% CAGR through 2031. National digital economy programs in India, China, and key ASEAN nations are driving multi-vendor transformation projects that overwhelm traditional ITSM processes. Foreign direct investment and hyperscaler data-center expansions further complicate service chains, catalyzing demand for SIAM. Enterprises in Japan and South Korea, already steeped in lean operations, are now layering SIAM on top of DevOps pipelines to enhance cross-provider accountability.
Europe demonstrates consistent annual growth of 5.71%, propelled by the GDPR, emerging AI regulations, and tightening third-party risk requirements. ISO 20000 certification drives baseline alignment across providers, while Brexit-driven data-flow uncertainties heighten the need for transparent governance. Germany and the United Kingdom spearhead adoption, whereas Eastern European enterprises accelerate uptake to meet EU harmonization goals. Sustainability directives are adding an environmental-performance dimension to vendor scorecards, extending SIAM KPIs beyond cost and uptime.
- Accenture plc
- AtoS SE
- Capgemini SE
- Fujitsu Limited
- HCL Technologies Limited
- Hewlett Packard Enterprise Company
- International Business Machines Corporation
- Infosys Limited
- Mindtree Limited
- Tata Consultancy Services Limited
- Wipro Limited
- CGI Inc.
- DXC Technology Company
- NTT Data Corporation
- ServiceNow Inc.
- Sopra Steria Group SA
- Tech Mahindra Limited
- Unisys Corporation
- Rackspace Technology Inc.
- Orange Business Services SA
- Cognizant Technology Solutions Corporation
Additional Benefits:
- The market estimate (ME) sheet in Excel format
- 3 months of analyst support
TABLE OF CONTENTS
1 INTRODUCTION
- 1.1 Study Assumptions and Market Definition
- 1.2 Scope of the Study
2 RESEARCH METHODOLOGY
3 EXECUTIVE SUMMARY
4 MARKET LANDSCAPE
- 4.1 Market Overview
- 4.2 Market Drivers
- 4.2.1 Rising multi-vendor IT outsourcing complexity
- 4.2.2 Surge in cloud-native microservices architectures
- 4.2.3 Growing demand for unified SLA governance platforms
- 4.2.4 Acceleration of digital transformation in regulated industries
- 4.2.5 Hybrid-work operating model adoption
- 4.2.6 Adoption of AIOps for proactive service orchestration
- 4.3 Market Restraints
- 4.3.1 Shortage of SIAM-skilled professionals
- 4.3.2 Absence of global standardised SLA frameworks
- 4.3.3 Legacy toolchain interoperability challenges
- 4.3.4 Perceived loss of direct vendor control by enterprises
- 4.4 Industry Value Chain Analysis
- 4.5 Regulatory Landscape
- 4.6 Technological Outlook
- 4.7 Porter's Five Forces Analysis
- 4.7.1 Bargaining Power of Suppliers
- 4.7.2 Bargaining Power of Consumers
- 4.7.3 Threat of New Entrants
- 4.7.4 Intensity of Competitive Rivalry
- 4.7.5 Threat of Substitutes
- 4.8 Impact of Macroeconomic Factors
5 MARKET SIZE AND GROWTH FORECASTS (VALUE)
- 5.1 By Component
- 5.1.1 Solutions
- 5.1.1.1 Business Solutions
- 5.1.1.2 Technology Solutions
- 5.1.2 Services
- 5.1.1 Solutions
- 5.2 By Service Model
- 5.2.1 Single-Provider Model
- 5.2.2 Hybrid-Provider Model
- 5.2.3 Internal Service Integrator Model
- 5.2.4 External Service Integrator Model
- 5.3 By Deployment Mode
- 5.3.1 On-Premise
- 5.3.2 Public Cloud
- 5.3.3 Private Cloud
- 5.3.4 Hybrid Cloud
- 5.4 By Organization Size
- 5.4.1 Small and Medium Enterprises
- 5.4.2 Large Enterprises
- 5.5 By End-User Industry
- 5.5.1 Banking, Financial Services and Insurance (BFSI)
- 5.5.2 Information Technology and Telecom
- 5.5.3 Healthcare
- 5.5.4 Retail
- 5.5.5 Manufacturing
- 5.5.6 Government and Public Sector
- 5.5.7 Other End-User Industries
- 5.6 By Geography
- 5.6.1 North America
- 5.6.1.1 United States
- 5.6.1.2 Canada
- 5.6.1.3 Mexico
- 5.6.2 South America
- 5.6.2.1 Brazil
- 5.6.2.2 Argentina
- 5.6.2.3 Rest of South America
- 5.6.3 Europe
- 5.6.3.1 Germany
- 5.6.3.2 United Kingdom
- 5.6.3.3 France
- 5.6.3.4 Italy
- 5.6.3.5 Spain
- 5.6.3.6 Rest of Europe
- 5.6.4 Asia Pacific
- 5.6.4.1 China
- 5.6.4.2 Japan
- 5.6.4.3 India
- 5.6.4.4 South Korea
- 5.6.4.5 South-East Asia
- 5.6.4.6 Rest of Asia Pacific
- 5.6.5 Middle East
- 5.6.5.1 Saudi Arabia
- 5.6.5.2 United Arab Emirates
- 5.6.5.3 Turkey
- 5.6.5.4 Rest of Middle East
- 5.6.6 Africa
- 5.6.6.1 South Africa
- 5.6.6.2 Nigeria
- 5.6.6.3 Rest of Africa
- 5.6.1 North America
6 COMPETITIVE LANDSCAPE
- 6.1 Market Concentration
- 6.2 Strategic Moves
- 6.3 Market Share Analysis
- 6.4 Company Profiles (includes Global level Overview, Market level overview, Core Segments, Financials as available, Strategic Information, Market Rank/Share for key companies, Products and Services, and Recent Developments)
- 6.4.1 Accenture plc
- 6.4.2 AtoS SE
- 6.4.3 Capgemini SE
- 6.4.4 Fujitsu Limited
- 6.4.5 HCL Technologies Limited
- 6.4.6 Hewlett Packard Enterprise Company
- 6.4.7 International Business Machines Corporation
- 6.4.8 Infosys Limited
- 6.4.9 Mindtree Limited
- 6.4.10 Tata Consultancy Services Limited
- 6.4.11 Wipro Limited
- 6.4.12 CGI Inc.
- 6.4.13 DXC Technology Company
- 6.4.14 NTT Data Corporation
- 6.4.15 ServiceNow Inc.
- 6.4.16 Sopra Steria Group SA
- 6.4.17 Tech Mahindra Limited
- 6.4.18 Unisys Corporation
- 6.4.19 Rackspace Technology Inc.
- 6.4.20 Orange Business Services SA
- 6.4.21 Cognizant Technology Solutions Corporation
7 MARKET OPPORTUNITIES AND FUTURE OUTLOOK
- 7.1 White-space and Unmet-Need Assessment


