


 |
市場調查報告書
商品編碼
2124401
應用程式發布自動化:市場佔有率分析、產業趨勢與統計、成長預測(2026-2031)Application Release Automation - Market Share Analysis, Industry Trends & Statistics, Growth Forecasts (2026 - 2031) |
||||||

※ 本網頁內容可能與最新版本有所差異。詳細情況請與我們聯繫。
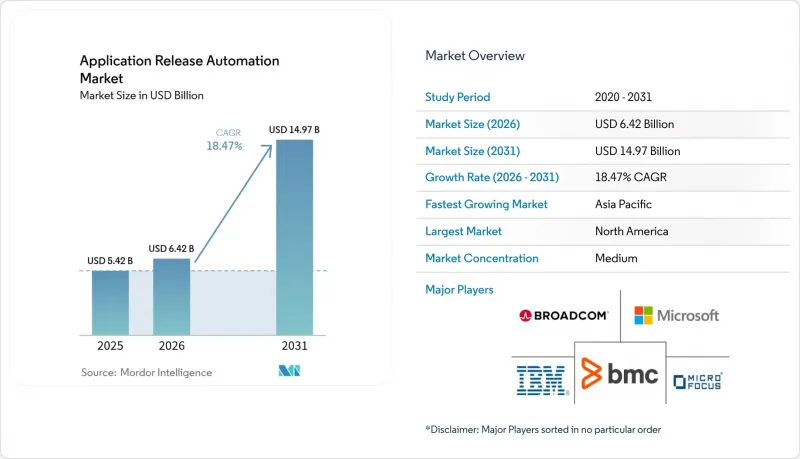
據 Mordor Intelligence 稱,應用程式發布自動化市場預計到 2026 年價值 64.2 億美元,高於 2025 年的 54.2 億美元,預計到 2031 年將達到 149.7 億美元。
預計從 2026 年到 2031 年,其複合年成長率將達到 18.47%。
本報告按組件(工具和服務)、部署模式(雲端、本地部署、混合部署)、組織規模(大型企業和中小企業)、最終用戶行業(銀行、金融服務和保險、IT和電信、零售和電子商務、媒體和娛樂等)以及地區進行細分。市場預測以美元計價。
全球應用發布自動化市場趨勢與洞察
資訊長們向流水線即程式碼和平台工程轉型
全球四分之三的公司已建立平台團隊,以標準化黃金路徑部署模板和自助式基礎設施入口網站。博世家電圍繞其內部開發者平台重建了交付架構,透過消除團隊手動建立基礎設施的需求,顯著減少了故障發生率。這項策略轉變消除了繁瑣的任務,將管治整合到可重複使用模組中,加快了開發者的上手速度,並推動了應用程式發布自動化市場的持續成長。
多重雲端微服務的激增正在推高發布頻率。
與單體架構相比,微服務架構的發布頻率通常高出 10 到 20 倍,因此,自動化門控管理、服務網格路由以及跨不同雲端環境的統一可觀測性成為至關重要的運維需求。 Airbnb 的 Kubernetes 環境每年透過多叢集管線處理超過 12.5 萬次發布,這充分說明了企業為何要投資於高級發布編配。
監管產業中傳統單體系統的依賴性
大型主機和緊密耦合的事務系統由於修改時間有限且缺乏介面適配器,阻礙了自動化管線的建置。雖然 GitLab 和 IBM 目前正透過在 z/OS 上啟用原生 CI/CD 階段來緩解這項限制,但對許多銀行而言,全面現代化仍需十年或更長時間。
細分市場分析
預計到2025年,工具類產品將佔總收入的68.55%,顯示企業仍依賴成熟的商業平台來實現配置工作流程的自動化。然而,隨著企業逐漸認知到營運模式、管治和文化轉型是專案成功的關鍵,服務類產品預計將以21.12%的複合年成長率成為所有細分市場中成長最快的。應用程式發布自動化市場的服務類產品預計將快速擴張,尤其是在需要專業合規知識的受監管行業。在採用趨勢方面,平台即服務 (PaaS) 模式(將託管服務和編配軟體捆綁在一起)正日益受到關注。 Platform.sh 的1.4億美元D輪資金籌措將用於擴展完全託管的環境,從而消除基礎設施的複雜性。隨著企業尋求端到端轉型,諮詢、整合和託管運行手冊服務目前在新支出中佔據了相當大的比例,推動了服務類產品在應用程式發布自動化市場中所佔佔有率的成長。
到 2025 年,雲端部署將主導應用程式發布自動化市場,佔據 58.65% 的佔有率。然而,混合模式正以 20.37% 的複合年成長率快速成長,因為企業需要在利用公共雲端的彈性的同時保護敏感工作負載。隨著能夠跨環境實現一致策略執行的編配工具日趨成熟,預計到 2031 年,與混合部署相關的應用發布自動化市場規模將翻倍。 VMware Tanzu 和類似平台可在本地和公共雲端之間提供一致的 Kubernetes 執行時間環境。同時,Rundeck 為渣打銀行的 400 多個關鍵應用程式實現了自動化運維接管,將每次事件的平均修復時間縮短了 25 分鐘。對混合編配的需求表明,大型企業在優先考慮風險緩解和地理限制的同時,也不願在發布速度上做出妥協。
區域分析
預計到2025年,北美將佔全球營收的38.15%,憑藉其成熟的雲端技術應用和由創投公司支持的DevOps平台生態系統,引領產業發展。花旗集團透過人工智慧驅動的持續配置,將發布週期從數天縮短至7分鐘,展現了其業界領先的實施成熟度。亞太地區以20.86%的複合年成長率位居榜首,這得益於各國政府積極投資人工智慧和資料中心擴建。 MetLife Asia採用Azure DevOps,在提升程式碼品質的同時,將建置時間從8小時縮短至不到1小時。星展銀行利用Puppet將資源配置時間從數天縮短至數分鐘,顯示該地區的技術水準已與西方同行不相上下。歐洲也在穩步發展,這主要得益於GDPR和SBOM等法規要求所帶來的現代化需求。西門子利用人工智慧成功實現了90%的文件處理自動化,印證了工業領域企業對軟體定義營運的強勁需求。跨境金融機構在採用微服務方面處於領先地位,以平衡監管合規性和敏捷性,從而推動了整個應用程式發布自動化市場的需求。
其他好處:
- Excel格式的市場預測(ME)表
- 3個月的分析師支持
目錄
第1章:引言
- 研究假設和市場定義
- 調查範圍
第2章:調查方法
第3章執行摘要
第4章 市場狀況
- 市場概覽
- 市場促進因素
- 資訊長們正在向「管道即代碼」和平台工程轉型
- 多重雲端微服務的激增正在推動發布頻率的提高。
- 利用 GenAI 進行版本調整可顯著降低故障率。
- 軟體材料清單(SBOM) 合規性要求
- 公司中「平台即產品」文化的興起
- 市場限制因素
- 受監管領域對傳統單體系統的依賴
- 工具鏈的激增增加了 DevSecOps 的複雜性。
- 平台工程人才短缺
- 整個流程中敏感資訊管理的安全漏洞
- 產業價值鏈分析
- 監理情勢
- 技術展望
- 產業吸引力—五力分析
- 新進入者的威脅
- 買方的議價能力
- 供應商的議價能力
- 替代品的威脅
- 競爭公司之間的競爭
- 宏觀經濟因素對市場的影響
第5章 市場規模與成長預測
- 按組件
- 工具
- 服務
- 部署模式
- 雲
- 現場
- 混合
- 按組織規模
- 大公司
- 中小企業
- 按最終用戶行業分類
- BFSI
- IT/通訊
- 零售與電子商務
- 媒體與娛樂
- 醫療保健和生命科學
- 製造業
- 政府/公共部門
- 其他終端用戶產業
- 按地區
- 北美洲
- 美國
- 加拿大
- 墨西哥
- 南美洲
- 巴西
- 阿根廷
- 智利
- 其他南美國家
- 歐洲
- 德國
- 英國
- 法國
- 義大利
- 西班牙
- 俄羅斯
- 其他歐洲國家
- 亞太地區
- 中國
- 印度
- 日本
- 韓國
- 新加坡
- 馬來西亞
- 澳洲
- 其他亞太國家
- 中東和非洲
- 中東
- 阿拉伯聯合大公國
- 沙烏地阿拉伯
- 土耳其
- 其他中東國家
- 非洲
- 南非
- 奈及利亞
- 埃及
- 其他非洲國家
- 中東
- 北美洲
第6章 競爭情勢
- 市場集中度
- 策略趨勢
- 市佔率分析
- 公司簡介
- Broadcom Inc.(CA Automic)
- IBM Corporation
- Microsoft Corporation
- BMC Software Inc.
- Micro Focus International Plc
- Digital.ai Software Inc.
- GitLab Inc.
- CloudBees Inc.
- Red Hat Inc.(Ansible)
- Atlassian Corporation Plc
- Perforce Software Inc.(Puppet & Chef)
- Octopus Deploy Pty Ltd
- Harness Inc.
- JFrog Ltd.
- CircleCI Inc.
- JetBrains sro
- Amazon Web Services Inc.(CodeDeploy)
- Google LLC(Cloud Deploy)
- Oracle Corporation
- ServiceNow Inc.
- Flexagon LLC
- DeployHub Inc.
- Armory Inc.(Spinnaker)
- AutoRabit Holdings Inc.
- Copado Solutions SL
第7章 市場機會與未來趨勢
- 評估閒置頻段和未滿足的需求
According to Mordor Intelligence, application release automation market size in 2026 is estimated at USD 6.42 billion, growing from 2025 value of USD 5.42 billion with 2031 projections showing USD 14.97 billion, growing at 18.47% CAGR over 2026-2031.
This report is Segmented by Component (Tools and Services), Deployment Mode (Cloud, On-Premises, Hybrid), Organization Size (Large Enterprises and Small and Medium Enterprises), End-User Industry (BFSI, IT and Telecommunications, Retail and E-Commerce, Media and Entertainment, and More), and Geography. The Market Forecasts are Provided in Terms of Value (USD).
Global Application Release Automation Market Trends and Insights
CIO Shift to Pipeline-as-Code and Platform Engineering
Three in four global corporations have instituted platform teams that standardize golden-path deployment templates and self-service infrastructure portals. BSH Home Appliances rebuilt its delivery stack around an internal developer platform and recorded substantial incident reduction because teams no longer hand-crafted infrastructure. The strategic shift removes toil, embeds governance in reusable modules, and boosts developer onboarding speed, reinforcing sustained growth in the application release automation market.
Surge in Multi-Cloud Microservices Driving Release Frequency
A microservices architecture often multiplies release events by 10-20X compared with monoliths, creating an operational imperative for automated gating, service mesh routing, and unified observability across disparate clouds. Airbnb's Kubernetes fleet processes more than 125,000 releases annually through multicluster pipelines, underscoring why enterprises invest in sophisticated release orchestration.
Legacy Monolith Dependencies in Regulated Sectors
Mainframes and tightly coupled transactional systems hinder automated pipelines because change windows remain restricted and interface adapters are scarce. GitLab and IBM now let CI/CD stages run natively on z/OS to alleviate this constraint, yet full modernization remains a decade-long journey for many banks.
Other drivers and restraints analyzed in the detailed report include:
- GenAI-Powered Release Orchestration Slashing Failure Rates
- Software Bill of Materials Compliance Mandates
- Tool-Chain Sprawl Inflating DevSecOps Complexity
For complete list of drivers and restraints, kindly check the Table Of Contents.
Segment Analysis
Tools accounted for 68.55% of 2025 revenue, illustrating that enterprises still rely on proven commercial platforms to automate deployment workflows. However, the services segment is forecast to grow at 21.12% CAGR, the highest across all components, as organizations realize that operating models, governance, and cultural change determine project success. The application release automation market size for services is projected to surge, especially within regulated industries that require specialized compliance expertise.Adoption trends show platform-as-a-service offerings that bundle managed services with orchestration software. Platform.sh's USD 140 million Series D provides capital to scale fully managed environments that abstract infrastructure complexities. As enterprises pursue end-to-end transformation, consulting, integration, and managed runbook services increasingly dominate new spending, reinforcing services' expanding share of the application release automation market.
Cloud deployments dominated with a 58.65% application release automation market share in 2025, but hybrid models are accelerating at 20.37% CAGR because enterprises need to safeguard sensitive workloads while exploiting public-cloud elasticity. The application release automation market size attached to hybrid deployments is predicted to double by 2031 as orchestration tools mature to provide consistent policy enforcement across environments.VMware Tanzu and similar platforms supply consistent Kubernetes runtimes across on-premises and public clouds, while Rundeck automates operational hand-offs for more than 400 critical applications at Standard Chartered Bank, cutting mean-time-to-repair by 25 minutes per incident. Demand for hybrid orchestration demonstrates that large enterprises prioritize risk mitigation and locality constraints but refuse to compromise on release velocity.
Complete Report Scope:
- By Component
- Tools
- Services
- By Deployment Mode
- Cloud
- On-Premises
- Hybrid
- By Organization Size
- Large Enterprises
- Small and Medium Enterprises (SMEs)
- By End-user Industry
- BFSI
- IT and Telecommunications
- Retail and E-commerce
- Media and Entertainment
- Healthcare and Life Sciences
- Manufacturing
- Government and Public Sector
- Other End-user Industries
- By Geography
- North America
- United States
- Canada
- Mexico
- South America
- Brazil
- Argentina
- Chile
- Rest of South America
- Europe
- Germany
- United Kingdom
- France
- Italy
- Spain
- Russia
- Rest of Europe
- Asia-Pacific
- China
- India
- Japan
- South Korea
- Singapore
- Malaysia
- Australia
- Rest of Asia-Pacific
- Middle East and Africa
- Middle East
- United Arab Emirates
- Saudi Arabia
- Turkey
- Rest of Middle East
- Africa
- South Africa
- Nigeria
- Egypt
- Rest of Africa
- Middle East
- North America
Geography Analysis
North America led with 38.15% revenue in 2025, owing to mature cloud adoption and an ecosystem of venture-backed DevOps platforms. Citi slashed release cycles from several days to seven minutes using AI-driven continuous deployment, illustrating best-in-class implementation maturity.Asia-Pacific posts the fastest 20.86% CAGR because governments invest aggressively in AI and data-center expansion. MetLife Asia integrated Azure DevOps to cut build times from eight hours to under one hour while raising code quality. DBS Bank used Puppet to shrink provisioning from days to minutes, proving that regional skill sets now match Western counterparts. Europe advances steadily as GDPR and SBOM mandates force modernization. Siemens achieved 90% touchless document processing with AI-powered automation, confirming industrial players' appetite for software-defined operations. Cross-border financial entities spearhead microservice adoption to remain regulatory-compliant yet agile, sustaining demand across the application release automation market.
- Broadcom Inc. (CA Automic)
- IBM Corporation
- Microsoft Corporation
- BMC Software Inc.
- Micro Focus International Plc
- Digital.ai Software Inc.
- GitLab Inc.
- CloudBees Inc.
- Red Hat Inc. (Ansible)
- Atlassian Corporation Plc
- Perforce Software Inc. (Puppet & Chef)
- Octopus Deploy Pty Ltd
- Harness Inc.
- JFrog Ltd.
- CircleCI Inc.
- JetBrains s.r.o.
- Amazon Web Services Inc. (CodeDeploy)
- Google LLC (Cloud Deploy)
- Oracle Corporation
- ServiceNow Inc.
- Flexagon LLC
- DeployHub Inc.
- Armory Inc. (Spinnaker)
- AutoRabit Holdings Inc.
- Copado Solutions S.L.
Additional Benefits:
- The market estimate (ME) sheet in Excel format
- 3 months of analyst support
TABLE OF CONTENTS
1 INTRODUCTION
- 1.1 Study Assumptions and Market Definition
- 1.2 Scope of the Study
2 RESEARCH METHODOLOGY
3 EXECUTIVE SUMMARY
4 MARKET LANDSCAPE
- 4.1 Market Overview
- 4.2 Market Drivers
- 4.2.1 CIO shift to pipeline-as-code and platform engineering
- 4.2.2 Surge in multi-cloud micro-services driving release frequency
- 4.2.3 GenAI-powered release orchestration slashing failure rates
- 4.2.4 Software Bill of Materials (SBOM) compliance mandates
- 4.2.5 Rise of "platform-as-a-product" culture in enterprises
- 4.3 Market Restraints
- 4.3.1 Legacy monolith dependencies in regulated sectors
- 4.3.2 Tool-chain sprawl inflating DevSecOps complexity
- 4.3.3 Shortage of platform-engineering talent
- 4.3.4 Security gaps in secrets management across pipelines
- 4.4 Industry Value Chain Analysis
- 4.5 Regulatory Landscape
- 4.6 Technological Outlook
- 4.7 Industry Attractiveness - Porter's Five Forces Analysis
- 4.7.1 Threat of New Entrants
- 4.7.2 Bargaining Power of Buyers
- 4.7.3 Bargaining Power of Suppliers
- 4.7.4 Threat of Substitutes
- 4.7.5 Intensity of Competitive Rivalry
- 4.8 Impact of Macroeconomic Factors on the Market
5 MARKET SIZE AND GROWTH FORECASTS (VALUES)
- 5.1 By Component
- 5.1.1 Tools
- 5.1.2 Services
- 5.2 By Deployment Mode
- 5.2.1 Cloud
- 5.2.2 On-Premises
- 5.2.3 Hybrid
- 5.3 By Organization Size
- 5.3.1 Large Enterprises
- 5.3.2 Small and Medium Enterprises (SMEs)
- 5.4 By End-user Industry
- 5.4.1 BFSI
- 5.4.2 IT and Telecommunications
- 5.4.3 Retail and E-commerce
- 5.4.4 Media and Entertainment
- 5.4.5 Healthcare and Life Sciences
- 5.4.6 Manufacturing
- 5.4.7 Government and Public Sector
- 5.4.8 Other End-user Industries
- 5.5 By Geography
- 5.5.1 North America
- 5.5.1.1 United States
- 5.5.1.2 Canada
- 5.5.1.3 Mexico
- 5.5.2 South America
- 5.5.2.1 Brazil
- 5.5.2.2 Argentina
- 5.5.2.3 Chile
- 5.5.2.4 Rest of South America
- 5.5.3 Europe
- 5.5.3.1 Germany
- 5.5.3.2 United Kingdom
- 5.5.3.3 France
- 5.5.3.4 Italy
- 5.5.3.5 Spain
- 5.5.3.6 Russia
- 5.5.3.7 Rest of Europe
- 5.5.4 Asia-Pacific
- 5.5.4.1 China
- 5.5.4.2 India
- 5.5.4.3 Japan
- 5.5.4.4 South Korea
- 5.5.4.5 Singapore
- 5.5.4.6 Malaysia
- 5.5.4.7 Australia
- 5.5.4.8 Rest of Asia-Pacific
- 5.5.5 Middle East and Africa
- 5.5.5.1 Middle East
- 5.5.5.1.1 United Arab Emirates
- 5.5.5.1.2 Saudi Arabia
- 5.5.5.1.3 Turkey
- 5.5.5.1.4 Rest of Middle East
- 5.5.5.2 Africa
- 5.5.5.2.1 South Africa
- 5.5.5.2.2 Nigeria
- 5.5.5.2.3 Egypt
- 5.5.5.2.4 Rest of Africa
- 5.5.5.1 Middle East
- 5.5.1 North America
6 COMPETITIVE LANDSCAPE
- 6.1 Market Concentration
- 6.2 Strategic Moves
- 6.3 Market Share Analysis
- 6.4 Company Profiles (includes Global level Overview, Market level overview, Core Segments, Financials as available, Strategic Information, Market Rank/Share for key companies, Products and Services, and Recent Developments)
- 6.4.1 Broadcom Inc. (CA Automic)
- 6.4.2 IBM Corporation
- 6.4.3 Microsoft Corporation
- 6.4.4 BMC Software Inc.
- 6.4.5 Micro Focus International Plc
- 6.4.6 Digital.ai Software Inc.
- 6.4.7 GitLab Inc.
- 6.4.8 CloudBees Inc.
- 6.4.9 Red Hat Inc. (Ansible)
- 6.4.10 Atlassian Corporation Plc
- 6.4.11 Perforce Software Inc. (Puppet & Chef)
- 6.4.12 Octopus Deploy Pty Ltd
- 6.4.13 Harness Inc.
- 6.4.14 JFrog Ltd.
- 6.4.15 CircleCI Inc.
- 6.4.16 JetBrains s.r.o.
- 6.4.17 Amazon Web Services Inc. (CodeDeploy)
- 6.4.18 Google LLC (Cloud Deploy)
- 6.4.19 Oracle Corporation
- 6.4.20 ServiceNow Inc.
- 6.4.21 Flexagon LLC
- 6.4.22 DeployHub Inc.
- 6.4.23 Armory Inc. (Spinnaker)
- 6.4.24 AutoRabit Holdings Inc.
- 6.4.25 Copado Solutions S.L.
7 MARKET OPPORTUNITIES AND FUTURE TRENDS
- 7.1 White-Space and Unmet-Need Assessment


