


 |
市場調查報告書
商品編碼
2124368
地理行銷:市場佔有率分析、產業趨勢與統計、成長預測(2026-2031)Geomarketing - Market Share Analysis, Industry Trends & Statistics, Growth Forecasts (2026 - 2031) |
||||||

※ 本網頁內容可能與最新版本有所差異。詳細情況請與我們聯繫。
根據 Mordor Intelligence 估計,地理行銷市場在 2026 年的價值為 293.8 億美元,高於 2025 年的 237.2 億美元,預計到 2031 年將達到 858.3 億美元。
預計從 2026 年到 2031 年,其複合年成長率將達到 23.9%。
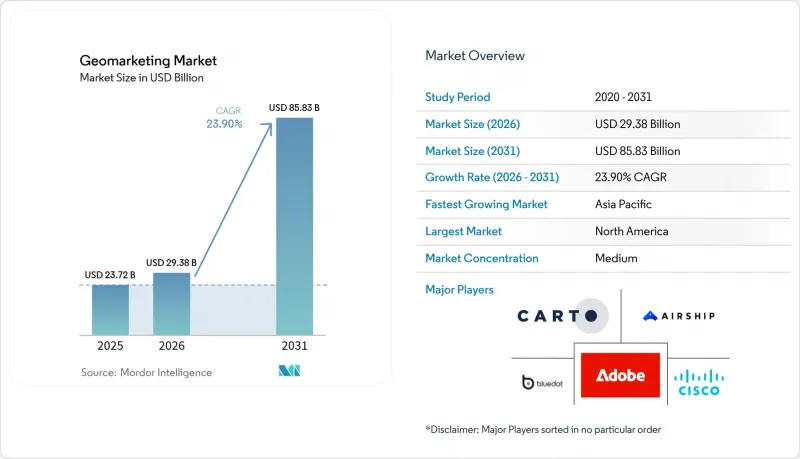
本報告按組件(軟體和服務)、部署模式(雲端和本地部署)、位置(室內和室外)、最終用戶行業(銀行、金融服務和保險、IT 和電信、其他)、組織規模(大型企業和中小企業)、技術(GPS/行動電話、BLE 信標等)、解決方案類型(地圖和地理編碼、位置分析和分類)以及視覺化等地區進行視覺化等地區進行視覺化等地區進行視覺化分類。
全球地理行銷市場趨勢與洞察
人工智慧驅動的定位性廣告超個人化
即時機器學習模型能夠最佳化廣告創新,使其與個人出行模式、停留時間和位置偏好相匹配,從而幫助零售商將廣告支出效率提升高達 40%,遠超傳統的地理定位方法。到達時間預測可以減少訂單履行缺口,而電腦視覺技術則將客流量與人口統計資訊結合。 Aura Vision 的案例充分證明了這一點,它顯著提升了履約的轉換率,並實現了 4.5 倍的投資回報率。這些功能將個人化互動從“可選項”提升至“必備選項”,從而推動地理行銷市場保持強勁成長動能。
5G部署的擴大將提高室內定位精度。
3GPP Release 18 中引入的載波相位測量技術可實現亞米級精度,使得在機場、購物中心和工廠等以往 GPS 無法覆蓋的區域開展地理行銷成為可能。企業報告稱,透過自動化資產追蹤,生產力提高了 15-20%,但毫米波 (mmWave) 基礎設施需要高密度基地台和大量資本投入。結合 5G、BLE 和 Wi-Fi 的混合協定堆疊正逐漸成為實現全面覆蓋的切實可行的方案,從而推動了對室內定位解決方案的短期需求。
基於 GDPR/CCPA 的嚴格選擇加入式同意機制
監管機構現在要求對位置資料進行明確且主動的授權,這可能會使企業平台的合規成本增加 50 萬美元至 200 萬美元。美國已有 21 個州頒布了類似的法律,每次違規最高可處以 1 萬美元的罰款。雖然基於地理位置的授權橫幅有助於區域合規,但也增加了營運負擔,因此隱私保護措施已成為供應商發展藍圖的核心內容。
細分市場分析
預計到2025年,軟體平台將佔總收入的65.55%,凸顯了地理行銷市場對雲端原生、功能豐富的技術堆疊的偏好,這些技術堆疊能夠整合各種資料來源並符合不斷變化的隱私法規。持續更新為使用者帶來人工智慧細分、合規性儀表板和API連接器,無需繁瑣的本地部署環境。以整合式託管分析為主導的服務正以26.69%的複合年成長率快速成長,因為企業正在尋求指南,將地理行銷洞察整合到其更廣泛的行銷技術架構中。地理行銷服務市場的快速成長源自於客製化入駐、專有演算法設計和監管審計等諸多環節仍超出許多企業的技能範圍。 Oracle預計到2025年Oracle雲端收入將達到117億美元,這表明捆綁式軟體和服務合約正在滿足尋求承包智慧定位方案的企業的需求。
到2025年,雲端運算將佔據地理行銷市場70.42%的佔有率,複合年成長率(CAGR)高達25.46%。這是因為品牌方更傾向於使用具備強大運算能力和快速擴展能力的雲端平台來進行大規模宣傳活動。微軟Azure銷售額成長31%,反映出市場對GPU加速分析和無伺服器地理空間管道的需求激增。在資料主權法規嚴格的地區,本地部署環境仍然佔據主導地位,但它們面臨成本方面的挑戰。企業透過減少硬體和維護成本,可以將整體擁有成本(TCO)降低40%至60%。雖然某些低延遲應用程式由於出站網路費用和延遲限制而仍然保留在混合環境中,但雲端安全性的穩定提升正推動工作負載持續遷移到多租戶環境,從而擴大地理行銷市場的規模。
預計到2025年,戶外服務收入將維持59.62%的佔有率,這主要得益於GPS的廣泛應用;而室內定位預計將以26.74%的複合年成長率成長,反映出市場對資產追蹤和身臨其境型零售的需求日益成長。中國移動的5G系統在其90%的覆蓋區域內實現了3-5公尺的定位精度,為全球設施樹立了功能標竿。隨著企業部署BLE、Wi-Fi和5G的混合陣列,室內服務的地理行銷市場正在不斷擴大,從而實現排隊管理、即時導航和近距離優惠等功能。儘管部署的複雜性和成本仍然是障礙,但信標價格的下降和捆綁式管理服務的推出正在降低中型零售商和醫院的進入門檻。
區域分析
2025年,北美地區繼續佔據全球收入的37.25%,這得益於成熟的廣告技術生態系統、廣泛的5G部署以及平衡的隱私立法。隨著企業將空間智慧整合到現有資料湖中,Google雲端的營收成長了30%。聯邦和州的資料隱私框架雖然要求用戶明確同意,但也為創新提供了空間,確保了對精準定位和全通路歸因的持續投資。亞太地區以26.31%的複合年成長率位居榜首,這主要得益於龐大的行動網路普及率、政府主導的5G部署計畫以及「行動優先」的零售文化。 GSMA估計,2023年行動業務為該地區GDP貢獻了8,800億美元,而中國、日本和馬來西亞正在資助人工智慧和室內定位的試點計畫。雙網5G框架和衛星回程傳輸計畫可望將高精度通訊覆蓋範圍擴展到農村地區,進一步拓展地理行銷市場的機會。在歐洲,儘管GDPR合規成本高昂,但仍在穩步推進。為了在嚴格的監管框架下平衡在地化需求,企業正在採用邊緣運算、聯邦學習和差分隱私等技術。中東、非洲和拉丁美洲雖然仍在發展中,但未來潛力大。海灣國家對智慧城市的投資以及巴西和墨西哥智慧型手機普及率的不斷提高,正在推動試點部署。基礎設施的差異和法律的不確定性限制了短期內的規模化發展,但都市化和數位支付的興起,為下一規劃週期中以本地化為導向的成長創造了沃土。
其他好處:
- Excel格式的市場預測(ME)表
- 3個月的分析師支持
目錄
第1章:引言
- 研究假設和市場定義
- 調查範圍
第2章:調查方法
第3章執行摘要
第4章 市場狀況
- 市場概覽
- 市場促進因素
- 利用人工智慧實現基於位置的廣告超個人化
- 隨著 5G 部署的擴大,室內定位精度正在提高。
- 零售業中的數位孿生技術將客流量和銷售額連結起來。
- 速食店中信標的普及
- 叫車與微出行領域的數據貨幣化
- 具備即時地理圍籬功能的行銷技術棧
- 市場限制因素
- 基於 GDPR/CCPA 的嚴格選擇加入式同意機制
- 行動廣告ID的貶值導致匹配率下降。
- 大型設施室內三角測量精度的變化
- 多源資料標準化帶來的高總擁有成本
- 產業價值鏈分析
- 監理情勢
- 技術展望
- 產業吸引力—五力分析
- 新進入者的威脅
- 買方的議價能力
- 供應商的議價能力
- 替代品的威脅
- 競爭公司之間的競爭
- 宏觀經濟因素對市場的影響
第5章 市場規模與成長預測
- 按組件
- 軟體
- 服務
- 不同的發展
- 雲
- 現場
- 按位置
- 室內的
- 戶外的
- 按最終用戶行業分類
- BFSI
- IT/通訊
- 零售與電子商務
- 媒體與娛樂
- 旅遊與飯店
- 其他終端用戶產業
- 按組織規模
- 大公司
- 中小企業
- 透過技術
- GPS/行動電話
- BLE信標
- Wi-Fi/WLAN
- NFC/RFID
- 按解決方案類型
- 地圖繪製和地理編碼
- 位置分析和可視化
- 地理圍欄和近距離行銷
- 即時追蹤
- 宣傳活動企劃與管理
- 按地區
- 北美洲
- 美國
- 加拿大
- 墨西哥
- 南美洲
- 巴西
- 阿根廷
- 智利
- 其他南美國家
- 歐洲
- 德國
- 英國
- 法國
- 義大利
- 西班牙
- 俄羅斯
- 其他歐洲國家
- 亞太地區
- 中國
- 印度
- 日本
- 韓國
- 新加坡
- 馬來西亞
- 澳洲
- 其他亞太國家
- 中東和非洲
- 中東
- 阿拉伯聯合大公國
- 沙烏地阿拉伯
- 土耳其
- 其他中東國家
- 非洲
- 南非
- 奈及利亞
- 其他非洲國家
- 中東
- 北美洲
第6章 競爭情勢
- 市場集中度
- 策略趨勢
- 市佔率分析
- 公司簡介
- Adobe Inc.
- Airship Group Inc.
- Bluedot Industries Pty Ltd.
- CartoDB Inc.
- Cisco Systems Inc.
- Cuebiq Inc.
- ESRI Inc.
- Ericsson AB
- Foursquare Labs Inc.
- Galigeo SAS
- Google LLC
- GroundTruth Inc.
- HERE Technologies
- IBM Corporation
- InMarket Media LLC
- Localytics(Upland Software Inc.)
- Mapbox Inc.
- Microsoft Corporation
- Near Intelligence Holdings Inc.
- Oracle Corporation
- PlaceIQ Inc.
- Plot Projects BV
- Precisely(MapInfo)
- Qualcomm Technologies Inc.
- Radar Labs Inc.
- Reveal Mobile Inc.
- Software AG
- TomTom NV
- UberMedia LLC
第7章 市場機會與未來趨勢
- 評估閒置頻段和未滿足的需求
According to Mordor Intelligence, geomarketing market size in 2026 is estimated at USD 29.38 billion, growing from 2025 value of USD 23.72 billion with 2031 projections showing USD 85.83 billion, growing at 23.9% CAGR over 2026-2031.
This report is Segmented by Component (Software and Services), Deployment (Cloud and On-Premise), Location (Indoor and Outdoor), End-User Industry (BFSI, IT and Telecommunications, and More), Organization Size (Large Enterprises and Small and Medium Enterprises), Technology (GPS/Cellular, BLE Beacons, and More), Solution Type (Mapping and Geocoding, Location Analytics and Visualization, and More), and Geography.
Global Geomarketing Market Trends and Insights
AI-Driven Hyper-Personalization of Location Ads
Real-time machine-learning models now adapt creatives to an individual's movement patterns, dwell time, and venue preferences, enabling retailers to improve ad-spend efficiency by up to 40% compared with traditional geo-targeting methods. Arrival-time predictions shrink fulfillment gaps, while computer vision links foot traffic to demographic insights, as seen when Aura Vision boosted conversion at Flannels and returned a 4.5 X ROI. These capabilities elevate personalized engagement from optional to indispensable and keep the geomarketing market on an aggressive growth trajectory.
Growing 5G Roll-Outs Expand Indoor Accuracy
Carrier-phase measurements introduced in 3GPP Release 18 deliver sub-meter precision, allowing geomarketing in airports, malls, and factories where GPS once failed. Enterprises have documented 15-20% productivity gains via automated asset tracking, though mmWave infrastructure requires dense cells and capital investment. Hybrid stacks blending 5G with BLE and Wi-Fi are emerging as a pragmatic route to comprehensive coverage, reinforcing near-term demand for indoor location solutions.
Stringent Opt-In Consent Under GDPR/CCPA
Regulators now require explicit, affirmative location-data consent, raising compliance costs that range from USD 500,000 to USD 2 million for enterprise platforms. With 21 US states enacting similar laws, fines can touch USD 10,000 per incident. Geo-contextual consent banners aid regional compliance but add operational overhead, keeping privacy at the center of vendor roadmaps.
Other drivers and restraints analyzed in the detailed report include:
- Retail Digital Twins Link Foot-Traffic and Spend
- Mainstream Adoption of Beacons in Quick-Service Restaurants
- Depreciation of Mobile Ad-IDs Lowers Match Rates
For complete list of drivers and restraints, kindly check the Table Of Contents.
Segment Analysis
Software platforms accounted for 65.55% revenue in 2025, underscoring the geomarketing market preference for cloud-native, feature-rich stacks that can ingest varied data sources and comply with changing privacy rules. Continuous updates funnel AI segmentation, compliance dashboards, and API connectors into user hands without on-premise friction. Services, led by integration and managed analytics, accelerate at 26.69% CAGR as enterprises seek guidance on stitching geomarketing insights into sprawling MarTech architectures.The geomarketing market size tied to services climbs quickly because tailored onboarding, custom algorithm design, and regulatory audits remain outside most in-house skill sets. Oracle's 2025 cloud revenue growth to USD 11.7 billion illustrates how bundled software-plus-services agreements satisfy enterprise appetite for turnkey location intelligence.
Cloud held 70.42% share of the geomarketing market in 2025 and posts the highest 25.46% CAGR as brands favor elastic compute and rapid scaling for high-volume campaigns. Microsoft Azure's 31% revenue jump reflects surging demand for GPU-accelerated analytics and serverless geospatial pipelines.On-premise persists in sectors with strict data sovereignty, yet faces cost headwinds; enterprises cutting hardware and maintenance achieve 40-60% savings in total cost of ownership. Network egress fees and latency constraints keep certain low-latency applications hybrid, but incremental cloud security advances continue drawing workloads into multitenant environments, expanding the geomarketing market footprint.
Outdoor services preserved 59.62% revenue in 2025 thanks to ubiquitous GPS, while indoor positioning's 26.74% CAGR showcases demand for asset tracking and immersive retail. China Mobile's 5G system reached 3-5 meter accuracy across 90% of covered space, setting functional benchmarks for venues worldwide.As enterprises embed hybrid BLE-Wi-Fi-5G arrays, the geomarketing market size for indoor services swells, enabling queue management, real-time navigation, and proximity offers. Deployment complexity and cost remain hurdles, but declining beacon prices and managed-service bundles reduce entry barriers for mid-tier retailers and hospitals.
Complete Report Scope:
- By Component
- Software
- Services
- By Deployment
- Cloud
- On-Premise
- By Location
- Indoor
- Outdoor
- By End-User Industry
- BFSI
- IT and Telecommunications
- Retail and E-commerce
- Media and Entertainment
- Travel and Hospitality
- Other End-user Industries
- By Organization Size
- Large Enterprises
- Small and Medium Enterprises (SMEs)
- By Technology
- GPS/Cellular
- BLE Beacons
- Wi-Fi/WLAN
- NFC/RFID
- By Solution Type
- Mapping and Geocoding
- Location Analytics and Visualization
- Geo-Fencing and Proximity Marketing
- Real-Time Tracking
- Campaign Planning and Management
- By Geography
- North America
- United States
- Canada
- Mexico
- South America
- Brazil
- Argentina
- Chile
- Rest of South America
- Europe
- Germany
- United Kingdom
- France
- Italy
- Spain
- Russia
- Rest of Europe
- Asia-Pacific
- China
- India
- Japan
- South Korea
- Singapore
- Malaysia
- Australia
- Rest of Asia-Pacific
- Middle East and Africa
- Middle East
- United Arab Emirates
- Saudi Arabia
- Turkey
- Rest of Middle East
- Africa
- South Africa
- Nigeria
- Rest of Africa
- Middle East
- North America
Geography Analysis
North America maintained 37.25% of global revenue in 2025, underpinned by mature ad-tech ecosystems, broad 5G penetration, and balanced privacy statutes. Google Cloud logged 30% revenue growth as enterprises layered spatial intelligence on existing data lakes. Federal and state data-privacy frameworks mandate explicit consent yet still permit innovation, ensuring continued investment in precision targeting and omni-channel attribution.Asia-Pacific posts the sharpest 26.31% CAGR, fuelled by population-scale mobile adoption, government 5G incentives, and a mobile-first retail ethos. The GSMA estimates mobile contributed USD 880 billion to regional GDP in 2023, while policies in China, Japan, and Malaysia finance AI and indoor-location pilots. Dual-network 5G frameworks and satellite backhaul projects promise to extend high-accuracy coverage into rural areas, widening the geomarketing market opportunity.Europe advances steadily despite GDPR compliance costs. Enterprises adopt edge processing, federated learning, and differential privacy to reconcile localization with regulatory stringency. Middle East and Africa and Latin America remain emergent yet promising: smart-city investments in the Gulf and rising smartphone penetration in Brazil and Mexico catalyze pilot deployments. Infrastructure gaps and legal uncertainty temper immediate scale, but urbanization and digital payments create fertile ground for localized growth in the next planning cycle.
- Adobe Inc.
- Airship Group Inc.
- Bluedot Industries Pty Ltd.
- CartoDB Inc.
- Cisco Systems Inc.
- Cuebiq Inc.
- ESRI Inc.
- Ericsson AB
- Foursquare Labs Inc.
- Galigeo SAS
- Google LLC
- GroundTruth Inc.
- HERE Technologies
- IBM Corporation
- InMarket Media LLC
- Localytics (Upland Software Inc.)
- Mapbox Inc.
- Microsoft Corporation
- Near Intelligence Holdings Inc.
- Oracle Corporation
- PlaceIQ Inc.
- Plot Projects BV
- Precisely (MapInfo)
- Qualcomm Technologies Inc.
- Radar Labs Inc.
- Reveal Mobile Inc.
- Software AG
- TomTom NV
- UberMedia LLC
Additional Benefits:
- The market estimate (ME) sheet in Excel format
- 3 months of analyst support
TABLE OF CONTENTS
1 INTRODUCTION
- 1.1 Study Assumptions and Market Definition
- 1.2 Scope of the Study
2 RESEARCH METHODOLOGY
3 EXECUTIVE SUMMARY
4 MARKET LANDSCAPE
- 4.1 Market Overview
- 4.2 Market Drivers
- 4.2.1 AI-driven hyper-personalization of location ads
- 4.2.2 Growing 5G roll-outs expand indoor accuracy
- 4.2.3 Retail digital twins link foot-traffic and spend
- 4.2.4 Mainstream adoption of beacons in quick-service restaurants
- 4.2.5 Rideshare and micromobility data monetization
- 4.2.6 MarTech stacks embedding real-time geofencing
- 4.3 Market Restraints
- 4.3.1 Stringent opt-in consent under GDPR/CCPA
- 4.3.2 Depreciation of mobile ad-IDs lowers match rates
- 4.3.3 Indoor triangulation accuracy gaps in large venues
- 4.3.4 High TCO for multi-source data normalization
- 4.4 Industry Value Chain Analysis
- 4.5 Regulatory Landscape
- 4.6 Technological Outlook
- 4.7 Industry Attractiveness - Porter's Five Forces Analysis
- 4.7.1 Threat of New Entrants
- 4.7.2 Bargaining Power of Buyers
- 4.7.3 Bargaining Power of Suppliers
- 4.7.4 Threat of Substitutes
- 4.7.5 Intensity of Competitive Rivalry
- 4.8 Impact of Macroeconomic Factors on the Market
5 MARKET SIZE AND GROWTH FORECASTS (VALUES)
- 5.1 By Component
- 5.1.1 Software
- 5.1.2 Services
- 5.2 By Deployment
- 5.2.1 Cloud
- 5.2.2 On-Premise
- 5.3 By Location
- 5.3.1 Indoor
- 5.3.2 Outdoor
- 5.4 By End-User Industry
- 5.4.1 BFSI
- 5.4.2 IT and Telecommunications
- 5.4.3 Retail and E-commerce
- 5.4.4 Media and Entertainment
- 5.4.5 Travel and Hospitality
- 5.4.6 Other End-user Industries
- 5.5 By Organization Size
- 5.5.1 Large Enterprises
- 5.5.2 Small and Medium Enterprises (SMEs)
- 5.6 By Technology
- 5.6.1 GPS/Cellular
- 5.6.2 BLE Beacons
- 5.6.3 Wi-Fi/WLAN
- 5.6.4 NFC/RFID
- 5.7 By Solution Type
- 5.7.1 Mapping and Geocoding
- 5.7.2 Location Analytics and Visualization
- 5.7.3 Geo-Fencing and Proximity Marketing
- 5.7.4 Real-Time Tracking
- 5.7.5 Campaign Planning and Management
- 5.8 By Geography
- 5.8.1 North America
- 5.8.1.1 United States
- 5.8.1.2 Canada
- 5.8.1.3 Mexico
- 5.8.2 South America
- 5.8.2.1 Brazil
- 5.8.2.2 Argentina
- 5.8.2.3 Chile
- 5.8.2.4 Rest of South America
- 5.8.3 Europe
- 5.8.3.1 Germany
- 5.8.3.2 United Kingdom
- 5.8.3.3 France
- 5.8.3.4 Italy
- 5.8.3.5 Spain
- 5.8.3.6 Russia
- 5.8.3.7 Rest of Europe
- 5.8.4 Asia-Pacific
- 5.8.4.1 China
- 5.8.4.2 India
- 5.8.4.3 Japan
- 5.8.4.4 South Korea
- 5.8.4.5 Singapore
- 5.8.4.6 Malaysia
- 5.8.4.7 Australia
- 5.8.4.8 Rest of Asia-Pacific
- 5.8.5 Middle East and Africa
- 5.8.5.1 Middle East
- 5.8.5.1.1 United Arab Emirates
- 5.8.5.1.2 Saudi Arabia
- 5.8.5.1.3 Turkey
- 5.8.5.1.4 Rest of Middle East
- 5.8.5.2 Africa
- 5.8.5.2.1 South Africa
- 5.8.5.2.2 Nigeria
- 5.8.5.2.3 Rest of Africa
- 5.8.5.1 Middle East
- 5.8.1 North America
6 COMPETITIVE LANDSCAPE
- 6.1 Market Concentration
- 6.2 Strategic Moves
- 6.3 Market Share Analysis
- 6.4 Company Profiles (includes Global level Overview, Market level overview, Core Segments, Financials as available, Strategic Information, Market Rank/Share for key companies, Products and Services, and Recent Developments)
- 6.4.1 Adobe Inc.
- 6.4.2 Airship Group Inc.
- 6.4.3 Bluedot Industries Pty Ltd.
- 6.4.4 CartoDB Inc.
- 6.4.5 Cisco Systems Inc.
- 6.4.6 Cuebiq Inc.
- 6.4.7 ESRI Inc.
- 6.4.8 Ericsson AB
- 6.4.9 Foursquare Labs Inc.
- 6.4.10 Galigeo SAS
- 6.4.11 Google LLC
- 6.4.12 GroundTruth Inc.
- 6.4.13 HERE Technologies
- 6.4.14 IBM Corporation
- 6.4.15 InMarket Media LLC
- 6.4.16 Localytics (Upland Software Inc.)
- 6.4.17 Mapbox Inc.
- 6.4.18 Microsoft Corporation
- 6.4.19 Near Intelligence Holdings Inc.
- 6.4.20 Oracle Corporation
- 6.4.21 PlaceIQ Inc.
- 6.4.22 Plot Projects BV
- 6.4.23 Precisely (MapInfo)
- 6.4.24 Qualcomm Technologies Inc.
- 6.4.25 Radar Labs Inc.
- 6.4.26 Reveal Mobile Inc.
- 6.4.27 Software AG
- 6.4.28 TomTom NV
- 6.4.29 UberMedia LLC
7 MARKET OPPORTUNITIES AND FUTURE TRENDS
- 7.1 White-Space and Unmet-Need Assessment


