


 |
市場調查報告書
商品編碼
2124353
輪胎翻新:市佔率分析、產業趨勢與統計、成長預測(2026-2031)Tire Retreading - Market Share Analysis, Industry Trends & Statistics, Growth Forecasts (2026 - 2031) |
||||||

※ 本網頁內容可能與最新版本有所差異。詳細情況請與我們聯繫。
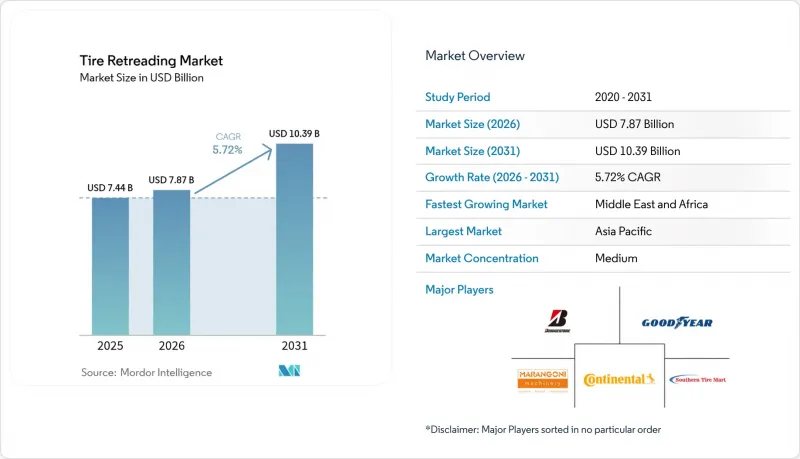
據 Mordor Intelligence 稱,2025 年輪胎翻新市場價值為 74.4 億美元,預計到 2031 年將達到 103.9 億美元,而 2026 年為 78.7 億美元,預測期(2026-2031 年)的複合年成長率為 5.72%。
本報告按車輛類型(乘用車、輕型商用車、其他)、生產方法(預硫化、模硫化)、輪胎類型(子午線輪胎、斜交輪胎、實心泡沫填充輪胎)、配銷通路(獨立翻新商、其他)、終端用戶行業(運輸和物流車輛、其他)、應用領域(公路、非公路)和地區進行細分。市場預測以美元計價。
全球輪胎翻新市場趨勢與洞察
與新輪胎相比,使用新輪胎可以節省成本。
由於翻新輪胎比同等規格的新輪胎能節省五分之二的購置成本,商業業者現在已將輪胎翻新納入年度預算計畫。隨著合成橡膠和石油價格的持續上漲,這一價格差異正在擴大,凸顯了輪胎翻新對於長途貨車和宅配服務等高頻使用車輛群體的成本效益日益顯著。預計到2025年上半年,中國重型卡車市場銷量將接近30萬輛,這清楚印證了這個成本考量。同時,航空公司為了維持微薄的營運利潤,也延長飛機輪胎的使用壽命,使其能夠使用多個循環週期。
更嚴格的循環經濟和二氧化碳排放法規
根據歐盟的“循環經濟行動計劃”,運輸企業有義務優先考慮再利用而非廢棄,輪胎翻新並非可選項,而是合規的必要手段。歐盟7排放標準透過對過早更換輪胎處以罰款,進一步強化了這項義務。北美和亞太地區的主要經濟體也正在採取類似的措施。環境效益計算簡單明了:每次輪胎翻新可減少30%的二氧化碳排放和70%的能源消耗,這些數據有助於運輸企業達到其範圍3的排放報告目標。
不穩定的橡膠外殼價格
當天然橡膠基準價格和與油價掛鉤的合成橡膠成本劇烈波動時,利潤空間受到擠壓,翻新輪胎廠難以定價。小規模獨立企業往往缺乏透過期貨交易採購原料的能力,因此更容易受到現貨市場波動的影響。結果,毛利率受到擠壓,或價格被迫上漲,削弱了翻新輪胎相對於進口新輪胎的成本優勢。當原物料價格下跌時,可以透過降低新輪胎的售價來暫時抑制對翻新輪胎的需求,直到市場恢復平衡。
細分市場分析
到2025年,中型和重型卡車將佔輪胎銷量的45.02%,其高里程數凸顯了乾線和區域運輸商對輪胎翻新的必要性。預計強勁的貨運需求將持續,該細分市場預計將在2031年之前繼續成為輪胎翻新市場的基礎。受非洲和南美洲採礦活動的推動,非公路和礦用輪胎預計將以5.96%的複合年成長率成長,這些地區的專用輪胎胎體成本是標準公路輪胎的數倍。飛機輪胎這一細分市場,其翻新次數可達4至10次,顯示嚴格的安全監管和積極的成本控制可以並存,預計該市場將以強勁的複合年成長率成長,超過大多數地面輪胎細分市場。
由於安全方面的考慮,乘用車翻新在歐洲和北美仍然是一種小眾做法,但在監管門檻較低的拉丁美洲和亞洲,乘用車翻新則保持著一定的規模。對於在電子商務物流中扮演重要角色的輕型商用車而言,為了適應都市區頻繁的停車,其翻新週期往往會縮短。在日本日益普及的雙拖車需要能夠承受更高軸荷的翻新輪胎,但目前只有最先進的獨立翻新公司才具備這種技術能力。
到2025年,預硫化法將佔全球銷售額的60.95%,仍將是卡車輪胎大量生產的主要方法。其競爭優勢在於單位成本低、加工速度快。模塑硫化法的市場佔有率正以5.88%的複合年成長率成長,這得益於加熱精度的提高以及自動化壓平機的引入,這些設備能夠客製化胎面花紋並縮短生產週期。從人工智慧驅動的表面檢測到協作機器人操作,自動化技術透過品質標準化和減少人工成本,為這兩種方法提供了支援。然而,由於小規模工廠難以資金籌措設備升級資金,資本投資需求可能會加速產業重組。
隨著對客製化花紋的需求不斷成長,採用模塑硫化生產線的輪胎翻新市場預計將會擴大。然而,預硫化方法的簡單性和低能耗使其成為注重成本的車主的首選。與原始設備製造商 (OEM) 合作的翻新廠透過營運混合型工廠來分散風險,這些工廠可以根據訂單組成和胎體供應在不同方法之間切換。
區域分析
預計到2025年,亞太地區將佔全球銷售量的38.51%。這主要得益於中國龐大的卡車保有量和印度快速的基礎建設,後者正大幅提升其高速公路網路的噸公里數。各國政府所推行的政策,例如中國的“重大裝備更新換代行動計劃”,強調循環經濟的理念,鼓勵車隊營運商向新能源汽車轉型,同時也促進了翻新輪胎的使用。在日本,對全生命週期成本模型的重視催生了對能夠與預測性維護儀錶板直接整合的先進翻新服務的需求。
中東和非洲是成長最快的地區,年複合成長率達6.06%。該地區受益於能源和礦產項目,這些項目推動了沙漠和露天礦場對越野輪胎的需求成長。沙烏地阿拉伯禁止進口翻新輪胎,並鼓勵國內生產,從而保護了當地工廠免受海外價格波動的影響。南非和波札那的礦區需求穩定,但物流方面的限制使得行動偵測單元和現場打磨設備必不可少,以最大限度地減少設備停機時間。
北美市場雖已成熟,但技術進步仍在繼續,RFID計畫和政府激勵措施正在加速工廠現代化。加拿大擁有多家翻新輪胎廠,主要專注於卡車輪胎翻新。美國提案的稅額扣抵政策一旦立法通過,預計將促進國內生產。在歐洲,監管方面的利多因素(歐7排放標準和《廢棄物框架指令》)與低價進口產品的競爭壓力相互交織,促使翻新輪胎企業投資於自動化3D測量和機器人技術,以確立成本和品質的領先地位。
其他好處
- Excel格式的市場預測(ME)表
- 3個月的分析師支持
目錄
第1章:引言
- 研究假設和市場定義
- 調查範圍
第2章:調查方法
第3章執行摘要
第4章 市場狀況
- 市場概覽
- 市場促進因素
- 與新輪胎相比,使用新輪胎可以節省成本。
- 加強循環經濟和二氧化碳排放法規
- 電子商務物流導致車輛行駛里程增加
- 政府對國產翻新輪胎的稅額扣抵制度
- 基於RFID的生命週期追蹤與保固分析
- 大型貨運公司推行綠色採購政策
- 市場限制因素
- 橡膠外殼價格波動劇烈
- 大量超低價進口輪胎湧入
- 人們對乘用車安全性的認知存在差距
- 電動車翻新輪胎的設計有其限制。
- 價值供應鏈分析
- 監理情勢
- 技術展望
- 波特五力模型
第5章 市場規模與成長預測
- 車輛類型
- 搭乘用車
- 輕型商用車
- 中型和大型卡車
- 巴士和長途汽車
- 工程用公路採礦
- 農業和特種車輛
- 透過生產方法
- 光之美少女
- 黴菌固化
- 按輪胎類型
- 徑向
- 偏見
- 固體泡沫填充物
- 透過分銷管道
- 獨立翻新輪胎公司
- OEM 和專用車輛設施
- 按最終用戶行業分類
- 運輸和物流車輛
- 建築和採礦
- 農業
- 航空
- 軍事/國防
- 廢棄物管理及其他
- 透過使用
- 公路
- 越野
- 按地區
- 北美洲
- 美國
- 加拿大
- 墨西哥
- 其他北美國家
- 南美洲
- 巴西
- 阿根廷
- 其他南美國家
- 歐洲
- 德國
- 英國
- 法國
- 義大利
- 俄羅斯
- 西班牙
- 其他歐洲國家
- 亞太地區
- 中國
- 印度
- 日本
- 韓國
- 其他亞太國家
- 中東和非洲
- 阿拉伯聯合大公國
- 沙烏地阿拉伯
- 土耳其
- 埃及
- 南非
- 其他中東和非洲國家
- 北美洲
第6章 競爭情勢
- 市場集中度
- 策略趨勢
- 市佔率分析
- 公司簡介
- Bridgestone Corporation
- Michelin
- Goodyear
- Marangoni
- Continental AG
- Vipal Rubber
- Kal Tire
- Best-One Tire Group
- Southern Tire Mart
- Yokohama Rubber
- Hankook Tire
- Pirelli
- Sumitomo Rubber
- MRF
- Oliver Rubber
- TreadWright
- Qingdao Doublestar
- Rethread(Pty)Ltd
- Parrish Tire
- Redburn Tire
第7章 市場機會與未來展望
According to Mordor Intelligence, the tire retreading market size was valued at USD 7.44 billion in 2025 and estimated to grow from USD 7.87 billion in 2026 to reach USD 10.39 billion by 2031, at a CAGR of 5.72% during the forecast period (2026-2031).
This report is Segmented by Vehicle Type (Passenger Car, Light Commercial Vehicle, and More), Production Method (Pre-Cure and Mold-Cure), Tire Type (Radial, Bias, and Solid/Foam-filled), Sales Channel (Independent Retreaders and More), End-User Industry (Transport & Logistics Fleets and More), Application (On-Road, Off-Road), and Geography. The Market Forecasts are Provided in Terms of Value (USD).
Global Tire Retreading Market Trends and Insights
Cost-savings Over New Tires
Commercial operators now embed retreading in annual budget planning because a single retread delivers two-fifths purchase-price relief versus a comparable new tire. That differential widens as synthetic rubber and petroleum costs trend upward, reinforcing retreading's payback in high-utilization fleets such as long-haul trucking and express-parcel delivery. China's heavy-duty sector, which logged almost 300,000 truck sales in the first half of 2025, epitomizes this cost calculus, while airlines stretch aviation-tire service life across multiple cycles to preserve thin operating margins .
Stricter Circular-Economy & CO2 Regulations
EU Circular Economy Action Plan rules oblige transport operators to prioritize reuse over disposal, turning tire retreading into a compliance tool rather than a discretionary measure. Euro 7 emission thresholds reinforce the mandate by penalizing premature tire replacement, and similar stimuli surface in North America and key Asia-Pacific economies. Environmental math is straightforward: every retread slashes carbon output by 30% and energy inputs by 70%, metrics that help carriers meet Scope 3 reporting targets .
Volatile Casing & Rubber Prices
Sudden swings in natural-rubber benchmarks and petroleum-linked synthetic rubber costs erode profit margins and complicate pricing grids for retread shops. Smaller independents often lack forward-buying capacity, exposing them to spot-market shocks that compress gross margin or force price hikes that narrow retread's cost edge against new imports. When raw material prices pull back, new-tire discounts can temporarily curb retread demand until equilibrium reasserts.
Other drivers and restraints analyzed in the detailed report include:
- Fleet-Mileage Growth From E-Commerce Logistics
- Government Tax-Credit Schemes For Domestic Retreads
- Influx Of Ultra-Low-Cost Import Tires
For complete list of drivers and restraints, kindly check the Table Of Contents.
Segment Analysis
Medium and heavy-duty trucks generated 45.02% of 2025 revenue, confirming that high-mileage cycles make retreading indispensable for line-haul and regional-haul carriers. This segment will continue anchoring the tire retreading market through 2031 as freight demand remains resilient. Off-the-road and mining tires are charted for a 5.96% CAGR, riding on mineral extraction activity in Africa and South America, where specialized casings cost multiples of on-road equivalents. With its 4-10 approved retread cycles, the aviation niche reveals how rigorous safety oversight can coexist with aggressive cost management, forecasting a robust CAGR that outpaces most ground-based segments.
Passenger car retreading remains marginal in Europe and North America amid safety perceptions but maintains footholds in Latin America and Asia, where regulatory barriers are lower. Light commercial vans, pivotal in e-commerce logistics, now adopt shorter retread cycles adjusted to urban stop frequency. Emerging double-articulated rigs in Japan require retread designs capable of handling higher axle loads, a technical capability that only the most advanced independent retreaders currently offer.
The pre-cure process held 60.95% of global revenue in 2025 and remains the go-to for high-volume truck casings. Its competitive advantage stems from lower per-unit cost and faster throughput. Mold-cure is gaining a 5.88% CAGR owing to improved precision heating and automated presses that shorten cycle times while allowing bespoke tread patterns. Automation, from AI-based surface inspection to collaborative robotic handlers, props up both methods by standardizing quality and trimming labor input. However, capitalization requirements could accelerate industry consolidation as smaller shops struggle to fund upgrades.
The tire retreading market size attributed to mold-cure lines is projected to increase as fleet demand for custom patterns grows. Yet, pre-cure's simplicity and lower energy load keep it the preferred method for cost-sensitive fleets. OEM-integrated retread plants hedge their bets by running hybrid facilities that switch methods based on order mix and casing availability.
Complete Report Scope:
- By Vehicle Type
- Passenger Car
- Light Commercial Vehicle
- Medium & Heavy-Duty Truck
- Bus & Coach
- Off-the-Road & Mining
- Agriculture & Specialty
- By Production Method
- Pre-cure
- Mold-cure
- By Tire Type
- Radial
- Bias
- Solid / Foam-filled
- By Sales Channel
- Independent Retreaders
- OEM / Captive Fleet Facilities
- By End-user Industry
- Transport & Logistics Fleets
- Construction & Mining
- Agriculture
- Aviation
- Military & Defense
- Waste Management & Others
- By Application
- On-road
- Off-road
- Geography
- North America
- United States
- Canada
- Mexico
- Rest of North America
- South America
- Brazil
- Argentina
- Rest of South America
- Europe
- Germany
- United Kingdom
- France
- Italy
- Russia
- Spain
- Rest of Europe
- Asia-Pacific
- China
- India
- Japan
- South Korea
- Rest of Asia-Pacific
- Middle East and Africa
- United Arab Emirates
- Saudi Arabia
- Turkey
- Egypt
- South Africa
- Rest of Middle East and Africa
- North America
Geography Analysis
Asia-Pacific commanded 38.51% revenue in 2025, due to China's gigantic truck fleet and India's infrastructure push that multiplies highway ton-kilometers. Government policies emphasizing circular-economy compliance, such as China's Large-scale Equipment Renewal Action Plan, channel fleets toward retreading while they phase into new-energy vehicles. Japan's emphasis on total-life cost modeling translates into sophisticated demand for retread services that plug directly into predictive maintenance dashboards.
Middle East & Africa, the fastest-advancing region at 6.06% CAGR, gains from energy and mineral projects that lift off-road tire usage in deserts and open-pit mines. Saudi Arabia's ban on retread imports, combined with incentives for domestic production, shields local plants from foreign price shocks. South Africa and Botswana mining corridors underpin steady demand, although logistical constraints require mobile inspection units and on-site buffing rigs to curtail equipment downtime.
North America remains a mature yet tech-progressive territory where RFID programs and government incentives foster plant modernization. Canada hosts multiple dedicated retread facilities focused mainly on truck casings, and proposed U.S. credits would boost domestic volumes if passed into law. Europe blends regulatory tailwinds, Euro 7 and waste-framework directives, with competitive headwinds from low-priced imports, prompting retreaters to invest in automated stereography and robotics to achieve cost and quality leadership.
- Bridgestone Corporation
- Michelin
- Goodyear
- Marangoni
- Continental AG
- Vipal Rubber
- Kal Tire
- Best-One Tire Group
- Southern Tire Mart
- Yokohama Rubber
- Hankook Tire
- Pirelli
- Sumitomo Rubber
- MRF
- Oliver Rubber
- TreadWright
- Qingdao Doublestar
- Rethread (Pty) Ltd
- Parrish Tire
- Redburn Tire
Additional Benefits:
- The market estimate (ME) sheet in Excel format
- 3 months of analyst support
TABLE OF CONTENTS
1 Introduction
- 1.1 Study Assumptions & Market Definition
- 1.2 Scope of the Study
2 Research Methodology
3 Executive Summary
4 Market Landscape
- 4.1 Market Overview
- 4.2 Market Drivers
- 4.2.1 Cost-Savings Over New Tires
- 4.2.2 Stricter Circular-Economy & Co2 Regulations
- 4.2.3 Fleet-Mileage Growth From E-Commerce Logistics
- 4.2.4 Government Tax-Credit Schemes for Domestic Retreads
- 4.2.5 RFID-Enabled Lifecycle Tracking & Warranty Analytics
- 4.2.6 Green Procurement Policies by Freight Majors
- 4.3 Market Restraints
- 4.3.1 Volatile Casing & Rubber Prices
- 4.3.2 Influx of Ultra-Low-Cost Import Tires
- 4.3.3 Passenger-Car Safety Perception Gaps
- 4.3.4 Limited EV-Ready Retread Designs
- 4.4 Value / Supply-Chain Analysis
- 4.5 Regulatory Landscape
- 4.6 Technological Outlook
- 4.7 Porter's Five Forces
- 4.7.1 Threat of New Entrants
- 4.7.2 Bargaining Power of Buyers
- 4.7.3 Bargaining Power of Suppliers
- 4.7.4 Threat of Substitutes
- 4.7.5 Competitive Rivalry
5 Market Size & Growth Forecasts (Value (USD))
- 5.1 By Vehicle Type
- 5.1.1 Passenger Car
- 5.1.2 Light Commercial Vehicle
- 5.1.3 Medium & Heavy-Duty Truck
- 5.1.4 Bus & Coach
- 5.1.5 Off-the-Road & Mining
- 5.1.6 Agriculture & Specialty
- 5.2 By Production Method
- 5.2.1 Pre-cure
- 5.2.2 Mold-cure
- 5.3 By Tire Type
- 5.3.1 Radial
- 5.3.2 Bias
- 5.3.3 Solid / Foam-filled
- 5.4 By Sales Channel
- 5.4.1 Independent Retreaders
- 5.4.2 OEM / Captive Fleet Facilities
- 5.5 By End-user Industry
- 5.5.1 Transport & Logistics Fleets
- 5.5.2 Construction & Mining
- 5.5.3 Agriculture
- 5.5.4 Aviation
- 5.5.5 Military & Defense
- 5.5.6 Waste Management & Others
- 5.6 By Application
- 5.6.1 On-road
- 5.6.2 Off-road
- 5.7 Geography
- 5.7.1 North America
- 5.7.1.1 United States
- 5.7.1.2 Canada
- 5.7.1.3 Mexico
- 5.7.1.4 Rest of North America
- 5.7.2 South America
- 5.7.2.1 Brazil
- 5.7.2.2 Argentina
- 5.7.2.3 Rest of South America
- 5.7.3 Europe
- 5.7.3.1 Germany
- 5.7.3.2 United Kingdom
- 5.7.3.3 France
- 5.7.3.4 Italy
- 5.7.3.5 Russia
- 5.7.3.6 Spain
- 5.7.3.7 Rest of Europe
- 5.7.4 Asia-Pacific
- 5.7.4.1 China
- 5.7.4.2 India
- 5.7.4.3 Japan
- 5.7.4.4 South Korea
- 5.7.4.5 Rest of Asia-Pacific
- 5.7.5 Middle East and Africa
- 5.7.5.1 United Arab Emirates
- 5.7.5.2 Saudi Arabia
- 5.7.5.3 Turkey
- 5.7.5.4 Egypt
- 5.7.5.5 South Africa
- 5.7.5.6 Rest of Middle East and Africa
- 5.7.1 North America
6 Competitive Landscape
- 6.1 Market Concentration
- 6.2 Strategic Moves
- 6.3 Market Share Analysis
- 6.4 Company Profiles (includes Global Level Overview, Market Level Overview, Core Segments, Financials as Available, Strategic Information, Market Rank/Share for Key Companies, Products and Services, SWOT Analysis, and Recent Developments)
- 6.4.1 Bridgestone Corporation
- 6.4.2 Michelin
- 6.4.3 Goodyear
- 6.4.4 Marangoni
- 6.4.5 Continental AG
- 6.4.6 Vipal Rubber
- 6.4.7 Kal Tire
- 6.4.8 Best-One Tire Group
- 6.4.9 Southern Tire Mart
- 6.4.10 Yokohama Rubber
- 6.4.11 Hankook Tire
- 6.4.12 Pirelli
- 6.4.13 Sumitomo Rubber
- 6.4.14 MRF
- 6.4.15 Oliver Rubber
- 6.4.16 TreadWright
- 6.4.17 Qingdao Doublestar
- 6.4.18 Rethread (Pty) Ltd
- 6.4.19 Parrish Tire
- 6.4.20 Redburn Tire
7 Market Opportunities & Future Outlook
- 7.1 White-space & Unmet-Need Assessment

 輪胎翻新市場-2026-2032年全球市場預測
 2026-2030年全球翻新汽車輪胎市場
 輪胎翻新市場機會、成長要素、產業趨勢分析及2026-2035年預測
 2035年再生輪胎市場分析及預測:按類型、產品類型、服務、技術、組件、應用、材質、製造流程和最終用戶分類
 2026年全球輪胎翻新市場報告
 2025-2029年全球汽車輪胎翻新服務市場
 全球翻新輪胎市場-按車輛類型、翻新製程、地區和競爭格局分類的產業規模、佔有率、趨勢、機會和預測(2021-2031年)
 汽車輪胎胎面感測器:全球市場佔有率和排名、總收入和需求預測(2025-2031年)
 輪胎翻新市場,按輪胎類型、按工藝、按車輛類型、按最終用戶、按銷售管道、按國家/地區分類 - 2025 年至 2032 年全球行業分析、市場規模、市場佔有率及預測