


 |
市場調查報告書
商品編碼
2124315
物聯網設備管理:市場佔有率分析、產業趨勢與統計、成長預測(2026-2031)IoT Device Management - Market Share Analysis, Industry Trends & Statistics, Growth Forecasts (2026 - 2031) |
||||||

※ 本網頁內容可能與最新版本有所差異。詳細情況請與我們聯繫。
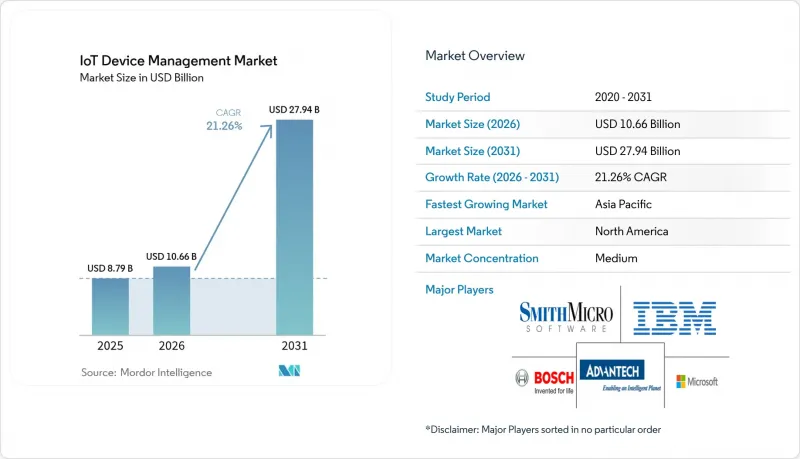
據 Mordor Intelligence 稱,2025 年物聯網設備管理市場價值為 87.9 億美元,預計到 2031 年將達到 279.4 億美元,而 2026 年為 106.6 億美元,預測期(2026-2031 年)的複合年成長率為 21.26%。
本報告按組件(解決方案和服務)、部署類型(雲端、本地部署、其他)、連接技術(蜂窩網路 [2G/3G/4G/5G]、LPWAN [NB-IoT、LoRaWAN、Sigfox]、其他)、組織規模(中小企業、大型企業)、最終用戶
全球物聯網設備管理市場趨勢與洞察
物聯網終端數量的激增正在推動對生命週期管理的需求。
預計2030年,全球連網設備數量將超過750億台,傳統的IT監控模式將難以滿足需求。集中式編配日益成為董事會層面的重要要求。目前,工廠車間部署了數千個異質感測器,需要實現自動化配置、持續可觀測性和空中下載(OTA)韌體管理。平台工程團隊正在製定自動化模板和安全基準的標準化方案,以整合多廠商設備,並確保跨司法管轄區的可審計性。
加強設備集的安全性和合規性要求
歐盟《網路韌性法案》(Cyber Resilience Act)將於2024年生效,該法案強制要求採用「安全設計」原則、軟體材料清單(BOM)和持續漏洞管理,違規者最高可被處以1500萬歐元的罰款。鑑於美國和日本也推出了類似的指令,以及物聯網終端平均每月遭受5,200次攻擊,買家正轉向採用零信任架構和即時威脅偵測功能的平台。泰雷茲公司的報告顯示,55%的企業已將物聯網安全列為三大企業風險之一。
互通性標準碎片化
儘管Matter和OPC UA等舉措正在推廣通用模式,但由於缺乏涵蓋工業、消費和市政領域的通用框架,企業不得不使用多個設備管理入口網站。 MDPI的研究表明,67%的多廠商部署仍然依賴客製化API,這增加了整合成本並延長了價值實現時間。
細分市場分析
到2025年,以安全、配置和分析模組為核心的解決方案將佔據70.35%的主導市場佔有率。隨著企業將現有資產(棕地)重組為策略主導的雲端原生框架,預計該細分市場將以21.90%的複合年成長率成長。安全管理模組是受持續合規壓力驅動的快速成長的子類別。服務細分市場佔據29.65%的市場佔有率,隨著棕地維修需要系統整合和即服務管理,其成長率的領先優勢正在逐步擴大(複合年成長率達22.10%)。缺乏專門工程團隊的中小型企業更傾向於選擇託管服務,而專業服務驅動跨多個工廠的複雜部署。這兩個要素的融合顯示核心平台層面正在走向商品化,差異化的重點正在轉向垂直加速器和人工智慧輔助平台。
儘管雲端運算仍將佔據主導地位,預計到 2025 年將擁有 67.85% 的市場佔有率,但對延遲要求極高的工作負載正在將運算轉移到工廠車間、變電站和路邊機櫃等位置。在 5G MEC 節點和支援 GPU 的閘道的推動下,邊緣原生部署預計將實現 26% 的複合年成長率。混合架構結合了全球雲端的可擴展性和確定性的本地控制,即使在回程傳輸發生故障的情況下,也能確保韌體管治和異常檢測。邊緣 AI 推理可將原始數據回程傳輸減少高達 75%,從而降低碳排放並減少營運商的成本。供應商正在整合與 Kubernetes 相容的運行時,從而實現 DevOps 式的 CI/CD 管線,用於 OTA韌體和容器更新。
區域分析
北美憑藉其成熟的雲端生態系以及在航太、汽車和醫療保健產業的早期應用,預計到2025年將佔全球收入的31.75%。聯邦政府對智慧電網韌性和國家網路安全戰略的資助,進一步加速了平台升級。亞太地區是主要的成長引擎,在政府對工廠自動化和智慧城市部署的津貼推動下,其複合年成長率高達24.10%。 IDC預測,到2030年,該地區將有389億台連網設備,這得益於5G獨立組網(SA)的廣泛部署,簡化了SIM卡的配置。
儘管中國在絕對銷售上佔據絕對優勢,但隨著電信業者在工業走廊部署NB-IoT網路,印度和印尼也實現了兩位數的成長。日本和韓國的OEM廠商正在整合eSIM/iSIM模組以支援售後連接協調,推動了對獨立於營運商的管理主機的區域需求。歐洲也佔據了相當大的市場佔有率,這主要得益於GDPR(一般資料保護規則)和網路安全法規,這些法規強制要求嚴格的漏洞修補程序。這些法規使能夠提供依賴關係映射和加密檢驗的OTA管道的供應商獲得了優勢。
在中東和非洲等新興地區,衛星增強型LoRaWAN技術正迅速超越傳統的M2M技術,被廣泛應用於油田遠端測量和公共事業的遠端抄表。在南美洲,LoRaWAN的普及與公共事業的頻段自由化和現代化計畫密切相關,巴西正在試驗一項涉及600萬個智慧電錶的AMI計畫。在所有地區,對自主雲端的需求都在推動在地化控制平面的採用,並促進全球超大規模資料中心業者資料中心營運商與國內資料中心營運商之間的合作。
其他好處
- Excel格式的市場預測(ME)表
- 3個月的分析師支持
目錄
第1章:引言
- 研究假設和市場定義
- 調查範圍
第2章:調查方法
第3章執行摘要
第4章 市場狀況
- 市場概覽
- 市場促進因素
- 物聯網終端數量的激增正在推動對生命週期管理的需求。
- 加強設備集的安全性和合規性要求
- 向邊緣雲端遷移需要整合OTA和遠端診斷功能。
- 5G和LPWAN的部署將實現超大規模連線。
- 支援 eSIM/iSIM 的動態連線和資源取得。
- 人工智慧驅動的設備自癒和預測性維護
- 市場限制因素
- 互通性標準碎片化
- 對跨境資料主權的限制
- 仔細檢視雲端後端的碳足跡
- 負責整合營運技術與資訊科技的人員短缺
- 價值供應鏈分析
- 監理情勢
- 技術展望
- 波特五力分析
第5章 市場規模與成長預測
- 按組件
- 解決方案
- 安全管理
- 設備配置和註冊
- OTA韌體/軟體更新
- 遠端監測和診斷
- 數據管理與分析
- 服務
- 專業服務
- 託管服務
- 解決方案
- 依部署類型
- 雲
- 現場
- 混合
- Edge Native
- 連接技術
- 蜂窩網路(2G/3G/4G/5G)
- LPWAN(NB-IoT、LoRaWAN、Sigfox)
- Wi-Fi 和藍牙
- 衛星及其他
- 按組織規模
- 小型企業
- 大公司
- 按最終用戶行業分類
- 製造業
- 運輸/物流
- 醫療保健和生命科學
- 零售與電子商務
- 能源與公共產業
- 智慧城市與公共安全
- 農業
- 其他
- 按地區
- 北美洲
- 美國
- 加拿大
- 墨西哥
- 南美洲
- 巴西
- 阿根廷
- 其他南美國家
- 歐洲
- 德國
- 英國
- 法國
- 義大利
- 西班牙
- 其他歐洲國家
- 亞太地區
- 中國
- 日本
- 印度
- 韓國
- 其他亞太國家
- 中東和非洲
- 中東
- 阿拉伯聯合大公國
- 沙烏地阿拉伯
- 土耳其
- 其他中東國家
- 非洲
- 南非
- 奈及利亞
- 肯亞
- 其他非洲地區
- 中東
- 北美洲
第6章 競爭情勢
- 市場集中度
- 策略趨勢
- 市佔率分析
- 公司簡介
- Microsoft
- Amazon Web Services(AWS)
- IBM
- PTC
- Software AG
- Bosch.IO
- Cisco Systems
- Oracle
- Google Cloud
- Telit Cinterion
- Advantech
- Smith Micro Software
- Aeris Communications
- AVSystem
- Samsung Knox(Samsung Electronics)
- KORE Wireless
- Eseye
- EdgeIQ
- Huawei Technologies
- Arm
- ATandT
第7章 市場機會與未來展望
According to Mordor Intelligence, the IoT device management market size was valued at USD 8.79 billion in 2025 and estimated to grow from USD 10.66 billion in 2026 to reach USD 27.94 billion by 2031, at a CAGR of 21.26% during the forecast period (2026-2031).
This report is Segmented by Component (Solutions and Services), Deployment Type (Cloud, On-Premise, and More), Connectivity Technology (Cellular [2G/3G/4G/5G], LPWAN [NB-IoT, Lorawan, Sigfox], and More), Organization Size (Small and Medium-Sized Enterprises and Large Enterprises), by End-User Vertical (Manufacturing, Transportation and Logistics, Healthcare and Life Sciences, and More), and Geography.
Global IoT Device Management Market Trends and Insights
Proliferation of IoT Endpoints Driving Lifecycle-Management Demand
Global connected-device counts will exceed 75 billion units by 2030, overwhelming traditional IT oversight models and elevating centralized orchestration as a board-level requirement. Factory floors now deploy thousands of heterogeneous sensors that demand automated provisioning, continuous observability, and over-the-air (OTA) firmware governance. Platform engineering teams are standardizing automation templates and security baselines in order to harmonize multi-vendor fleets and ensure auditability across jurisdictions.
Heightened Security and Compliance Mandates for Device Fleets
The EU Cyber Resilience Act, enacted in 2024, mandates secure-by-design principles, software bills of materials, and continuous vulnerability management, with non-compliance fines up to EUR 15 million. Parallel directives in the United States and Japan, combined with the average 5,200 monthly attacks on IoT endpoints, are steering buyers toward platforms that embed zero-trust architectures and real-time threat detection. Thales reports that 55% of organizations now rank IoT security among their top three enterprise risks.
Fragmented Interoperability Standards
Although initiatives such as Matter and OPC UA promote common schemas, the absence of universal frameworks across industrial, consumer, and municipal domains forces enterprises to juggle multiple device-management portals. An MDPI study finds that 67% of multi-vendor deployments still rely on bespoke APIs, inflating integration costs and elongating time-to-value.
Other drivers and restraints analyzed in the detailed report include:
- Edge-Cloud Shift Requiring Unified OTA and Remote Diagnostics
- 5G and LPWAN Roll-outs Unlocking Hyperscale Connection Volumes
- Cross-border Data-Sovereignty Constraints
For complete list of drivers and restraints, kindly check the Table Of Contents.
Segment Analysis
Solutions held a commanding 70.35% share in 2025, anchored by modules for security, provisioning, and analytics. The segment is on track for a 21.90% CAGR as enterprises re-architect brownfield assets into policy-driven, cloud-native frameworks. Security management modules are the breakout sub-category, reflecting relentless compliance pressure. Services, at 29.65%, are edging ahead in growth (22.10% CAGR) as brownfield retrofits require systems integration and as-a-service management. Managed services resonate with SMEs that lack embedded engineering teams, while professional services drive complex, multi-factory rollouts. The convergence of the two components signals commoditization at the core platform level and shifts differentiation to vertical accelerators and AI co-pilots.
Cloud continues to dominate with 67.85% share in 2025, but latency-critical workloads are pushing compute to factory floors, utility substations, and roadside cabinets. Edge-native deployments are forecast to log a 26% CAGR, propelled by 5G MEC nodes and GPU-equipped gateways. Hybrid blueprints blend global cloud scalability with deterministic local control, ensuring firmware governance and anomaly detection even during backhaul outages. AI inferencing at the edge reduces raw data backhaul up to 75%, shrinking carbon footprints and lowering carrier fees. Vendors are embedding Kubernetes-compatible runtimes, enabling DevOps-style CI/CD pipelines for OTA firmware and container updates.
Complete Report Scope:
- By Component
- Solutions
- Security Management
- Device Provisioning and On-boarding
- OTA Firmware and Software Updates
- Remote Monitoring and Diagnostics
- Data Management and Analytics
- Services
- Professional Services
- Managed Services
- Solutions
- By Deployment Type
- Cloud
- On-premise
- Hybrid
- Edge-native
- By Connectivity Technology
- Cellular (2G/3G/4G/5G)
- LPWAN (NB-IoT, LoRaWAN, Sigfox)
- Wi-Fi/Bluetooth
- Satellite and Others
- By Organization Size
- Small and Medium-sized Enterprises
- Large Enterprises
- By End-user Vertical
- Manufacturing
- Transportation and Logistics
- Healthcare and Life Sciences
- Retail and E-commerce
- Energy and Utilities
- Smart Cities and Public Safety
- Agriculture
- Others
- By Geography
- North America
- United States
- Canada
- Mexico
- South America
- Brazil
- Argentina
- Rest of South America
- Europe
- Germany
- United Kingdom
- France
- Italy
- Spain
- Rest of Europe
- Asia-Pacific
- China
- Japan
- India
- South Korea
- Rest of Asia-Pacific
- Middle East and Africa
- Middle East
- United Arab Emirates
- Saudi Arabia
- Turkey
- Rest of Middle East
- Africa
- South Africa
- Nigeria
- Kenya
- Rest of Africa
- Middle East
- North America
Geography Analysis
North America captured 31.75% revenue in 2025, leveraging mature cloud ecosystems and early adoption in aerospace, automotive, and healthcare. Federal funding for smart-grid resilience and the National Cybersecurity Strategy further stimulates platform upgrades. Asia Pacific is the primary growth engine, expanding at a 24.10% CAGR as governments subsidize factory automation and smart-city rollouts. IDC projects 38.9 billion connected devices in the region by 2030, underpinned by widespread 5G Stand-Alone deployments that simplify SIM provisioning.
China dominates absolute volumes, yet India and Indonesia are posting double-digit growth as carriers light up NB-IoT networks across industrial corridors. Japanese and South Korean OEMs are embedding eSIM/iSIM modules to support post-sale connectivity brokering, fueling regional demand for carrier-agnostic management consoles. Europe holds a substantial share due to GDPR and the Cyber Resilience Act, which obligate rigorous vulnerability patching regimes. These mandates favor vendors offering dependency mapping and cryptographically verifiable OTA pipelines.
Emerging regions in the Middle East and Africa are leapfrogging legacy M2M by adopting satellite-augmented LoRaWAN for oil-field telemetry and remote utility metering. South America's adoption curve is tied to spectrum liberalization and utility modernization programs, with Brazil piloting AMI projects covering six million smart meters. Across all geographies, sovereign-cloud requirements are driving localized control planes, spurring partnerships between global hyperscalers and in-country data-center operators.
- Microsoft
- Amazon Web Services (AWS)
- IBM
- PTC
- Software AG
- Bosch.IO
- Cisco Systems
- Oracle
- Google Cloud
- Telit Cinterion
- Advantech
- Smith Micro Software
- Aeris Communications
- AVSystem
- Samsung Knox (Samsung Electronics)
- KORE Wireless
- Eseye
- EdgeIQ
- Huawei Technologies
- Arm
- ATandT
Additional Benefits:
- The market estimate (ME) sheet in Excel format
- 3 months of analyst support
TABLE OF CONTENTS
1 INTRODUCTION
- 1.1 Study Assumptions and Market Definition
- 1.2 Scope of the Study
2 RESEARCH METHODOLOGY
3 EXECUTIVE SUMMARY
4 MARKET LANDSCAPE
- 4.1 Market Overview
- 4.2 Market Drivers
- 4.2.1 Proliferation of IoT endpoints driving lifecycle-management demand
- 4.2.2 Heightened security and compliance mandates for device fleets
- 4.2.3 Edge-cloud shift requiring unified OTA and remote diagnostics
- 4.2.4 5G and LPWAN roll-outs unlocking hyperscale connection volumes
- 4.2.5 eSIM/iSIM-enabled dynamic connectivity sourcing
- 4.2.6 AI-driven self-healing and predictive maintenance of devices
- 4.3 Market Restraints
- 4.3.1 Fragmented interoperability standards
- 4.3.2 Cross-border data-sovereignty constraints
- 4.3.3 Carbon-footprint scrutiny of cloud back-ends
- 4.3.4 Scarcity of OT-IT integration talent
- 4.4 Value/Supply-Chain Analysis
- 4.5 Regulatory Landscape
- 4.6 Technological Outlook
- 4.7 Porter's Five Forces Analysis
- 4.7.1 Bargaining Power of Suppliers
- 4.7.2 Bargaining Power of Buyers
- 4.7.3 Threat of New Entrants
- 4.7.4 Threat of Substitutes
- 4.7.5 Intensity of Competitive Rivalry
5 MARKET SIZE AND GROWTH FORECASTS (VALUE)
- 5.1 By Component
- 5.1.1 Solutions
- 5.1.1.1 Security Management
- 5.1.1.2 Device Provisioning and On-boarding
- 5.1.1.3 OTA Firmware and Software Updates
- 5.1.1.4 Remote Monitoring and Diagnostics
- 5.1.1.5 Data Management and Analytics
- 5.1.2 Services
- 5.1.2.1 Professional Services
- 5.1.2.2 Managed Services
- 5.1.1 Solutions
- 5.2 By Deployment Type
- 5.2.1 Cloud
- 5.2.2 On-premise
- 5.2.3 Hybrid
- 5.2.4 Edge-native
- 5.3 By Connectivity Technology
- 5.3.1 Cellular (2G/3G/4G/5G)
- 5.3.2 LPWAN (NB-IoT, LoRaWAN, Sigfox)
- 5.3.3 Wi-Fi/Bluetooth
- 5.3.4 Satellite and Others
- 5.4 By Organization Size
- 5.4.1 Small and Medium-sized Enterprises
- 5.4.2 Large Enterprises
- 5.5 By End-user Vertical
- 5.5.1 Manufacturing
- 5.5.2 Transportation and Logistics
- 5.5.3 Healthcare and Life Sciences
- 5.5.4 Retail and E-commerce
- 5.5.5 Energy and Utilities
- 5.5.6 Smart Cities and Public Safety
- 5.5.7 Agriculture
- 5.5.8 Others
- 5.6 By Geography
- 5.6.1 North America
- 5.6.1.1 United States
- 5.6.1.2 Canada
- 5.6.1.3 Mexico
- 5.6.2 South America
- 5.6.2.1 Brazil
- 5.6.2.2 Argentina
- 5.6.2.3 Rest of South America
- 5.6.3 Europe
- 5.6.3.1 Germany
- 5.6.3.2 United Kingdom
- 5.6.3.3 France
- 5.6.3.4 Italy
- 5.6.3.5 Spain
- 5.6.3.6 Rest of Europe
- 5.6.4 Asia-Pacific
- 5.6.4.1 China
- 5.6.4.2 Japan
- 5.6.4.3 India
- 5.6.4.4 South Korea
- 5.6.4.5 Rest of Asia-Pacific
- 5.6.5 Middle East and Africa
- 5.6.5.1 Middle East
- 5.6.5.1.1 United Arab Emirates
- 5.6.5.1.2 Saudi Arabia
- 5.6.5.1.3 Turkey
- 5.6.5.1.4 Rest of Middle East
- 5.6.5.2 Africa
- 5.6.5.2.1 South Africa
- 5.6.5.2.2 Nigeria
- 5.6.5.2.3 Kenya
- 5.6.5.2.4 Rest of Africa
- 5.6.5.1 Middle East
- 5.6.1 North America
6 COMPETITIVE LANDSCAPE
- 6.1 Market Concentration
- 6.2 Strategic Moves
- 6.3 Market Share Analysis
- 6.4 Company Profiles {(includes Global level Overview, Market level overview, Core Segments, Financials as available, Strategic Information, Market Rank/Share for key companies, Products and Services, and Recent Developments)}
- 6.4.1 Microsoft
- 6.4.2 Amazon Web Services (AWS)
- 6.4.3 IBM
- 6.4.4 PTC
- 6.4.5 Software AG
- 6.4.6 Bosch.IO
- 6.4.7 Cisco Systems
- 6.4.8 Oracle
- 6.4.9 Google Cloud
- 6.4.10 Telit Cinterion
- 6.4.11 Advantech
- 6.4.12 Smith Micro Software
- 6.4.13 Aeris Communications
- 6.4.14 AVSystem
- 6.4.15 Samsung Knox (Samsung Electronics)
- 6.4.16 KORE Wireless
- 6.4.17 Eseye
- 6.4.18 EdgeIQ
- 6.4.19 Huawei Technologies
- 6.4.20 Arm
- 6.4.21 ATandT
7 MARKET OPPORTUNITIES AND FUTURE OUTLOOK
- 7.1 White-space and Unmet-Need Assessment

 防水無線電市場規模、佔有率和成長分析:按產品類型、防護等級、技術、最終用戶、分銷管道、頻段和地區分類-產業預測(2026-2033 年)
 GPS開發工具市場規模、佔有率和成長分析:按組件、工具類型、應用、最終用戶、部署模式和地區分類-2026-2033年產業預測
 物聯網設備管理市場 - 全球市場預測(2026-2032年)
 ThinkTracker市場規模、佔有率和成長分析:按產品類型、連接方式、應用、最終用戶、部署模式和地區分類-2026-2033年產業預測
 員工培訓身分驗證:市場佔有率分析、產業趨勢與統計、成長預測(2026-2031)
 物聯網設備市場:按應用、連接方式和地區分類
 2026年全球植入式設備管理市場報告物聯網設備管理市場:按組件、部署模式、連接方式、應用程式和最終用戶產業分類-2026-2032年全球市場預測2026年全球物聯網閘道器設備市場報告2026年全球員工入職軟體市場報告