


 |
市場調查報告書
商品編碼
2124138
自助結帳系統系統:市場佔有率分析、產業趨勢與統計資料、成長預測(2026-2031 年)Self-checkout System - Market Share Analysis, Industry Trends & Statistics, Growth Forecasts (2026 - 2031) |
||||||

※ 本網頁內容可能與最新版本有所差異。詳細情況請與我們聯繫。
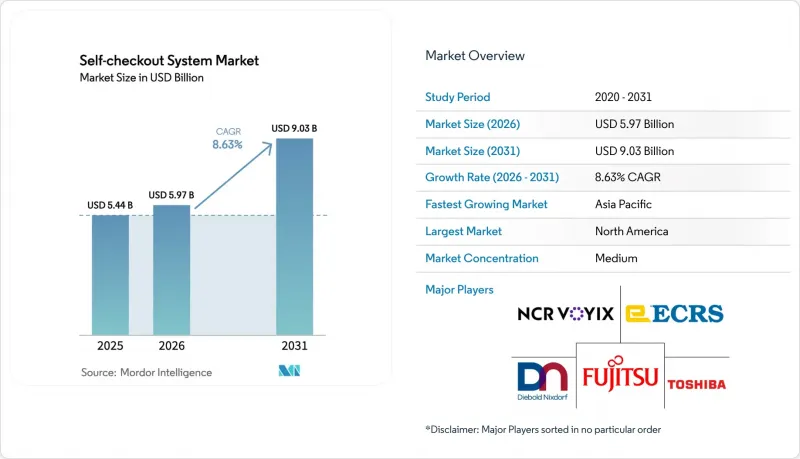
根據 Mordor Intelligence 預測,自助結帳系統系統市場規模預計將在 2025 年達到 54.4 億美元,2026 年達到 59.7 億美元,到 2031 年達到 90.3 億美元,2026 年至 2031 年的複合年成長率為 8.63%。
本報告按產品類型(硬體、軟體、服務)、交易方式(現金、非現金、混合)、型號(獨立式、桌上型、行動裝置/平板電腦、壁掛式、模組化)、終端用戶產業(零售、娛樂、旅遊、金融服務、醫療保健等)和地區(北美、亞太等)進行細分。市場預測以美元計價。
全球自助結帳系統系統市場趨勢及洞察
在超級市場和大賣場推廣應用
大規模食品零售商如今將自助結帳系統系統市場視為一種策略工具,旨在解放員工,讓他們能夠專注於線上訂購線下取貨的揀貨和上架工作。 NCR Voyix 於 2024 年對 1000 名美國消費者進行的一項調查發現,43% 的受訪者更喜歡自助服務,而 18 至 44 歲成年人中這一比例更是高達 60%。克羅格 (Kroger) 報告稱,在其 2700 個自助結帳系統通道完成的購物籃價值與人工收銀台的購物籃價值相當,從而緩解了此前人們擔心的「降級消費」(即轉向購買價格更低的商品)。樂購 (Tesco) 的混合服務模式透過引導顧客使用自助結帳機完成簡單的購物籃,並確保對年齡限制商品提供人工收銀服務,從而兼顧了法規和顧客選擇權。家樂福 (Carrefour) 於 2025 年在 150 家法國門市試點推出的「掃碼購」應用程式表明,歐洲大賣場將行動支付視為下一個發展階段。這些發展總體上表明,食品零售商正在對自助服務模式做出結構性承諾,而這種模式的普及預計將維持兩位數的成長。
人手不足和人事費用上升
2024年,零售業的離職率達到每月3.2%,高於整體經濟的平均水平,迫使企業將前端營運的自動化。在日本,預計2030年將出現640萬人的勞動力缺口,將加速便利商店自助結帳機的普及。沃爾瑪透露,自助結帳系統使每筆交易的人工時間減少了35%,從而節省了74萬工時,可用於履約履行。 2024年中期,澳洲最低工資上漲5.75%後,Woolworths和Coles擴大了自助服務範圍。由於薪資成長速度超過了自助結帳機的折舊速度,自助結帳系統系統市場呈現出引人注目的「節省成本」優勢,引起了財務經理的共鳴。
中小型零售商需要較高的初始資本投入
對於獨立雜貨店而言,自助結帳終端的價格從 15,000 美元到 40,000 美元不等,價格高昂,考慮到EBITDA獲利率徘徊在 3% 左右,這構成了一道巨大的障礙。售價低於 3,000 美元的入門級機型通常缺少支付模組,迫使商家做出妥協,而這可能導致庫存損失增加。雖然 Zippin 的訂閱計劃可以將資本支出 (Capex) 轉化為營運支出 (OpEx),但如果客流量較低,年費可能會超過 48,000 美元。在南美洲,高達 35% 的進口關稅加上兩位數的貸款利率,進一步延長了投資回收期。在硬體成本下降或資金籌措環境改善之前,小規模商店對自助結帳系統系統的採用仍將持謹慎態度,其市場成長短期內可能會放緩。
細分市場分析
預計到2031年,服務業將以11.31%的複合年成長率成長,超過硬體部署領域的主導地位,因為零售商需要POS系統整合、電腦視覺分析和託管升級服務。中型雜貨店的平均整合合約金額在5萬至12萬美元之間,自助結帳系統系統市場的服務業正在發展成為更大的收入來源。維護成本佔硬體成本的15%至20%,不斷成長的培訓需求正在推動持續的收入成長。雖然包括掃描器、支付模組和電子秤在內的硬體行業規模保持穩定,但商品化正在擠壓利潤空間。 Pan-Oston的模組化自助服務終端允許零售商在不完全更換終端的情況下更新支付模組,從而降低生命週期成本。整合了人工智慧偵測和會員忠誠度引擎的軟體訂閱正成為一種可預測的收入來源,促使供應商將重點放在雲端更新而非實體終端上。
軟體主導的價值創造也帶來了競爭壓力,因為電腦視覺專家能夠獨立於硬體實現演算法的商業化。這種轉變增加了依賴終端銷售的傳統供應商的轉換風險。隨著零售商對開放API進行標準化,將一流的分析功能整合到任何自助服務終端平台都成為可能,從而重塑自助結帳系統系統市場的格局。白牌媒體網路與自助服務終端螢幕捆綁銷售的供應商正在獲得高利潤的收入來源,吸引消費品行業的廣告支出,並進一步擴大其服務市場佔有率。
截至2025年,現金終端在自助結帳系統系統中仍將佔據61.79%的市場佔有率,但受電子錢包應用和非接觸感應卡的推動,預計到2031年,無現金支付通道的複合年成長率將達到12.02%。無現金自助服務終端無需紙幣回收機和硬幣收集器,從而降低了資本支出和持續的保險箱交付費用。 Target公司估計,無現金終端的營運成本將降低40%。混合型自助服務終端在現金依賴度高的地區提供了柔軟性,但也增加了機械結構的複雜性和維修次數。印度統一支付介面(UPI)的激增表明,向完全無現金社會的轉型正在加速,儘管在美國的一些地區,現金支付在銀行服務有限的社區仍然至關重要。監管支持,例如限制交易手續費或推廣數位支付,將繼續引導資金流向僅支持電子支付的通道,從而擴大自助結帳系統系統市場。
這種轉變也將促進自助服務終端「先買後付」等附加價值服務的擴展,從而提高顧客的平均消費額。然而,零售商需要權衡支付方式和等待時間之間的平衡。現金交易仍然需要時間,因為偽造鈔票是必要的。未來,硬體成本的降低和結帳處理速度的提升可能會促使更多企業轉向完全無現金系統。
區域分析
北美地區人事費用高昂,POS卡在全國廣泛使用,且市場接受度較高,預計到2025年,該地區的銷售額將佔全球總銷售額的58.47%。美國雜貨店正在大力投資人工智慧分析,而加拿大零售商則因最低工資上漲而擴大自助服務終端的數量。墨西哥的零售業也反映了這些趨勢,儘管在農村地區,現金支付仍然至關重要。
歐洲佔第二大市場佔有率,其中英國、德國和法國發展勢頭強勁。隨著人工智慧立法將生物識別技術列為高風險技術並強制要求第三方審計,歐洲自助結帳系統系統市場正面臨新的合規壓力。德國折扣超市如Lidl在應對庫存波動的同時,積極設定成本目標,這為電腦視覺分析創造了有利環境。南歐由於現金使用率高、門市面積較小,發展相對落後,不過旅遊區正在進行小型自助結帳設備的試點計畫。
亞太地區是成長最快的地區,複合年成長率高達11.86%,這主要得益於中國無人商店的蓬勃發展和印度的「國家零售政策」。中國的自助結帳系統系統市場受益於成熟的QR碼支付和政府對智慧零售的支持。在印度,商品和服務稅(GST)的統一以及數位錢包的激增,正在推動適合部署自助服務終端的零售業態發展。在日本,嚴重的人手不足促使便利商店,即使是面積不到500平方英尺的便利商店,也開始安裝小型自助服務終端。韓國和東南亞國協的雜貨店正在試行使用智慧型手機進行「掃碼購」服務,以滿足行動消費者的需求,而澳洲則在應對薪資上漲和高離職率的挑戰時,擴大了自助服務終端的部署規模。
南美洲的金融科技皮夾普及率雖小規模,但巴西和阿根廷在普及方面處於領先地位。然而,進口關稅和外匯波動正在減緩這一進程。在中東,智慧城市計畫正在推動投資,杜拜將無現金零售納入其數位經濟藍圖。非洲仍處於起步階段,南非正在都市區超級市場試行部署自助結帳亭。總體而言,區域趨勢表明,全球對自助結帳系統系統的需求正在趨於一致,但受到當地支付和勞動力相關因素的限制。
其他好處:
- Excel格式的市場預測(ME)表
- 3個月的分析師支持
目錄
第1章:引言
- 研究假設和市場定義
- 調查範圍
第2章:調查方法
第3章執行摘要
第4章 市場狀況
- 市場概覽
- 市場促進因素
- 在超級市場和大賣場推廣應用
- 人手不足和人事費用上升
- 人們越來越傾向於無現金和非接觸式支付。
- 人工智慧和電腦視覺領域的技術進步
- 透過SCO螢幕實現「將商店用作媒體」的商業化
- 利用該應用程式進行個人化促銷和分析
- 市場限制因素
- 中小型零售商需要較高的初始資本投入。
- 人們擔心無人收銀通道會發生竊盜和庫存損耗。
- 奢侈品零售業中消費者對「人與人之間互動」的需求
- 限制生物識別掃描的資料隱私法
- 產業價值鏈分析
- 監理情勢
- 技術展望
- 波特五力分析
- 宏觀經濟因素對市場的影響
第5章 市場規模與成長預測
- 報價
- 硬體
- 支付模組
- 條碼掃描器
- 測量儀器
- 顯示器和觸控面板
- 其他硬體
- 軟體
- POS整合軟體
- 電腦視覺軟體
- 詐欺防制分析
- 忠誠度和客戶關係管理整合
- 服務
- 整合與部署
- 維護和支援
- 託管服務
- 諮詢和培訓
- 硬體
- 按交易類型
- 現金
- 無現金
- 混合
- 按型號
- 獨立型
- 檯面
- 基於行動裝置/平板電腦
- 壁掛式
- 模組化的
- 按最終用戶行業分類
- 零售
- 超級市場和大賣場
- 百貨公司
- 便利商店
- 專賣店
- 藥局/藥局
- 娛樂
- 電影院
- 主題樂園
- 體育場
- 旅行
- 飛機場
- 火車站
- 郵輪碼頭
- 金融服務
- 銀行分店
- 衛生保健
- 醫院
- 藥局
- 其他終端用戶產業
- 速食店
- 大學和校園
- 零售
- 按地區
- 北美洲
- 美國
- 加拿大
- 墨西哥
- 南美洲
- 巴西
- 阿根廷
- 其他南美國家
- 歐洲
- 德國
- 英國
- 法國
- 義大利
- 西班牙
- 俄羅斯
- 比荷盧經濟聯盟
- 北歐的
- 其他歐洲國家
- 亞太地區
- 中國
- 印度
- 日本
- 韓國
- ASEAN
- 澳洲和紐西蘭
- 其他亞太國家
- 中東
- GCC
- 土耳其
- 以色列
- 其他中東國家
- 非洲
- 北非
- 南非
- 其他非洲國家
- 北美洲
第6章 競爭情勢
- 市場集中度
- 策略趨勢
- 市佔率分析
- 公司簡介
- NCR Corporation
- Toshiba Global Commerce Solutions
- Diebold Nixdorf Inc.
- Fujitsu Ltd.
- ITAB Scanflow AB
- ECR Software Corporation
- Pan-Oston Corporation
- StrongPoint ASA
- Mashgin Inc.
- Standard AI
- Zippin
- Hisense Co. Ltd.
- Olea Kiosks Inc.
- Aila Technologies Inc.
- PCMS Group Ltd.
- SUNMI Technology
- Grupo Digicon S/A
- XIPHIAS Software Technologies Pvt. Ltd.
- Modern-Expo Group
第7章 市場機會與未來展望
According to Mordor Intelligence, the self-checkout system market size is projected to be USD 5.44 billion in 2025, USD 5.97 billion in 2026, and reach USD 9.03 billion by 2031, growing at a CAGR of 8.63% from 2026 to 2031.
This report is Segmented by Offering (Hardware, Software, and Services), Transaction Type (Cash, Cashless, and Hybrid), Model Type (Standalone, Countertop, Mobile/Tablet-Based, Wall-Mounted, and Modular), End-User Industry (Retail, Entertainment, Travel, Financial Services, Healthcare, and More), and Geography (North America, Asia Pacific, and More). Market Forecasts are Provided in Terms of Value (USD).
Global Self-checkout System Market Trends and Insights
Rising Adoption by Supermarkets and Hypermarkets
Large-format grocers now view the self-checkout system market as a strategic lever to free staff for click-and-collect picking and shelf-stocking tasks. An NCR Voyix survey of 1,000 U.S. shoppers in 2024 found that 43% prefer self-service, with the figure climbing to 60% among adults aged 18-44. Kroger reported that baskets rung through its 2,700 self-checkout lanes match the value of baskets at manned registers, calming earlier fears of trade-down. Tesco's hybrid service model routes simple baskets to kiosks while reserving staffed lanes for age-restricted items, preserving compliance and customer choice. Carrefour's 2025 pilot of scan-and-go apps in 150 French stores suggests European hypermarkets see mobile checkout as the next evolution. Together, these moves underscore a structural commitment from grocers to self-service formats that will sustain double-digit deployment growth.
Labor Shortages and Increasing Labor Costs
Retail quit rates sat at 3.2% per month in 2024, topping the economy-wide average and forcing operators to automate front-end roles. Japan projects a 6.4 million-worker shortfall by 2030, accelerating kiosk adoption in convenience stores. Walmart disclosed that self-checkout has trimmed labor hours per transaction by 35%, unlocking 740,000 associate hours for e-commerce fulfillment. Australia's 5.75% minimum-wage increase in mid-2024 pushed Woolworths and Coles to widen self-service footprints. As wage inflation grows faster than kiosk amortization rates, the self-checkout system market gains a compelling cost-avoidance narrative that resonates with finance chiefs.
High Initial Capital Expenditure for SMB Retailers
Independent grocers face kiosk price tags of USD 15,000-40,000, a steep hurdle when EBITDA margins hover near 3%. Entry models under USD 3,000 often exclude payment modules, forcing trade-offs that raise shrinkage. Zippin's subscription option converts capex into opex, but annual fees can exceed USD 48,000 if stores run modest traffic. Import duties of up to 35% in South America plus double-digit lending rates further stretch payback periods. Until hardware costs fall or financing improves, small formats will adopt cautiously, dampening near-term self-checkout system market growth.
Other drivers and restraints analyzed in the detailed report include:
- Growing Preference for Cashless and Contactless Payments
- Technological Advances in AI and Computer-Vision
- Theft and Shrinkage Concerns at Unattended Lanes
For complete list of drivers and restraints, kindly check the Table Of Contents.
Segment Analysis
Services will expand at an 11.31% CAGR through 2031, outstripping hardware's installed-base dominance because retailers need POS integration, computer-vision analytics, and managed upgrades. Integration contracts average USD 50,000-120,000 for mid-sized grocers, pushing the self-checkout system market size in services toward a larger revenue pool. Maintenance at 15-20% of hardware cost and rising demand for training lift recurring billings. Hardware retains scale thanks to scanners, payment modules, and scales, yet commoditization squeezes margin. Modular kiosks from Pan-Oston let retailers refresh payment modules without full replacements, trimming lifecycle expense. Software subscriptions linked to AI detection and loyalty engines provide predictable income, sharpening vendor focus on cloud updates over physical units.
Software-led value creation also injects competitive tension as computer-vision specialists monetize algorithms independently of hardware. This pivot raises switching risk for legacy vendors anchored to terminal sales. As retailers standardize on open APIs, best-of-breed analytics can bolt onto any kiosk platform, redistributing power inside the self-checkout system market. Vendors that bundle white-label media networks on kiosk screens add a higher-margin revenue stream, attracting CPG advertising dollars and further elevating service share.
Cash-based terminals retained 61.79% of self-checkout system market share in 2025, but cashless lanes are tracking a 12.02% CAGR to 2031 on the back of wallet apps and contactless cards. Cashless kiosks remove bill recyclers and coin hoppers, cutting capex and ongoing vault-cash courier fees. Target quantified a 40% lower operating cost for cashless units. Hybrid kiosks give flexibility in cash-dependent regions yet introduce mechanical complexity and service calls. India's UPI surge illustrates an accelerating glide path toward full cashless, while underbanked communities in parts of the United States still mandate cash acceptance. Regulatory nudges that cap interchange or nudge digital acceptance will keep steering capital toward electronic-only lanes, broadening the self-checkout system market.
The shift also widens inclusion of value-added services such as buy-now-pay-later at the kiosk, boosting average ticket sizes. Yet retailers must balance payment optionality with queue time: cash transactions remain slower due to bill validation. Over time, differential hardware savings and faster line speeds will tip more operators toward pure cashless configurations.
Complete Report Scope:
- By Offering
- Hardware
- Payment Modules
- Barcode Scanners
- Weighing Scales
- Display and Touch Panels
- Other Hardwares
- Software
- POS Integration Software
- Computer-Vision Software
- Fraud-Prevention Analytics
- Loyalty and CRM Integration
- Services
- Integration and Deployment
- Maintenance and Support
- Managed Services
- Consulting and Training
- Hardware
- By Transaction Type
- Cash
- Cashless
- Hybrid
- By Model Type
- Standalone
- Countertop
- Mobile/Tablet-Based
- Wall-Mounted
- Modular
- By End-User Industry
- Retail
- Supermarkets and Hypermarkets
- Department Stores
- Convenience Stores
- Specialty Stores
- Pharmacy and Drugstores
- Entertainment
- Cinemas
- Theme Parks
- Stadiums
- Travel
- Airports
- Railway Stations
- Cruise Terminals
- Financial Services
- Bank Branches
- Healthcare
- Hospitals
- Pharmacies
- Other End-User Industries
- Quick Service Restaurants
- Universities and Campuses
- Retail
- By Geography
- North America
- United States
- Canada
- Mexico
- South America
- Brazil
- Argentina
- Rest of South America
- Europe
- Germany
- United Kingdom
- France
- Italy
- Spain
- Russia
- Benelux
- Nordics
- Rest of Europe
- Asia-Pacific
- China
- India
- Japan
- South Korea
- ASEAN
- Australia and New Zealand
- Rest of Asia-Pacific
- Middle East
- GCC
- Turkey
- Israel
- Rest of Middle East
- Africa
- North Africa
- South Africa
- Rest of Africa
- North America
Geography Analysis
North America commanded 58.47% of revenue in 2025 on the strength of high labor costs, near-universal POS card penetration, and early adopter culture. U.S. grocers invest heavily in AI analytics, while Canadian retailers extend kiosk footprints alongside rising minimum wages. Mexico's organized retail sector mirrors these drivers, although cash acceptance remains critical in rural areas.
Europe ranks second, with momentum in the United Kingdom, Germany, and France. The self-checkout system market size in Europe faces new compliance overhead as the AI Act designates biometric vision as high-risk, requiring third-party audits. German discounters such as Lidl balance shrinkage variability with aggressive cost targets, creating fertile ground for computer-vision analytics. Southern Europe lags due to high cash preference and smaller store footprints, but tourism hubs are piloting compact units.
Asia Pacific is the fastest-growing region at an 11.86% CAGR, propelled by China's unmanned-store boom and India's National Retail Policy. China's self-checkout system market benefits from mature QR-code payments and state support for smart retail. India's GST harmonization and digital-wallet surge foster organized retail formats that favor kiosks. Japan's acute labor shortage drives convenience stores to install compact units even in sub-500 square-foot shops. South Korea and ASEAN grocers pilot smartphone scan-and-go to serve mobile-centric shoppers, while Australia extends kiosks in response to wage hikes and turnover.
South America grows off a smaller base; Brazil and Argentina lead adoption as fintech wallets expand. Import tariffs and volatile exchange rates temper pace. The Middle East invests via smart-city initiatives, with Dubai promoting cashless retail as part of its digital-economy blueprint. Africa remains nascent, though South Africa pilots kiosks in urban supermarkets. Overall, regional dynamics point to converging global appetite for the self-checkout system market tempered by local payment and labor variables.
- NCR Corporation
- Toshiba Global Commerce Solutions
- Diebold Nixdorf Inc.
- Fujitsu Ltd.
- ITAB Scanflow AB
- ECR Software Corporation
- Pan-Oston Corporation
- StrongPoint ASA
- Mashgin Inc.
- Standard AI
- Zippin
- Hisense Co. Ltd.
- Olea Kiosks Inc.
- Aila Technologies Inc.
- PCMS Group Ltd.
- SUNMI Technology
- Grupo Digicon S/A
- XIPHIAS Software Technologies Pvt. Ltd.
- Modern-Expo Group
Additional Benefits:
- The market estimate (ME) sheet in Excel format
- 3 months of analyst support
TABLE OF CONTENTS
1 INTRODUCTION
- 1.1 Study Assumptions and Market Definition
- 1.2 Scope of the Study
2 RESEARCH METHODOLOGY
3 EXECUTIVE SUMMARY
4 MARKET LANDSCAPE
- 4.1 Market Overview
- 4.2 Market Drivers
- 4.2.1 Rising Adoption by Supermarkets and Hypermarkets
- 4.2.2 Labor Shortages and Increasing Labor Costs
- 4.2.3 Growing Preference for Cashless and Contactless Payments
- 4.2.4 Technological Advances in AI and Computer-Vision
- 4.2.5 Store-as-Media Monetization Through SCO Screens
- 4.2.6 App-Driven Personalized Promotions and Analytics
- 4.3 Market Restraints
- 4.3.1 High Initial Capital Expenditure for SMB Retailers
- 4.3.2 Theft and Shrinkage Concerns at Unattended Lanes
- 4.3.3 Consumer Demand for Human Interaction in Premium Retail
- 4.3.4 Data-Privacy Legislation Limiting Biometric Scanning
- 4.4 Industry Value Chain Analysis
- 4.5 Regulatory Landscape
- 4.6 Technological Outlook
- 4.7 Porter's Five Forces Analysis
- 4.7.1 Bargaining Power of Suppliers
- 4.7.2 Bargaining Power of Buyers
- 4.7.3 Threat of New Entrants
- 4.7.4 Threat of Substitutes
- 4.7.5 Intensity of Competitive Rivalry
- 4.8 Impact of Macroeconomic Factors on the Market
5 MARKET SIZE AND GROWTH FORECASTS (VALUE)
- 5.1 By Offering
- 5.1.1 Hardware
- 5.1.1.1 Payment Modules
- 5.1.1.2 Barcode Scanners
- 5.1.1.3 Weighing Scales
- 5.1.1.4 Display and Touch Panels
- 5.1.1.5 Other Hardwares
- 5.1.2 Software
- 5.1.2.1 POS Integration Software
- 5.1.2.2 Computer-Vision Software
- 5.1.2.3 Fraud-Prevention Analytics
- 5.1.2.4 Loyalty and CRM Integration
- 5.1.3 Services
- 5.1.3.1 Integration and Deployment
- 5.1.3.2 Maintenance and Support
- 5.1.3.3 Managed Services
- 5.1.3.4 Consulting and Training
- 5.1.1 Hardware
- 5.2 By Transaction Type
- 5.2.1 Cash
- 5.2.2 Cashless
- 5.2.3 Hybrid
- 5.3 By Model Type
- 5.3.1 Standalone
- 5.3.2 Countertop
- 5.3.3 Mobile/Tablet-Based
- 5.3.4 Wall-Mounted
- 5.3.5 Modular
- 5.4 By End-User Industry
- 5.4.1 Retail
- 5.4.1.1 Supermarkets and Hypermarkets
- 5.4.1.2 Department Stores
- 5.4.1.3 Convenience Stores
- 5.4.1.4 Specialty Stores
- 5.4.1.5 Pharmacy and Drugstores
- 5.4.2 Entertainment
- 5.4.2.1 Cinemas
- 5.4.2.2 Theme Parks
- 5.4.2.3 Stadiums
- 5.4.3 Travel
- 5.4.3.1 Airports
- 5.4.3.2 Railway Stations
- 5.4.3.3 Cruise Terminals
- 5.4.4 Financial Services
- 5.4.4.1 Bank Branches
- 5.4.5 Healthcare
- 5.4.5.1 Hospitals
- 5.4.5.2 Pharmacies
- 5.4.6 Other End-User Industries
- 5.4.6.1 Quick Service Restaurants
- 5.4.6.2 Universities and Campuses
- 5.4.1 Retail
- 5.5 By Geography
- 5.5.1 North America
- 5.5.1.1 United States
- 5.5.1.2 Canada
- 5.5.1.3 Mexico
- 5.5.2 South America
- 5.5.2.1 Brazil
- 5.5.2.2 Argentina
- 5.5.2.3 Rest of South America
- 5.5.3 Europe
- 5.5.3.1 Germany
- 5.5.3.2 United Kingdom
- 5.5.3.3 France
- 5.5.3.4 Italy
- 5.5.3.5 Spain
- 5.5.3.6 Russia
- 5.5.3.7 Benelux
- 5.5.3.8 Nordics
- 5.5.3.9 Rest of Europe
- 5.5.4 Asia-Pacific
- 5.5.4.1 China
- 5.5.4.2 India
- 5.5.4.3 Japan
- 5.5.4.4 South Korea
- 5.5.4.5 ASEAN
- 5.5.4.6 Australia and New Zealand
- 5.5.4.7 Rest of Asia-Pacific
- 5.5.5 Middle East
- 5.5.5.1 GCC
- 5.5.5.2 Turkey
- 5.5.5.3 Israel
- 5.5.5.4 Rest of Middle East
- 5.5.6 Africa
- 5.5.6.1 North Africa
- 5.5.6.2 South Africa
- 5.5.6.3 Rest of Africa
- 5.5.1 North America
6 COMPETITIVE LANDSCAPE
- 6.1 Market Concentration
- 6.2 Strategic Moves
- 6.3 Market Share Analysis
- 6.4 Company Profiles (includes Global Level Overview, Market Level Overview, Core Segments, Financials as Available, Strategic Information, Market Rank/Share for Key Companies, Products and Services, and Recent Developments)
- 6.4.1 NCR Corporation
- 6.4.2 Toshiba Global Commerce Solutions
- 6.4.3 Diebold Nixdorf Inc.
- 6.4.4 Fujitsu Ltd.
- 6.4.5 ITAB Scanflow AB
- 6.4.6 ECR Software Corporation
- 6.4.7 Pan-Oston Corporation
- 6.4.8 StrongPoint ASA
- 6.4.9 Mashgin Inc.
- 6.4.10 Standard AI
- 6.4.11 Zippin
- 6.4.12 Hisense Co. Ltd.
- 6.4.13 Olea Kiosks Inc.
- 6.4.14 Aila Technologies Inc.
- 6.4.15 PCMS Group Ltd.
- 6.4.16 SUNMI Technology
- 6.4.17 Grupo Digicon S/A
- 6.4.18 XIPHIAS Software Technologies Pvt. Ltd.
- 6.4.19 Modern-Expo Group
7 MARKET OPPORTUNITIES AND FUTURE OUTLOOK
- 7.1 White-Space and Unmet-Need Assessment

 自助結帳系統系統市場:按組件、解決方案類型、最終用戶產業、部署方式和組織規模分類-2026-2032年全球市場預測
 自助結帳系統系統市場預測至2034年-按組件、系統類型、支付方式、部署模式、最終用戶和地區分類的全球分析
 自助結帳系統系統市場規模、佔有率和成長分析:按類型、技術、應用、最終用戶和地區分類-2026-2033年產業預測
 自助結帳系統系統市場規模、佔有率和成長分析:按組件、系統類型、技術、應用、最終用戶、部署模式和地區分類-2026-2033年產業預測
 自助結帳系統系統市場報告:按產品、型號、安裝方式、最終用戶和地區分類(2026-2034 年)
 自助結帳系統系統市場:依產品、安裝方式、型號、最終用戶和地區分類。
 自助結帳系統系統市場規模、佔有率和趨勢分析報告:按組件、類型、應用、地區和細分市場預測(2026-2033 年)
 自助結帳系統系統市場分析及預測(至2035年):依類型、產品類型、服務、技術、組件、應用、部署類型、最終用戶、功能及安裝類型分類
 2026年全球自助結帳系統市場報告
 自助結帳系統市場 - 全球產業規模、佔有率、趨勢、機會、預測:按產品、交易類型、型號、最終用戶、地區和競爭格局分類,2021-2031年