


 |
市場調查報告書
商品編碼
2124111
陰極材料:市場佔有率分析、產業趨勢與統計、成長預測(2026-2031)Cathode Materials - Market Share Analysis, Industry Trends & Statistics, Growth Forecasts (2026 - 2031) |
||||||

※ 本網頁內容可能與最新版本有所差異。詳細情況請與我們聯繫。
據 Mordor Intelligence 稱,2025 年正極材料市場價值為 391 萬噸,預計到 2031 年將達到 1,432 萬噸,而 2026 年為 485 萬噸,預測期(2026-2031 年)複合年成長率為 24.15%。
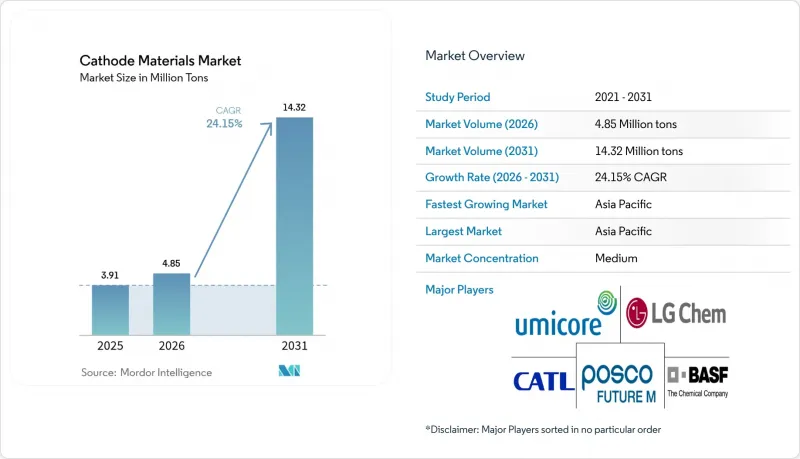
本報告按材料(磷酸鋰鐵、鈷酸鋰、錳酸鋰等)、電池類型(鋰離子電池、鉛酸電池、鈉離子電池、液流電池)、終端用戶產業(汽車、家用電子電器等)和地區(亞太地區、北美地區、歐洲地區、南美地區、中東和非洲地區)進行細分。市場預測以噸為單位。
全球正極材料市場趨勢與洞察
電動車產量激增
全球電動車產量預計在2025年達到1,380萬輛,並在2028年超過2,200萬輛。這一趨勢將推動對正極材料的需求,因為每個60kWh的電池組需要8-12公斤的活性物質。比亞迪計劃在2026年生產400萬輛插電式混合動力汽車,使其產量在2024年加倍,凸顯了其在亞洲的擴張。向高容量電池(例如寧德時代「麒麟」電池)的轉變,由於電極塗層更厚,將增加每輛車的正極材料用量。車輛電氣化也進一步刺激了需求,例如UPS訂購了1萬輛配備磷酸鐵鋰電池的送貨車,這些貨車將於2025年投入使用。商用車的生命週期充分利用了磷酸鐵鋰電池的耐久性,為正極材料市場提供了穩定性,使其不易受經濟波動的影響。
政府獎勵和排放氣體法規
美國《通膨控制法》第45X條規定,對國產電池每千瓦時補貼10美元,對電池組件每千瓦時補貼45美元,促使美國宣布將建設18座超級電池工廠,總產能達550吉瓦時。在歐洲,電池法規要求企業在2027年前揭露碳足跡,並在2030年前提高碳基準值,這使得與可再生能源相關的正極材料工廠更具優勢,例如優美科(Eumicore)旗下的NISA工廠,該工廠80%的風力發電。中國已將新能源汽車購置稅的免稅期限延長至2027年,從而維持了全球最大電動車市場的需求。印度推出的24億美元先進電池生產連結獎勵計畫吸引了信實工業(Reliance Industries)和拉傑什出口公司(Rajesh Exports)等企業,使南亞成為正極材料消費的新中心。
中國供應鏈集中度
2024年,中國將提煉全球78%的氫氧化鋰和93%的硫酸錳,如果國內供應商優先滿足國內需求,將使西方汽車製造商面臨風險。福特汽車公司在2024年推遲了其增程型F-150 Lightning的上市時間四個月,因為其中國前體材料合作夥伴在鋰短缺期間轉移了出貨地。一份美國國防評估報告警告稱,台海衝突可能會擾亂正極材料的供應。同時,像大眾汽車旗下的PowerCo這樣的歐洲公司,其82%的NMC前驅材料依賴中國供應。供應來源多元化進展緩慢,因為建造一座年產能2萬噸的前驅材料工廠需要耗資1.5億美元,耗時30個月。遵守《維吾爾族強迫勞動預防法》增加了汽車製造商的行政負擔,他們被要求追蹤多階段供應鏈。
細分市場分析
預計到2025年,磷酸鋰鐵的出貨量將佔41.10%,並將以每年24.97%的速度成長至2031年。這反映了特斯拉和比亞迪已在其量產車型中淘汰了鈷和鎳。比亞迪的「Blade Pack」電池組將與NMC 622的能量密度差距縮小至15%,從而促進了其更廣泛的應用。高鎳NMC電池仍用於高階品牌。 BMW的「Neue Klasse」車型採用能量密度為285 Wh/kg的NMC 811電池,使其適用於續航里程必須達到500公里以上的車型。鎳鈷鋁鋰(LiNiCoAl)電池在長續航電池組中佔據著一個盈利的細分市場,但由於鈷價下跌,其利潤優勢正在減弱。二氧化鉛電池目前仍用於起動電池,但隨著12V鋰電池的普及,其市場佔有率將會下降。隨著鈉離子汽車在對價格敏感的亞洲市場推出,磷酸鐵鈉的市佔率將會上升,從而擴大正極材料的市場。
區域分析
預計到2025年,亞太地區將佔據79.10%的市場佔有率,並在2031年之前以26.34%的複合年成長率成長。這反映了該地區在採礦、加工和電池製造方面的深度整合。中國憑藉其成本優勢和獨特的工藝技術,在該生態系統中扮演核心角色,從而實現了持續的創新步伐。韓國和日本則透過提供高精度製造技術和先進的材料配方,進一步鞏固了該地區的領先地位。印尼投資150億美元用於冶煉,越南則給予東南亞地區10年的稅收優惠,使其作為前驅體和組裝中心發揮關鍵作用,進一步推動了正極材料市場東移的趨勢。
在北美,受美國聯邦稅額扣抵抵免政策的推動,市場需求正在成長,該政策降低了國內工廠的風險。BASF俄亥俄州和阿爾伯馬爾金斯山的工廠為美國的生產提供了支持。一旦浦項鋼鐵未來M公司和塔隆金屬公司的工廠運作,加拿大的產能將成長三倍。在墨西哥,贛鋒和天池兩家公司20億美元的投資流入,打造了一條符合美墨加協定(USMCA)標準的近岸外包走廊。這些發展正在縮短交貨時間,並使正極材料市場的供應鏈多元化到亞洲以外的地區。
歐洲也在崛起,歐洲電池聯盟為本地生產提供資金支持。預計到2024年,德國的鋰離子電池產量將有所成長,這主要得益於BASF施瓦茨海德工廠和Umicoa-NISA公司的投產。在英國,塔塔化工為捷豹路虎(JLR)提供的年產4萬噸磷酸鐵鋰(LFP)計畫已恢復生產。在南美洲,鋰資源豐富的智利和阿根廷出口氫氧化鋰,供應2.2萬噸正極材料前驅體。摩洛哥的布阿札礦也向歐洲工廠供應硫酸鈷。中東和非洲雖然市場佔有率較小,但擁有戰略性原料,並有潛力成為正極材料前驅體出口地區。這種地理多元化有助於保護正極材料市場免受區域性衝擊的影響。
其他好處:
- Excel格式的市場預測(ME)表
- 3個月的分析師支持
目錄
第1章:引言
- 研究假設和市場定義
- 調查範圍
第2章:調查方法
第3章執行摘要
第4章 市場狀況
- 市場概覽
- 市場促進因素
- 電動車產量激增
- 政府獎勵和排放法規
- 規模經濟效應降低了電池組成本。
- 美國和歐盟陰極供應鏈的本地化
- 鈉離子電池和液態金屬燃料電池的商業化正在推動需求的成長。
- 市場限制因素
- 中國供應鏈集中度
- 固態固態電池降低了陰極質量/kWh。
- 高錳化學物質處理面臨的挑戰
- 價值鏈分析
- 監理情勢
- 波特五力模型
第5章 市場規模與成長預測
- 材料
- 磷酸鋰鐵
- 氧化鈷鋰
- 鋰鎳錳鈷
- 氧化錳鋰
- 鋰鎳鈷鋁氧化物
- 二氧化鉛
- 其他材料(磷酸鐵鈉、羥基磷灰石、石墨)
- 依電池類型
- 鋰離子
- 鉛酸
- 鈉離子
- 液流電池
- 按最終用戶行業分類
- 車
- 家用電子產品
- 電動工具
- 儲能
- 其他終端用戶產業(醫療設備、航太等)
- 按地區
- 亞太地區
- 中國
- 日本
- 韓國
- 印度
- 印尼
- 越南
- 泰國
- 馬來西亞
- 其他亞太國家
- 北美洲
- 美國
- 加拿大
- 墨西哥
- 歐洲
- 德國
- 英國
- 法國
- 義大利
- 西班牙
- 北歐國家
- 土耳其
- 俄羅斯
- 其他歐洲國家
- 南美洲
- 巴西
- 阿根廷
- 其他南美國家
- 中東和非洲
- 沙烏地阿拉伯
- 南非
- 其他中東和非洲國家
- 亞太地區
第6章 競爭情勢
- 市場集中度
- 策略趨勢
- 市佔率和排名分析
- 公司簡介
- BASF
- Contemporary Amperex Technology Co., Limited
- Ecopro BM
- Eramet(Sandouville)
- Guangxi CNGR Advanced Material
- Himadri Speciality Chemical Ltd
- Huayou Cobalt Co., Ltd.
- IBU-tec
- LANDF CORP
- LG Chem
- MITSUI MINING & SMELTING CO.,LTD.
- NICHIA CORPORATION
- Nippon Chemical Industrial Co., Ltd.
- POSCO FUTURE M
- Shenzhen Dynanonic Co., Ltd.
- Showa Denko Materials
- Sumitomo Metal Mining Co., Ltd.
- Targray
- Umicore
- XTC New Energy Materials
第7章 市場機會與未來展望
According to Mordor Intelligence, the cathode materials market size was valued at 3.91 Million tons in 2025 and is estimated to grow from 4.85 Million tons in 2026 to reach 14.32 Million tons by 2031, at a CAGR of 24.15% during the forecast period (2026-2031).
This report is Segmented by Material (Lithium Iron Phosphate, Lithium Cobalt Oxide, Lithium Manganese Oxide, and More), Battery Type (Lithium-Ion, Lead-Acid, Sodium-Ion, and Flow Batteries), End-User Industry (Automotive, Consumer Electronics, and More), and Geography (Asia-Pacific, North America, Europe, South America, and Middle-East and Africa). The Market Forecasts are Provided in Terms of Volume (Tons).
Global Cathode Materials Market Trends and Insights
Surging EV Production Volumes
Global electric-vehicle output climbed to 13.8 million units in 2025 and is predicted to exceed 22 million by 2028, a trajectory that lifts cathode demand because every 60 kWh pack embeds 8-12 kg of active material. BYD plans to double 2024 volumes by manufacturing 4 million plug-ins in 2026, underscoring scale expansion across Asia. The switch to larger-format cells such as CATL's Qilin increases cathode loading per vehicle by thickening electrode coatings. Fleet electrification adds another layer, illustrated by UPS ordering 10,000 LFP-powered delivery vans in 2025. Commercial-vehicle duty cycles favor LFP longevity, providing counter-cyclical stability for the cathode materials market.
Government Incentives and Emissions Regulations
Section 45X of the U.S. Inflation Reduction Act grants USD 10 per kilowatt-hour for domestic cells and USD 45 for modules, triggering 18 U.S. gigafactory announcements totaling 550 GWh of capacity. In Europe, the Battery Regulation mandates carbon-footprint declarations by 2027 and tightens thresholds by 2030, advantaging cathode plants tied to renewable power such as Umicore's Nysa site, which sources 80% wind energy. China extended new-energy vehicle purchase-tax exemptions to 2027, sustaining demand in the world's largest EV arena. India's USD 2.4 billion Production-Linked Incentive for advanced cells lures Reliance Industries and Rajesh Exports, positioning South Asia as a new pole of cathode consumption.
Supply-Chain Concentration in China
China refined 78% of global lithium hydroxide and 93% of manganese sulfate in 2024, exposing Western automakers to delivery risk when domestic suppliers reprioritize local needs. Ford postponed its F-150 Lightning extended-range launch by four months in 2024 after a Chinese precursor partner diverted shipments during a lithium shortage. U.S. defense assessments warn that a Taiwan Strait conflict could choke cathode flows, while European players like Volkswagen's PowerCo rely on China for 82% of NMC precursor. Building a 20 kt/yr precursor plant costs USD 150 million and 30 months, which slows diversification. Compliance with the Uyghur Forced Labor Prevention Act obliges automakers to trace multi-tier suppliers, adding administrative overhead.
Other drivers and restraints analyzed in the detailed report include:
- Battery-Pack Cost Decline from Scale Learning
- Localization of Cathode Supply Chains in US and EU
- Solid-State Batteries Lower Cathode Mass/kWh
For complete list of drivers and restraints, kindly check the Table Of Contents.
Segment Analysis
Lithium iron phosphate accounted for 41.10% of 2025 volume and is anticipated to expand at 24.97% through 2031, reflecting Tesla and BYD adoptions that eliminated cobalt and nickel from mass-market models. BYD's Blade pack narrowed the energy-density gap with NMC 622 to 15%, supporting broader acceptance. Premium brands still specify high-nickel NMC: BMW's Neue Klasse uses NMC 811 at 285 Wh/kg, positioning the chemistry where 500-km range is non-negotiable. Lithium-nickel-cobalt-aluminum holds niche but profitable ground in long-range packs, although sliding cobalt prices erode its margin advantage. Lead dioxide continues in starter batteries yet will cede share as 12-V lithium replacements scale. Sodium iron phosphate's slice will rise as sodium-ion cars launch in price-sensitive Asian markets, broadening the cathode materials market canvas.
Complete Report Scope:
- By Material
- Lithium Iron Phosphate
- Lithium Cobalt Oxide
- Lithium-Nickel Manganese Cobalt
- Lithium Manganese Oxide
- Lithium Nickel Cobalt Aluminium Oxide
- Lead Dioxide
- Other Materials (Sodium Iron Phosphate, Oxyhydroxide, and Graphite)
- By Battery Type
- Lithium-Ion
- Lead-Acid
- Sodium-ion
- Flow batteries
- By End-user Industry
- Automotive
- Consumer Electronics
- Power Tools
- Energy Storage
- Other End-user Industries (Medical Devices, Aerospace, etc)
- By Geography
- Asia-Pacific
- China
- Japan
- South Korea
- India
- Indonesia
- Vietnam
- Thailand
- Malaysia
- Rest of Asia-Pacific
- North America
- United States
- Canada
- Mexico
- Europe
- Germany
- United Kingdom
- France
- Italy
- Spain
- NORDIC Countries
- Turkey
- Russia
- Rest of Europe
- South America
- Brazil
- Argentina
- Rest of South America
- Middle-East and Africa
- Saudi Arabia
- South Africa
- Rest of Middle-East and Africa
- Asia-Pacific
Geography Analysis
Asia-Pacific commanded 79.10% of the market share in 2025 and is on a 26.34% CAGR trajectory to 2031, reflecting deep integration across mining, processing, and cell manufacturing. China anchors this ecosystem through cost advantages and proprietary process expertise, enabling sustained innovation velocity. South Korea and Japan provide complementary high-precision manufacturing and advanced material formulations, reinforcing regional dominance. Indonesia's USD 15 billion in smelting investment and Vietnam's decade-long tax holidays ensure Southeast Asia doubles as both precursor and assembly hub, reinforcing the cathode materials market's eastward gravity.
North America demand is also growing on the back of Section 45X credits that de-risk domestic plants. The United States production is supported by BASF Ohio and Albemarle Kings Mountain, with Canadian capacity tripling once POSCO FUTURE M and Talon Metals commission assets. Mexico's USD 2 billion influx from Ganfeng and Tianqi creates a near-shoring corridor that meets USMCA thresholds. These moves shrink delivery times and diversify the cathode materials market supply chain beyond Asia.
Europe is also rising as the European Battery Alliance bankrolls local output. Germany's production in 2024 climbed with BASF Schwarzheide and Umicore Nysa, while the U.K. rebooted via Tata Chemicals' 40,000 t/yr LFP project to serve JLR. South America's lithium-rich Chile and Argentina export hydroxide feeding 22,000 tons of cathode precursor, and Morocco's Bou-Azzer mine supplies cobalt sulfate to European sites. Middle-East and Africa hold lower share but own strategic raw materials that could reposition them as precursor exporters. Collectively, geographic diversification sustains the cathode materials market against regional shocks.
- BASF
- Contemporary Amperex Technology Co., Limited
- Ecopro BM
- Eramet (Sandouville)
- Guangxi CNGR Advanced Material
- Himadri Speciality Chemical Ltd
- Huayou Cobalt Co., Ltd.
- IBU-tec
- LANDF CORP
- LG Chem
- MITSUI MINING & SMELTING CO.,LTD.
- NICHIA CORPORATION
- Nippon Chemical Industrial Co., Ltd.
- POSCO FUTURE M
- Shenzhen Dynanonic Co., Ltd.
- Showa Denko Materials
- Sumitomo Metal Mining Co., Ltd.
- Targray
- Umicore
- XTC New Energy Materials
Additional Benefits:
- The market estimate (ME) sheet in Excel format
- 3 months of analyst support
TABLE OF CONTENTS
1 Introduction
- 1.1 Study Assumptions and Market Definition
- 1.2 Scope of the Study
2 Research Methodology
3 Executive Summary
4 Market Landscape
- 4.1 Market Overview
- 4.2 Market Drivers
- 4.2.1 Surging EV Production Volumes
- 4.2.2 Government Incentives and Emissions Regulations
- 4.2.3 Battery-Pack Cost Decline from Scale Learning
- 4.2.4 Localization of Cathode Supply Chains in US and EU
- 4.2.5 Sodium-Ion and LMFP Commercialization Expanding Demand
- 4.3 Market Restraints
- 4.3.1 Supply-Chain Concentration in China
- 4.3.2 Solid-State Batteries Lower Cathode Mass/kWh
- 4.3.3 Processing Hurdles for High-Mn Chemistries
- 4.4 Value Chain Analysis
- 4.5 Regulatory Landscape
- 4.6 Porter's Five Forces
- 4.6.1 Bargaining Power of Suppliers
- 4.6.2 Bargaining Power of Buyers
- 4.6.3 Threat of New Entrants
- 4.6.4 Threat of Substitutes
- 4.6.5 Degree of Competition
5 Market Size and Growth Forecasts (Volume)
- 5.1 By Material
- 5.1.1 Lithium Iron Phosphate
- 5.1.2 Lithium Cobalt Oxide
- 5.1.3 Lithium-Nickel Manganese Cobalt
- 5.1.4 Lithium Manganese Oxide
- 5.1.5 Lithium Nickel Cobalt Aluminium Oxide
- 5.1.6 Lead Dioxide
- 5.1.7 Other Materials (Sodium Iron Phosphate, Oxyhydroxide, and Graphite)
- 5.2 By Battery Type
- 5.2.1 Lithium-Ion
- 5.2.2 Lead-Acid
- 5.2.3 Sodium-ion
- 5.2.4 Flow batteries
- 5.3 By End-user Industry
- 5.3.1 Automotive
- 5.3.2 Consumer Electronics
- 5.3.3 Power Tools
- 5.3.4 Energy Storage
- 5.3.5 Other End-user Industries (Medical Devices, Aerospace, etc)
- 5.4 By Geography
- 5.4.1 Asia-Pacific
- 5.4.1.1 China
- 5.4.1.2 Japan
- 5.4.1.3 South Korea
- 5.4.1.4 India
- 5.4.1.5 Indonesia
- 5.4.1.6 Vietnam
- 5.4.1.7 Thailand
- 5.4.1.8 Malaysia
- 5.4.1.9 Rest of Asia-Pacific
- 5.4.2 North America
- 5.4.2.1 United States
- 5.4.2.2 Canada
- 5.4.2.3 Mexico
- 5.4.3 Europe
- 5.4.3.1 Germany
- 5.4.3.2 United Kingdom
- 5.4.3.3 France
- 5.4.3.4 Italy
- 5.4.3.5 Spain
- 5.4.3.6 NORDIC Countries
- 5.4.3.7 Turkey
- 5.4.3.8 Russia
- 5.4.3.9 Rest of Europe
- 5.4.4 South America
- 5.4.4.1 Brazil
- 5.4.4.2 Argentina
- 5.4.4.3 Rest of South America
- 5.4.5 Middle-East and Africa
- 5.4.5.1 Saudi Arabia
- 5.4.5.2 South Africa
- 5.4.5.3 Rest of Middle-East and Africa
- 5.4.1 Asia-Pacific
6 Competitive Landscape
- 6.1 Market Concentration
- 6.2 Strategic Moves
- 6.3 Market Share(%)/Ranking Analysis
- 6.4 Company Profiles (includes Global Overview, Market Overview, Core Segments, Financials, Strategic Information, Products and Services, Recent Developments)
- 6.4.1 BASF
- 6.4.2 Contemporary Amperex Technology Co., Limited
- 6.4.3 Ecopro BM
- 6.4.4 Eramet (Sandouville)
- 6.4.5 Guangxi CNGR Advanced Material
- 6.4.6 Himadri Speciality Chemical Ltd
- 6.4.7 Huayou Cobalt Co., Ltd.
- 6.4.8 IBU-tec
- 6.4.9 LANDF CORP
- 6.4.10 LG Chem
- 6.4.11 MITSUI MINING & SMELTING CO.,LTD.
- 6.4.12 NICHIA CORPORATION
- 6.4.13 Nippon Chemical Industrial Co., Ltd.
- 6.4.14 POSCO FUTURE M
- 6.4.15 Shenzhen Dynanonic Co., Ltd.
- 6.4.16 Showa Denko Materials
- 6.4.17 Sumitomo Metal Mining Co., Ltd.
- 6.4.18 Targray
- 6.4.19 Umicore
- 6.4.20 XTC New Energy Materials
7 Market Opportunities and Future Outlook
- 7.1 White-space and unmet-need assessment

 電解鋅陽極板市場:全球市場預測,2026-2032年正極材料市場:按產品類型、合成方法、電池類型、塗層類型和應用分類-全球市場預測(2026-2032 年)
 鎳基高摻雜陰極材料市場預測至2034年-全球化學成分、形狀、製造流程、應用、最終用戶和區域分析
 LFP 與 LMFP 正極材料市場商機、成長要素、產業趨勢分析及 2026-2035 年預測。
 2026年全球尖晶石正極材料市場報告依純度等級、塗佈、形貌、製造方法、分銷管道、電池規格和應用分類的鈷酸鋰正極粉末市場-全球預測,2026-2032年
 2026-2034年全球下一代負極材料市場規模、佔有率、趨勢和成長分析報告正極材料市場規模、佔有率、成長及全球產業分析:按類型、應用和地區分類,並預測至2026-2034年2026年全球正極材料市場報告硫化物正極材料市場:依材料類型、形態、應用、最終用戶和分銷管道分類-2026年至2032年全球預測