


 |
市場調查報告書
商品編碼
2124075
陶瓷薄膜:市場佔有率分析、產業趨勢與統計、成長預測(2026-2031)Ceramic Membranes - Market Share Analysis, Industry Trends & Statistics, Growth Forecasts (2026 - 2031) |
||||||

※ 本網頁內容可能與最新版本有所差異。詳細情況請與我們聯繫。
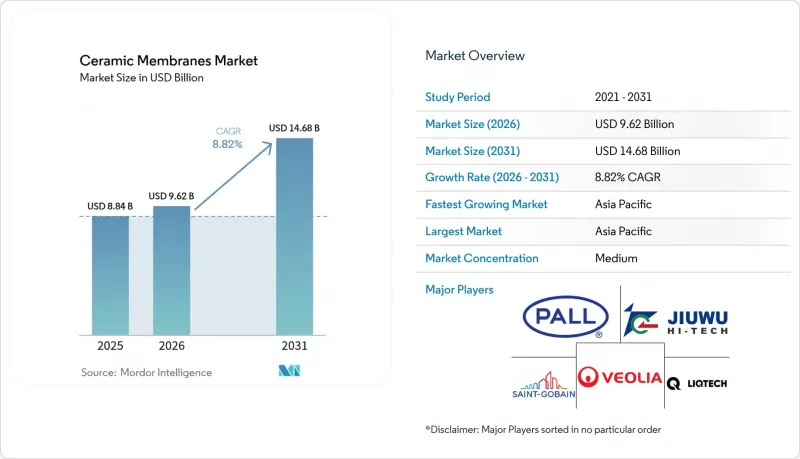
根據 Mordor Intelligence 預測,陶瓷薄膜市場預計將從 2025 年的 88.4 億美元成長到 2026 年的 96.2 億美元,到 2031 年達到 146.8 億美元,2026 年至 2031 年的複合年成長率預計為 8.82%。
本報告按材料類型(氧化鋁、二氧化矽、二氧化鈦、氧化鋯、碳化矽及其他)、終端用戶產業(用水和污水處理、食品飲料、化學、製藥及其他)以及地區(亞太地區、北美地區、歐洲地區、南美地區以及中東和非洲地區)進行細分。市場預測以美元計價。
全球陶瓷薄膜市場趨勢及洞察
對用水和污水處理基礎設施的需求日益成長
新興經濟體的政府正在資助運作只需極少人工干預的去中心化供水系統。印度的「飲用水生命線計畫」(Jal Jeevan Mission)已撥款500億美元用於農村供水項目,並指定在60%的新裝置中使用陶瓷過濾濾膜。這是因為陶瓷微濾膜的反沖洗間隔為72小時,而聚合物濾芯的反沖洗間隔僅24小時。中國對煤化工園區實施的強制性「零液體排放」政策,促使2024年至2025年間,340家工廠共安裝了180萬平方公尺的陶瓷膜。中東地區的工廠,例如ACWA Power的Tawila工廠,目前透過在前端逆滲透(RO)中使用12萬平方公尺的氧化鋁管,將化學藥劑用量減少了35%。美國馬裡蘭州和維吉尼亞的維修計畫也採用了陶瓷膜,在不增加安裝面積的情況下,達到了總氮濃度3毫克/公升的監管標準。這些措施共同促進了公共部門支出,並支撐了陶瓷膜市場的長期需求。
全球對工業污水的監管日益嚴格
在許多地區,監管機構正在收緊排放標準,而聚合物系統難以達到這些標準。美國環保署 (EPA) 2024 年有機化學品排放指南 (ELG) 將生化需氧量 (BOD) 限制在 10 mg/L,濁度限制在 0.5 NTU,陶瓷膜無需混凝處理即可滿足這些標準,從而避免了污泥運輸成本超過每幹噸 80 美元。修訂後的歐盟工業排放指令建議原位就地清洗(CIP) 週期不超過 30 分鐘,陶瓷膜使用 80 度C的 2% 苛性鹼溶液即可滿足此標準。中國藥品標準 GB 31962-2015 將化學需氧量 (COD) 上限設定為 50 mg/L,為此,浙江省 22 家原料藥廠計劃在 2025 年前改用陶瓷膜設備,以避免每次違規被處以 50 萬元人民幣的罰款。這些政策趨勢預計將對陶瓷膜市場產生持續的上行壓力,預計複合年成長率將達到 2.1 個百分點。
低壓聚合物基替代品在低TDS應用的普及
對於低濁度地表水,聚合物中空纖維膜的初始投資成本仍低於陶瓷膜。根據美國自來水廠協會 (AWWA) 2025 年的一項調查,聚合物過濾的成本為每立方公尺每天 420 美元,而陶瓷薄膜的成本為 680 美元。新型聚醚碸 (PES) 組件可耐受 500 ppm 的次氯酸鈉,縮小了兩者在耐化學性方面的差距。水環境聯合會 (WEF) 2025 年的一項調查發現,62% 的北美供水事業優先考慮的是較低的 10 年淨現值 (NPV),而不是盡可能長的使用壽命。在維修老舊低壓水廠時,每套裝置的輔助升級成本為 15 萬至 30 萬美元,因此,在這種情況下,陶瓷膜市場的短期成長潛力有限。
細分市場分析
預計到2025年,氧化鋁將佔陶瓷薄膜市場銷售額的44.12%,成為該市場的主導力量。碳化矽在磨料應用領域緊隨其後,但受半導體和製藥業對50奈米截止製程的需求驅動,二氧化鈦基產品預計將以9.80%的複合年成長率快速成長。隨著中國國內產能的擴張,氧化鋁基陶瓷薄膜市場預計到2031年將達到65億美元,單價也將降至200美元/平方公尺以下。目前仍有成本差距,二氧化鈦由於需要相控燒結工藝,價格在320美元至400美元/平方米之間,但其光催化自清潔性能使其在高純度工藝中仍能保持較高的價格。新興的玻璃陶瓷複合材料有望實現適中的成本和較寬的pH耐受範圍,預示著未來市場佔有率的重新分配。
由於價格和耐久性優勢,氧化鋁將在2031年之前保持強勁的市場優勢,但其應用領域正變得日益多元化。碳化矽的莫氏硬度高達9.5,在礦業廢棄物和頁岩氣生產廢水的處理中不可或缺。氧化鋯用於富含溶劑的有機物的奈米過濾,但由於氧化釔穩定化帶來的成本限制,其市佔率仍低於6%。隨著ISO 19749光催化活性測試標準的修訂,二氧化鈦供應商將能夠在抗污染性能方面脫穎而出,從而在陶瓷薄膜市場保持接近兩位數的高速成長。
區域分析
預計到2025年,亞太地區將佔全球銷售額的52.98%,並在2031年之前以10.02%的複合年成長率成長,這主要得益於基礎設施建設的加速、排放標準的日益嚴格以及本地化生產的擴大。中國的「十四五」規劃已撥款1800億元用於工業污水處理設施的維修,而像九物這樣的國內供應商目前提供的價格比進口產品低30%。印度的「飲用水生命線計畫」(Jal Jeevan Mission)強制要求60%的村莊水質淨化設施使用陶瓷膜,這將擴大南亞地區對陶瓷膜的潛在需求。日本、韓國和台灣地區正在為能夠實現先進水資源再利用的產業園區提供資金,進一步鞏固了其區域優勢。
北美在2025年的市佔率成長得益於《清潔水法》的實施、為原住民供水系統提供的資金以及頁岩氣生產廢水的回收。密爾瓦基、紐瓦克和弗林特正在試驗建造陶瓷處理設施以去除顆粒鉛,預計到2028年將催生一個價值9億美元的市政基礎設施維修市場。加拿大19億加元的偏遠社區支援計畫也同樣優先考慮陶瓷產品,因為陶瓷產品具有耐凍融的特性。在墨西哥的巴希奧工業走廊,預計2025年將有14座新的陶瓷污水處理廠投入運營,這將鞏固該地區作為北美大陸製造地的地位。
2025年歐洲市場價值的提升主要得益於監管力道超過了預算方面的阻力。德國正在補貼波羅的海流域徑流的營養物移除,英國透過AMP8計畫資助磷減排,荷蘭則在加速PVDF膜的替代。儘管南歐的資本投資成長緩慢,但在高鹽環境這一細分市場,陶瓷膜的競標仍然穩定。拉丁美洲、中東和非洲合計僅佔7%的市場佔有率,但沙烏地阿拉伯和阿拉伯聯合大公國數十億美元的海水淡化廠維修計畫表明,全球陶瓷膜市場存在高成長領域。
其他好處:
- Excel格式的市場預測(ME)表
- 3個月的分析師支持
目錄
第1章:引言
- 研究假設和市場定義
- 調查範圍
第2章:調查方法
第3章執行摘要
第4章 市場狀況
- 市場概覽
- 市場促進因素
- 對用水和污水處理基礎設施的需求日益成長
- 全球對工業污水的監管日益嚴格
- 與聚合物薄膜相比,使用壽命更長,生命週期成本更低。
- 擴大乳製品和飲料產業蛋白質濃縮製程的應用
- 針對聚偏氟乙烯(PVDF)薄膜的相關法規的訂定,促進了陶瓷薄膜的普及應用。
- 市場限制因素
- 低壓聚合物基替代品在低TDS應用的普及
- 地方政府公共產業人員缺乏專業知識
- 亞洲以外地區大規模陶瓷管供應商短缺
- 價值鏈分析
- 波特五力模型
第5章 市場規模與成長預測
- 依材料類型
- 氧化鋁
- 二氧化矽
- 提泰妮婭
- 氧化鋯
- 碳化矽
- 其他材質(玻璃材質、氧化鎂、碳、玻璃陶瓷複合材料等)
- 按最終用戶行業分類
- 供水和廢水處理
- 食品/飲料
- 化工
- 製藥
- 其他(生物技術、紡織、石油化工等)
- 按地區
- 亞太地區
- 中國
- 印度
- 日本
- 韓國
- 馬來西亞
- 泰國
- 印尼
- 越南
- 其他亞太國家
- 北美洲
- 美國
- 加拿大
- 墨西哥
- 歐洲
- 德國
- 英國
- 法國
- 義大利
- 西班牙
- 北歐國家
- 土耳其
- 俄羅斯
- 其他歐洲國家
- 南美洲
- 巴西
- 阿根廷
- 哥倫比亞
- 其他南美國家
- 中東和非洲
- 沙烏地阿拉伯
- 卡達
- 阿拉伯聯合大公國
- 奈及利亞
- 埃及
- 南非
- 其他中東和非洲國家
- 亞太地區
第6章 競爭情勢
- 市場集中度
- 策略趨勢
- 市佔率和排名分析
- 公司簡介
- ALSYS
- atech innovations GmbH
- Ceraflo Pte Ltd
- GEA Group Aktiengesellschaft
- JIUWU HI-TECH
- Kovalus Separation Solutions
- LiqTech Holding A/S
- Membracon
- METAWATER. CO. LTD
- Nanostone
- Pall Corporation
- Qua Group LLC
- Saint-Gobain
- Sterlitech Corporation
- TAMI Industries
- Veolia
第7章 市場機會與未來展望
According to Mordor Intelligence, the ceramic membranes market size is expected to increase from USD 8.84 billion in 2025 to USD 9.62 billion in 2026 and reach USD 14.68 billion by 2031, growing at a CAGR of 8.82% over 2026-2031.
This report is Segmented by Material Type (Alumina, Silica, Titania, Zirconium Oxide, Silicon Carbide, and Others), End-User Industry (Water and Wastewater Treatment, Food and Beverage, Chemical Industry, Pharmaceutical, and Others), and Geography (Asia-Pacific, North America, Europe, South America, and the Middle East and Africa). The Market Forecasts are Provided in Terms of Value (USD).
Global Ceramic Membranes Market Trends and Insights
Rising Demand for Water & Wastewater Treatment Infrastructure
Emerging-economy governments are funding decentralized systems that operate with minimal operator input. India's Jal Jeevan Mission allocated USD 50 billion to rural water supply and specified ceramic microfiltration for 60% of new installations because backwash intervals stretch to 72 hours versus 24 hours for polymeric cartridges. China's zero-liquid-discharge mandate for coal-chemical parks drove 1.8 million m2 of ceramic area installations across 340 plants in 2024-2025. Middle-Eastern plants, such as ACWA Power's Taweelah facility, now front-load RO with 120,000 m2 of alumina tubes, cutting chemical dosing by 35%. U.S. nutrient-removal retrofits in Maryland and Virginia adopted ceramic membranes to meet 3 mg/L total nitrogen limits without footprint expansion. Collectively, these programs lift public-sector spending, anchoring longer-term demand for the ceramic membrane market.
Stringent Industrial Effluent Regulations Worldwide
Across regions, regulators are tightening discharge limits that polymeric systems struggle to meet. The US EPA's 2024 Organic-Chemicals ELGs limit BOD to 10 mg/L and turbidity to 0.5 NTU; ceramic membranes comply without flocculation, avoiding sludge-haul costs that exceed USD 80 per dry ton. Europe's revised Industrial Emissions Directive now favors cleaning-in-place cycles under 30 minutes, a benchmark ceramics reach with 2% caustic at 80°C. China's pharmaceutical standard GB 31962-2015 caps COD at 50 mg/L, prompting 22 API plants in Zhejiang to switch to ceramic units in 2025 to avoid CNY 500,000 penalties per incident. These simultaneous policy moves add a durable 2.1-point lift to the forecast CAGR for the ceramic membrane market.
Prevalence of Low-Pressure Polymeric Alternatives in Low-TDS Uses
In low-turbidity surface water, polymeric hollow-fiber capital still undercuts ceramics. A 2025 American Water Works Association survey put polymeric microfiltration at USD 420 per m3/day versus USD 680 for ceramics. New PES modules tolerate 500 ppm sodium hypochlorite, narrowing the chemical-resistance gap. Sixty-two percent of North American utilities in a 2025 Water Environment Federation poll ranked the lowest 10-year NPV above the longest life. Retrofitting older low-pressure plants can add USD 150,000-300,000 in ancillary upgrades per train, muting the ceramic membrane market's near-term upside in these settings.
Other drivers and restraints analyzed in the detailed report include:
- Longer Service-Life & Lower Lifecycle Cost vs. Polymeric Membranes
- Expansion of Dairy & Beverage Protein-Concentration Processes
- Limited Operator Expertise at Municipal Utilities
For complete list of drivers and restraints, kindly check the Table Of Contents.
Segment Analysis
Alumina captured 44.12% of 2025 revenue, making it the anchor of the ceramic membrane market share. Silicon-carbide follows in abrasive service, but titania variants are set to grow fastest at 9.80% CAGR on semiconductor and pharma demand for 50 nm cut-offs. The ceramic membrane market size for alumina-based elements is projected to reach USD 6.5 billion by 2031 as domestic Chinese capacity pushes unit prices below USD 200/m2. Cost differentials persist, titania commands USD 320-400/m2 due to phase-control firing, yet its photocatalytic self-cleaning provides a premium in high-purity operations. Emerging glass-ceramic composites promise mid-range cost and broad pH tolerance, hinting at future share redistribution.
Price and durability advantages keep alumina firmly ahead through 2031, but the application mix is diversifying. Silicon-carbide's Mohs 9.5 hardness makes it indispensable for mining tailings and shale-gas produced water. Zirconia serves solvent-rich organic nanofiltration, though its yttria stabilization cost caps volume under 6%. ISO 19749 test updates covering photocatalytic activity will help titania suppliers differentiate on fouling resistance, maintaining a high single-digit growth trajectory inside the ceramic membrane market.
Complete Report Scope:
- By Material Type
- Alumina
- Silica
- Titania
- Zirconium Oxide
- Silicon Carbide
- Others (Glassy Materials, Magnesia, carbon, Glass-Ceramic composites, etc.)
- By End-user Industry
- Water and Wastewater Treatment
- Food and Beverage
- Chemical Industry
- Pharmaceutical
- Others (Biotechnology, Textile, Petrochemical, etc.)
- By Geography
- Asia-Pacific
- China
- India
- Japan
- South Korea
- Malaysia
- Thailand
- Indonesia
- Vietnam
- Rest of Asia-Pacific
- North America
- United States
- Canada
- Mexico
- Europe
- Germany
- United Kingdom
- France
- Italy
- Spain
- NORDIC Countries
- Turkey
- Russia
- Rest of Europe
- South America
- Brazil
- Argentina
- Colombia
- Rest of South America
- Middle-East and Africa
- Saudi Arabia
- Qatar
- United Arab Emirates
- Nigeria
- Egypt
- South Africa
- Rest of Middle-East and Africa
- Asia-Pacific
Geography Analysis
Asia-Pacific held 52.98% of 2025 revenue and will grow at 10.02% CAGR through 2031 on synchronized infrastructure build-outs, stricter discharge limits, and localized manufacturing. China's 14th Five-Year Plan earmarked CNY 180 billion for industrial wastewater upgrades, and domestic suppliers such as JIUWU now quote 30% below imports. India's Jal Jeevan Mission specs ceramics for 60% of village plants, raising the ceramic membrane market's addressable volume across South Asia. Japan, South Korea, and Taiwan fund high-reuse industrial parks, further cementing regional dominance.
North America's 2025 market share was lifted by Clean Water Act compliance, Indigenous water-system funding, and shale-gas produced-water recycling. Milwaukee, Newark, and Flint pilot ceramic plants to remove particulate lead, potentially opening a USD 900 million municipal retrofit pool by 2028. Canada's CAD 1.9 billion remote-community program likewise favors ceramics thanks to freeze-thaw durability. Mexico's Bajio industrial corridor added 14 ceramic wastewater plants in 2025, cementing a continental manufacturing-hub trend.
Europe's 2025 market value was impacted by regulatory momentum trumping budget headwinds. Germany subsidizes Baltic runoff nutrient removal, the UK funds AMP8 phosphorus cuts, and the Netherlands fast-tracks PVDF swap-outs. Southern Europe lags on capex, but high-salinity niches still pull in ceramic bids. Latin America and Middle East-Africa together form a 7% sliver, yet billion-dollar desalination retrofits in Saudi Arabia and UAE telegraph high-growth pockets inside the global ceramic membrane market.
- ALSYS
- atech innovations GmbH
- Ceraflo Pte Ltd
- GEA Group Aktiengesellschaft
- JIUWU HI-TECH
- Kovalus Separation Solutions
- LiqTech Holding A/S
- Membracon
- METAWATER. CO. LTD
- Nanostone
- Pall Corporation
- Qua Group LLC
- Saint-Gobain
- Sterlitech Corporation
- TAMI Industries
- Veolia
Additional Benefits:
- The market estimate (ME) sheet in Excel format
- 3 months of analyst support
TABLE OF CONTENTS
1 Introduction
- 1.1 Study Assumptions and Market Definition
- 1.2 Scope of the Study
2 Research Methodology
3 Executive Summary
4 Market Landscape
- 4.1 Market Overview
- 4.2 Market Drivers
- 4.2.1 Rising Demand for Water & Wastewater Treatment Infrastructure
- 4.2.2 Stringent Industrial Effluent Regulations Worldwide
- 4.2.3 Longer Service-Life & Lower Lifecycle Cost vs. Polymeric Membranes
- 4.2.4 Expansion of Dairy & Beverage Protein-Concentration Processes
- 4.2.5 Pending PVDF-based Membrane Restrictions Driving Ceramic Adoption
- 4.3 Market Restraints
- 4.3.1 Prevalence of Low-Pressure Polymeric Alternatives in Low-TDS Uses
- 4.3.2 Limited Operator Expertise at Municipal Utilities
- 4.3.3 Scarcity of Large-Scale Ceramic Tube Suppliers Outside Asia
- 4.4 Value Chain Analysis
- 4.5 Porter's Five Forces
- 4.5.1 Bargaining Power of Suppliers
- 4.5.2 Bargaining Power of Buyers
- 4.5.3 Threat of New Entrants
- 4.5.4 Threat of Substitutes
- 4.5.5 Degree of Competition
5 Market Size and Growth Forecasts (Value)
- 5.1 By Material Type
- 5.1.1 Alumina
- 5.1.2 Silica
- 5.1.3 Titania
- 5.1.4 Zirconium Oxide
- 5.1.5 Silicon Carbide
- 5.1.6 Others (Glassy Materials, Magnesia, carbon, Glass-Ceramic composites, etc.)
- 5.2 By End-user Industry
- 5.2.1 Water and Wastewater Treatment
- 5.2.2 Food and Beverage
- 5.2.3 Chemical Industry
- 5.2.4 Pharmaceutical
- 5.2.5 Others (Biotechnology, Textile, Petrochemical, etc.)
- 5.3 By Geography
- 5.3.1 Asia-Pacific
- 5.3.1.1 China
- 5.3.1.2 India
- 5.3.1.3 Japan
- 5.3.1.4 South Korea
- 5.3.1.5 Malaysia
- 5.3.1.6 Thailand
- 5.3.1.7 Indonesia
- 5.3.1.8 Vietnam
- 5.3.1.9 Rest of Asia-Pacific
- 5.3.2 North America
- 5.3.2.1 United States
- 5.3.2.2 Canada
- 5.3.2.3 Mexico
- 5.3.3 Europe
- 5.3.3.1 Germany
- 5.3.3.2 United Kingdom
- 5.3.3.3 France
- 5.3.3.4 Italy
- 5.3.3.5 Spain
- 5.3.3.6 NORDIC Countries
- 5.3.3.7 Turkey
- 5.3.3.8 Russia
- 5.3.3.9 Rest of Europe
- 5.3.4 South America
- 5.3.4.1 Brazil
- 5.3.4.2 Argentina
- 5.3.4.3 Colombia
- 5.3.4.4 Rest of South America
- 5.3.5 Middle-East and Africa
- 5.3.5.1 Saudi Arabia
- 5.3.5.2 Qatar
- 5.3.5.3 United Arab Emirates
- 5.3.5.4 Nigeria
- 5.3.5.5 Egypt
- 5.3.5.6 South Africa
- 5.3.5.7 Rest of Middle-East and Africa
- 5.3.1 Asia-Pacific
6 Competitive Landscape
- 6.1 Market Concentration
- 6.2 Strategic Moves
- 6.3 Market Share(%)/Ranking Analysis
- 6.4 Company Profiles (includes Global Overview, Market Overview, Core Segments, Financials, Strategic Information, Products and Services, Recent Developments)
- 6.4.1 ALSYS
- 6.4.2 atech innovations GmbH
- 6.4.3 Ceraflo Pte Ltd
- 6.4.4 GEA Group Aktiengesellschaft
- 6.4.5 JIUWU HI-TECH
- 6.4.6 Kovalus Separation Solutions
- 6.4.7 LiqTech Holding A/S
- 6.4.8 Membracon
- 6.4.9 METAWATER. CO. LTD
- 6.4.10 Nanostone
- 6.4.11 Pall Corporation
- 6.4.12 Qua Group LLC
- 6.4.13 Saint-Gobain
- 6.4.14 Sterlitech Corporation
- 6.4.15 TAMI Industries
- 6.4.16 Veolia
7 Market Opportunities and Future Outlook
- 7.1 White-space and Unmet-need Assessment

 硬塗層過濾器市場規模、佔有率和成長分析:按過濾器類型、塗層類型、基材、最終用戶、應用和地區分類-2026-2033年產業預測
 陶瓷薄膜市場:2026-2032年全球市場預測(按產品類型、材質、模組配置、技術、應用和分銷管道分類)
 陶瓷薄膜市場:按材料、應用、技術和地區分類
 全球陶瓷膜市場規模、佔有率、趨勢和成長分析報告(2026-2034)
 2026年全球陶瓷膜市場報告氧化鋁基陶瓷膜市場按孔徑、材料類型、製造流程、膜結構、應用和終端用戶產業分類,全球預測,2026-2032年陶瓷膜檢測設備市場(按設備類型、檢測技術、膜材料、檢測參數、應用和最終用戶分類)—2026-2032年全球預測飲用水用陶瓷平板膜市場:按膜材料、孔徑、流道結構、組件類型、運行模式、應用和最終用戶分類,全球預測(2026-2032年)
 陶瓷膜市場規模、佔有率及成長分析(按材料、應用、技術及地區分類)-2026-2033年產業預測
 陶瓷膜市場規模、佔有率、趨勢分析報告:按技術、應用、地區、細分市場預測,2025-2030 年