


 |
市場調查報告書
商品編碼
2124035
區塊鏈物聯網:市場佔有率分析、產業趨勢與統計、成長預測(2026-2031)Blockchain IoT - Market Share Analysis, Industry Trends & Statistics, Growth Forecasts (2026 - 2031) |
||||||

※ 本網頁內容可能與最新版本有所差異。詳細情況請與我們聯繫。
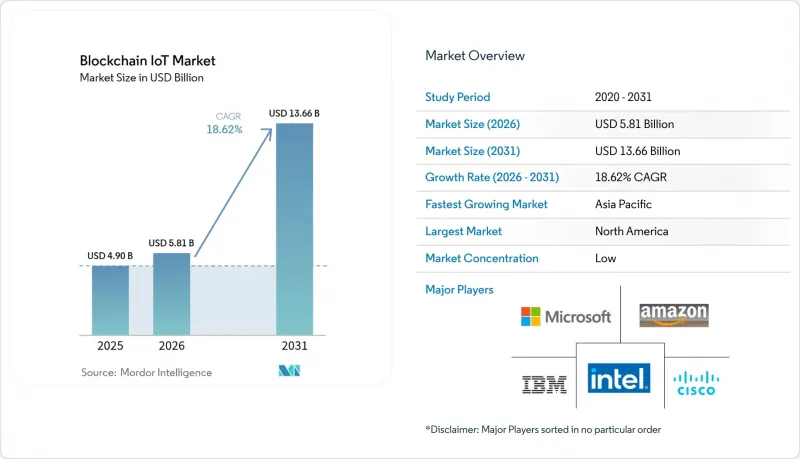
據 Mordor Intelligence 稱,2025 年區塊鏈物聯網市場價值 49 億美元,預計將從 2026 年的 58.1 億美元成長到 2031 年的 136.6 億美元。
預測期(2026-2031 年)的複合年成長率預計為 18.62%。
本報告按交付類型(硬體、軟體、基礎設施)、應用領域(資料安全、智慧合約與自動化、資料通訊與完整性等)、最終使用者(製造業、能源與公共產業、運輸與物流等)以及地區(北美、歐洲、南美、亞太、中東和非洲)進行細分。市場預測以美元計價。
全球區塊鏈物聯網市場趨勢與洞察
針對物聯網設備的網路攻擊激增,推動了對防篡改帳本的需求。
隨著惡意軟體的爆炸性成長,企業被迫在協議層面建構安全防護。與中心化模式相比,輕量級區塊鏈共識機制可將吞吐量提升 15%,延遲降低 20%,惡意裝置偵測率高達 95.2%。首席資訊安全(CISO) 越來越意識到分散式帳本在零信任架構中的必要性。
加快監管步伐,確保供應鏈透明度
諸如美國《聯邦供應鏈本地化和製造發展法案》和歐盟的eIDAS 2.0等法規都要求檢驗的來源證明。加州機動車輛管理局(DMV)已將4,200萬張車輛所有權證書遷移到區塊鏈上,證明了區塊鏈在大規模公共部門實用化中的可行性。
設備運算能力對加密處理工作負載的限制
在微控制器上進行的 PoW(工作量證明)測試暴露出過高的能耗,導致供應商轉向卸載式或硬體加速雜湊演算法。 FPGA SHA-256 核心可將動態功耗降低至軟體的約千分之一。成本壁壘將市場分類為高階區塊鏈設備和輕量級身份驗證設備兩大類。
細分市場分析
到2025年,硬體將佔區塊鏈物聯網市場佔有率的45.40%,其核心是用於保護設備金鑰的安全元件和加密協處理器。這一部分能夠有效防止工業機器人和聯網汽車等設備韌體遭到竄改,進而保障區塊鏈物聯網市場的規模。隨著企業從試點雲端遷移到生產網路,包括二層匯總和邊緣驗證器在內的基礎設施預計將以20.90%的複合年成長率成長。軟體平台則透過API閘道器隱藏帳本的複雜性,從而完善整個技術堆疊。
基礎設施的快速成長反映了區塊鏈即服務 (BaaS) 產品組合的成熟,超大規模資料中心業者正在整合編配、合規性和監控功能。由於公有鏈難以滿足確定性延遲閾值,私有帳本或聯盟帳本正逐漸成為關鍵任務型工作負載的主流選擇。混合架構將本地叢集叢集與公共支付層融合,以犧牲完全去中心化為代價,實現了確定性效能。代幣獎勵閘道器透過獎勵營運商提供頻寬和運算能力,建立了一個能夠資金籌措的骨幹網路,這將支持區塊鏈物聯網市場的未來成長。
區域分析
北美地區在美國《聯邦短期貸款市場法案》(FSLMDA)和大量創業投資資金的支持下,預計2025年將佔區塊鏈物聯網市場收入的35.60%。聯邦和省級層級的試點項目,包括4,200萬份區塊鏈認證的車輛所有權證書,正在推動公共登記簿中帳本使用的標準化。加拿大公共產業正在開發P2P能源交易平台,而墨西哥出口商正在採用原產地證書帳本,以滿足《美墨加協定》(USMCA)的可追溯性要求。
亞太地區預計到2031年將以19.23%的複合年成長率成長,這主要得益於中國到2027年實現36億蜂巢式物聯網連接的目標。日本在區塊鏈和物聯網互通性標準的製定方面主導,韓國正在將5G與分散式帳本相結合,應用於智慧城市電網,印度正在其作物保險計劃中試點區塊鏈技術。澳洲正在將檢驗的感測技術應用於其採礦業的合規管理。
歐洲已建立起健全的跨境設備識別法律體制,這得益於《加密資產市場監管條例》(MiCA) 和 eIDAS 2.0。德國正積極推動工業領域的應用,荷蘭正在追蹤港口貨物,法國則致力於奢侈品供應鏈的數位化。歐洲資料保護委員會 (EDPB) 發布的 2025 年指南詳細闡述了基於「隱私設計」的帳本架構。
在中東和非洲,區塊鏈技術正被用於繞過傳統電網,從而實現智慧電錶的部署和利用無人機進行資產巡檢的試點計畫。在一些南美礦山,ESG(環境、社會和治理)指標被記錄在區塊鏈上,以確保出口價格溢價。
其他好處:
- Excel格式的市場預測(ME)表
- 3個月的分析師支持
目錄
第1章:引言
- 研究假設和市場定義
- 調查範圍
第2章:調查方法
第3章執行摘要
第4章 市場狀況
- 市場概覽
- 市場促進因素
- 針對物聯網設備的網路攻擊激增,推動了對具有防篡改功能的帳本的需求。
- 加速推進供應鏈透明度監管(ESG、eIDAS 2.0、美國《聯邦證券法》)
- 結合邊緣運算和第 2 層聚合的投資,以實現低延遲共識。
- 透過DID/檢驗憑證框架實現設備識別碼的標準化
- 利用DePIN代幣的獎勵感測器網路的興起
- 利用鏈上歷史證明代幣實現數位孿生貨幣化
- 市場限制因素
- 終端運算能力在加密處理工作負載方面的局限性
- 區塊鏈協議與物聯網標準之間互通性的碎片化
- 工作量證明/歷史證明中邊緣節點的能源成本不斷上升。
- 圍繞代幣化機器資料所有權的監管不確定性
- 產業價值鏈分析
- 監理情勢
- 技術展望
- 波特五力模型
- 對影響市場的宏觀經濟因素進行評估
第5章 市場規模與成長預測
- 報價
- 硬體
- 物聯網感測器和執行器
- 閘道器和邊緣設備
- 連接模組
- 區塊鏈晶片組
- 軟體
- 中介軟體平台
- 智慧合約管理
- 身分和存取管理
- 分析與視覺化
- 基礎設施
- 公鏈
- 私有/聯盟鏈
- 雲端和邊緣服務
- 硬體
- 透過使用
- 資料安全
- 智慧合約和自動化
- 資料通訊和數據完整性
- 資產追蹤與管理
- 預測性保護
- 其他小眾應用
- 最終用戶
- 製造業
- 能源公用事業
- 運輸/物流
- 建築管理和智慧設施
- 零售與電子商務
- 智慧城市與政府
- 醫療保健和生命科學
- 農業
- 按地區
- 北美洲
- 美國
- 加拿大
- 墨西哥
- 南美洲
- 巴西
- 阿根廷
- 其他南美國家
- 歐洲
- 德國
- 英國
- 法國
- 義大利
- 西班牙
- 俄羅斯
- 其他歐洲國家
- 亞太地區
- 中國
- 印度
- 日本
- 韓國
- 澳洲和紐西蘭
- 其他亞太國家
- 中東和非洲
- 中東
- 沙烏地阿拉伯
- 阿拉伯聯合大公國
- 土耳其
- 其他中東國家
- 非洲
- 南非
- 奈及利亞
- 其他非洲國家
- 中東
- 北美洲
第6章 競爭情勢
- 市場集中度
- 策略趨勢
- 市佔率分析
- 公司簡介
- IBM Corporation
- Intel Corporation
- Microsoft Corporation
- Cisco Systems Inc.
- Amazon Web Services Inc.
- Robert Bosch GmbH
- The Linux Foundation(Hyperledger)
- KrypC Technologies Pvt. Ltd.
- IoTeX Foundation
- R3 LLC
- IOTA Foundation
- Waltonchain Technology Co. Ltd.
- VeChain Foundation
- Helium Systems Inc.
- Filament LLC
- Samsung SDS Co. Ltd.
- Hitachi Ltd.
- Huawei Technologies Co. Ltd.
- Chainlink Labs
- Oracle Corporation
- Ericsson AB
- Dragino Technology Co. Ltd.
第7章 市場機會與未來展望
According to Mordor Intelligence, the blockchain IoT market size was valued at USD 4.90 billion in 2025 and estimated to grow from USD 5.81 billion in 2026 to reach USD 13.66 billion by 2031, at a CAGR of 18.62% during the forecast period (2026-2031).
This report is Segmented by Offering (Hardware, Software, Infrastructure), Application (Data Security, Smart Contracts and Automation, Data Communication and Integrity, and More), End User (Manufacturing, Energy and Utility, Transportation and Logistics, and More), and Geography (North America, Europe, South America, Asia Pacific, and Middle East and Africa). The Market Forecasts are Provided in Terms of Value (USD).
Global Blockchain IoT Market Trends and Insights
Surge in IoT-centric cyber-attacks elevating demand for tamper-proof ledgers
Exploding malware volumes force enterprises to embed security at the protocol level. A lightweight blockchain consensus achieved 95.2% malicious-device detection with 15% higher throughput and 20% lower latency than centralised models. Chief information security officers increasingly regard distributed ledgers as mandatory for zero-trust architectures.
Acceleration of supply-chain transparency mandates
Regulations such as the US Federal Supply Chain Localisation and Manufacturing Development Act and EU eIDAS 2.0 oblige verifiable provenance. California's DMV moved 42 million car titles on-chain, proving large-scale public deployment viability.
Limited on-device computing power for cryptographic workloads
Proof-of-Work tests on micro-controllers showed untenable energy draw, pushing vendors toward offloaded or hardware-accelerated hashing. FPGA SHA-256 cores cut dynamic power nearly 1,000-fold versus software. Cost barriers split the market between premium blockchain-capable devices and lightweight authenticators.
Other drivers and restraints analyzed in the detailed report include:
- Edge-computing investments with Layer-2 roll-ups
- Standardisation of device identities via DID / VCs
- Rising energy cost for consensus edge nodes
For complete list of drivers and restraints, kindly check the Table Of Contents.
Segment Analysis
Hardware held 45.40% share of the blockchain IoT market in 2025, anchored by secure elements and cryptographic co-processors that safeguard device keys. The segment safeguards the blockchain IoT market size against firmware tampering across industrial robots and connected vehicles. Infrastructure, spanning Layer-2 roll-ups and edge validators, is projected to expand at 20.90% CAGR as enterprises migrate from pilot clouds to production-grade networks. Software platforms complete the stack by masking ledger complexity through API gateways.
The infrastructure boom reflects the maturity of blockchain-as-a-service portfolios from hyperscalers that bundle orchestration, compliance, and monitoring. Public chains struggle to match deterministic latency thresholds, so private or consortium-ledgers dominate mission-critical workloads. Hybrid architectures fuse on-prem edge clusters with public settlement layers, trading full decentralisation for deterministic performance. Token-incentivised gateways reward operators for bandwidth and compute contributions, nurturing a self-financing backbone that underpins future growth of the blockchain IoT market.
Complete Report Scope:
- By Offering
- Hardware
- IoT Sensors and Actuators
- Gateways and Edge Devices
- Connectivity Modules
- Blockchain Chipsets
- Software
- Middleware Platforms
- Smart-Contract Management
- Identity and Access Management
- Analytics and Visualization
- Infrastructure
- Public Chains
- Private/Consortium Chains
- Cloud and Edge Services
- Hardware
- By Application
- Data Security
- Smart Contracts and Automation
- Data Communication and Integrity
- Asset Tracking and Management
- Predictive Maintenance
- Other Niche Applications
- By End User
- Manufacturing
- Energy and Utilities
- Transportation and Logistics
- Building Management and Smart Facilities
- Retail and eCommerce
- Smart Cities and Government
- Healthcare and Life Sciences
- Agriculture
- By Geography
- North America
- United States
- Canada
- Mexico
- South America
- Brazil
- Argentina
- Rest of South America
- Europe
- Germany
- United Kingdom
- France
- Italy
- Spain
- Russia
- Rest of Europe
- Asia-Pacific
- China
- India
- Japan
- South Korea
- Australia and New Zealand
- Rest of Asia-Pacific
- Middle East and Africa
- Middle East
- Saudi Arabia
- United Arab Emirates
- Turkey
- Rest of Middle East
- Africa
- South Africa
- Nigeria
- Rest of Africa
- Middle East
- North America
Geography Analysis
North America retained 35.60% of the blockchain IoT market revenue in 2025, aided by the US FSLMDA and deep venture funding pools. Federal and state pilots-such as 42 million blockchain-verified car titles-canonicalise ledger usage in public registries. Canadian utilities deploy peer-to-peer energy marketplaces, whereas Mexican exporters adopt provenance ledgers to satisfy USMCA traceability clauses.
APAC posts a 19.23% CAGR outlook to 2031, anchored by China's goal of 3.6 billion cellular IoT links by 2027 . Japan spearheads blockchain-IoT interoperability standards, South Korea couples 5G and distributed ledgers in smart-city grids, and India pilots blockchain in crop-insurance schemes. Australia applies verified sensing to mining compliance.
Europe gains from the Markets in Crypto-Assets Regulation and eIDAS 2.0, supplying robust legal scaffolding for cross-border device identity. Germany champions industrial roll-outs, the Netherlands tracks port cargo, and France digitises luxury supply chains. The European Data Protection Board's 2025 guidelines detail privacy-by-design ledger architectures
The Middle East and Africa leverage blockchain to leapfrog legacy grids, piloting smart-meter roll-outs and drone-based asset inspection. Selected South-American mines record ESG metrics on-chain to secure premium export pricing.
- IBM Corporation
- Intel Corporation
- Microsoft Corporation
- Cisco Systems Inc.
- Amazon Web Services Inc.
- Robert Bosch GmbH
- The Linux Foundation (Hyperledger)
- KrypC Technologies Pvt. Ltd.
- IoTeX Foundation
- R3 LLC
- IOTA Foundation
- Waltonchain Technology Co. Ltd.
- VeChain Foundation
- Helium Systems Inc.
- Filament LLC
- Samsung SDS Co. Ltd.
- Hitachi Ltd.
- Huawei Technologies Co. Ltd.
- Chainlink Labs
- Oracle Corporation
- Ericsson AB
- Dragino Technology Co. Ltd.
Additional Benefits:
- The market estimate (ME) sheet in Excel format
- 3 months of analyst support
TABLE OF CONTENTS
1 INTRODUCTION
- 1.1 Study Assumptions and Market Definition
- 1.2 Scope of the Study
2 RESEARCH METHODOLOGY
3 EXECUTIVE SUMMARY
4 MARKET LANDSCAPE
- 4.1 Market Overview
- 4.2 Market Drivers
- 4.2.1 Surge in IoT-centric cyber-attacks elevating demand for tamper-proof ledgers
- 4.2.2 Acceleration of supply-chain transparency mandates (ESG, eIDAS 2.0, US FSLMDA)
- 4.2.3 Edge-computing investments coupled with Layer-2 roll-ups for low-latency consensus
- 4.2.4 Standardization of device identities via DID/Verifiable Credentials frameworks
- 4.2.5 Emergence of DePIN token-incentivized sensor networks
- 4.2.6 Digital-twin monetization through on-chain provenance tokens
- 4.3 Market Restraints
- 4.3.1 Limited on-device computing power for cryptographic workloads
- 4.3.2 Fragmented interoperability across blockchain protocols and IoT standards
- 4.3.3 Rising energy cost for Proof-of-Work/Proof-of-History edge nodes
- 4.3.4 Regulatory ambiguity surrounding tokenized machine data ownership
- 4.4 Industry Value Chain Analysis
- 4.5 Regulatory Landscape
- 4.6 Technological Outlook
- 4.7 Porter's Five Forces
- 4.7.1 Threat of New Entrants
- 4.7.2 Bargaining Power of Buyers
- 4.7.3 Bargaining Power of Suppliers
- 4.7.4 Threat of Substitute Products
- 4.7.5 Intensity of Competitive Rivalry
- 4.8 Assessment of Macroeconomic Factors on the Market
5 MARKET SIZE AND GROWTH FORECASTS (VALUE)
- 5.1 By Offering
- 5.1.1 Hardware
- 5.1.1.1 IoT Sensors and Actuators
- 5.1.1.2 Gateways and Edge Devices
- 5.1.1.3 Connectivity Modules
- 5.1.1.4 Blockchain Chipsets
- 5.1.2 Software
- 5.1.2.1 Middleware Platforms
- 5.1.2.2 Smart-Contract Management
- 5.1.2.3 Identity and Access Management
- 5.1.2.4 Analytics and Visualization
- 5.1.3 Infrastructure
- 5.1.3.1 Public Chains
- 5.1.3.2 Private/Consortium Chains
- 5.1.3.3 Cloud and Edge Services
- 5.1.1 Hardware
- 5.2 By Application
- 5.2.1 Data Security
- 5.2.2 Smart Contracts and Automation
- 5.2.3 Data Communication and Integrity
- 5.2.4 Asset Tracking and Management
- 5.2.5 Predictive Maintenance
- 5.2.6 Other Niche Applications
- 5.3 By End User
- 5.3.1 Manufacturing
- 5.3.2 Energy and Utilities
- 5.3.3 Transportation and Logistics
- 5.3.4 Building Management and Smart Facilities
- 5.3.5 Retail and eCommerce
- 5.3.6 Smart Cities and Government
- 5.3.7 Healthcare and Life Sciences
- 5.3.8 Agriculture
- 5.4 By Geography
- 5.4.1 North America
- 5.4.1.1 United States
- 5.4.1.2 Canada
- 5.4.1.3 Mexico
- 5.4.2 South America
- 5.4.2.1 Brazil
- 5.4.2.2 Argentina
- 5.4.2.3 Rest of South America
- 5.4.3 Europe
- 5.4.3.1 Germany
- 5.4.3.2 United Kingdom
- 5.4.3.3 France
- 5.4.3.4 Italy
- 5.4.3.5 Spain
- 5.4.3.6 Russia
- 5.4.3.7 Rest of Europe
- 5.4.4 Asia-Pacific
- 5.4.4.1 China
- 5.4.4.2 India
- 5.4.4.3 Japan
- 5.4.4.4 South Korea
- 5.4.4.5 Australia and New Zealand
- 5.4.4.6 Rest of Asia-Pacific
- 5.4.5 Middle East and Africa
- 5.4.5.1 Middle East
- 5.4.5.1.1 Saudi Arabia
- 5.4.5.1.2 United Arab Emirates
- 5.4.5.1.3 Turkey
- 5.4.5.1.4 Rest of Middle East
- 5.4.5.2 Africa
- 5.4.5.2.1 South Africa
- 5.4.5.2.2 Nigeria
- 5.4.5.2.3 Rest of Africa
- 5.4.5.1 Middle East
- 5.4.1 North America
6 COMPETITIVE LANDSCAPE
- 6.1 Market Concentration
- 6.2 Strategic Moves
- 6.3 Market Share Analysis
- 6.4 Company Profiles (includes Global level Overview, Market level overview, Core Segments, Financials as available, Strategic Information, Market Rank/Share for key companies, Products and Services, and Recent Developments)
- 6.4.1 IBM Corporation
- 6.4.2 Intel Corporation
- 6.4.3 Microsoft Corporation
- 6.4.4 Cisco Systems Inc.
- 6.4.5 Amazon Web Services Inc.
- 6.4.6 Robert Bosch GmbH
- 6.4.7 The Linux Foundation (Hyperledger)
- 6.4.8 KrypC Technologies Pvt. Ltd.
- 6.4.9 IoTeX Foundation
- 6.4.10 R3 LLC
- 6.4.11 IOTA Foundation
- 6.4.12 Waltonchain Technology Co. Ltd.
- 6.4.13 VeChain Foundation
- 6.4.14 Helium Systems Inc.
- 6.4.15 Filament LLC
- 6.4.16 Samsung SDS Co. Ltd.
- 6.4.17 Hitachi Ltd.
- 6.4.18 Huawei Technologies Co. Ltd.
- 6.4.19 Chainlink Labs
- 6.4.20 Oracle Corporation
- 6.4.21 Ericsson AB
- 6.4.22 Dragino Technology Co. Ltd.
7 MARKET OPPORTUNITIES AND FUTURE OUTLOOK
- 7.1 White-space and Unmet-Need Assessment


