


 |
市場調查報告書
商品編碼
2124031
建築隔熱材料:市場佔有率分析、產業趨勢與統計、成長預測(2026-2031)Building Insulation Materials - Market Share Analysis, Industry Trends & Statistics, Growth Forecasts (2026 - 2031) |
||||||

※ 本網頁內容可能與最新版本有所差異。詳細情況請與我們聯繫。
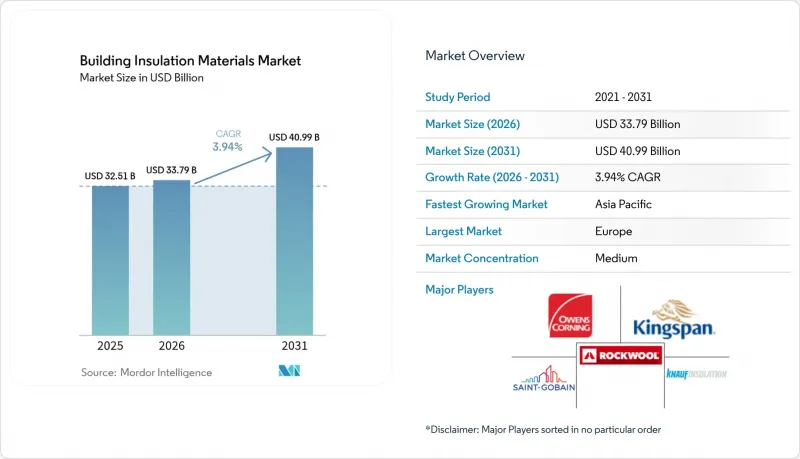
根據 Mordor Intelligence 預測,建築隔熱材料市場預計將從 2025 年的 325.1 億美元成長到 2026 年的 337.9 億美元,到 2031 年達到 409.9 億美元,2026 年至 2031 年的複合年成長率為 3.94%。
本報告按材料類型(玻璃纖維、礦棉、纖維素等)、應用領域(屋頂、牆面、地板、地下室等)、最終用戶(住宅、非住宅)、施工類型(新建、維修)和地區(亞太、北美、歐洲、南美、中東和非洲)進行細分。市場預測以美元計價。
全球建築隔熱材料市場趨勢及洞察
節能建築的需求日益成長
2024年,建築能耗佔全球最終能源消耗的30%,47個國家加強了建築圍護結構標準。加州2025年第24號法規將閣樓隔熱性能的最低標準提高到R-49,用吹入式纖維素隔熱材料取代了低效率的玻璃纖維。歐盟《建築能源性能指令》(EPBD)的修正案要求成員國每年維修公共建築3%的占地面積,到2030年將新增約2.4億平方公尺的外牆隔熱層。在日本,超過300平方公尺的非住宅建築現在必須進行第三方認證,這加速了消除熱橋效應的連續隔熱系統的普及。這些法規使得高R值產品不再只是高階附加選項,而是成為標準配置。
擴大北美綠色維修獎勵
美國《通貨膨脹控制法案》為隔熱材料提供高達每年1,200美元的30%稅額扣抵,而179D稅收抵免則為徹底的節能維修提供每平方英尺5美元的補貼。加拿大的「綠色家園補助金」計畫在2024年至2025年間,為每位住宅提供相當於3,700美元的津貼,以鼓勵對熱損失超過35%的閣樓和地下室維修。公共產業的補貼,例如太平洋煤氣電力公司(PG&E)提供的每平方英尺0.15美元的牆體隔熱獎勵,可以將投資回收期縮短至五年以內。這些財政措施正在改變人們對房屋隔熱的看法,使其從需要長期投資回報的購買行為轉變為能夠短期產生正現金流的維修,從而在新房建設週期到來之前提振了維修需求。
材料和建築成本上漲
在美國,噴塗聚氨酯泡棉的平均成本為每板英尺1.50至2美元,是玻璃纖維粗紗價格的兩倍,但其R值僅高出30%至40%。由於安裝人員短缺,預計2025年北美將出現15,000個保溫材料缺口,導致交貨週期延長至12週。歐洲能源價格上漲推高了玻璃纖維粗紗價格9%,而苯乙烯價格的波動則使發泡材的成本每立方公尺增加了80美元。這些經濟因素導致市場分化:一部分高階專案採用氣凝膠保溫材料,而另一部分經濟型客戶則推遲了維修。
細分市場分析
預計到2025年,玻璃纖維將佔據建築隔熱材料市場34.65%的佔有率。這反映了其安裝成本低且承包商對其較為熟悉。受連續保溫標準(建議使用剛性板材阻隔熱橋)的推動,聚苯乙烯基材料預計到2031年將以4.18%的複合年成長率成長。此外,隨著歐洲防火法規的日益嚴格,礦物棉在歐洲高層建築維修的使用量增加了11%。聚氨酯和聚異氰酸酯正逐漸轉向使用HFO發泡,而氣凝膠和真空板則在空間受限的維修項目中佔據了一席之地。
在高階氣凝膠建築隔熱材料材料市場,價格溢價高達40-50%。承包商通常使用玻璃纖維來建造符合最低建築規範要求的住宅牆體,使用聚苯乙烯來建造R值達到30或以上的商業外牆,並使用生物基發泡材進行綠色認證專案。礦物棉不可燃,無需使用昂貴的膨脹型阻燃塗料,並且在防火安全測試要求嚴格的場所具有成本優勢。
2025年,屋頂結構佔總需求的29.19%。同時,由於開放式維修對隔音隔熱材料的要求不斷提高,以及ASHRAE 90.1-2022標準對管道洩漏的限制更加嚴格,用於隔音隔間牆和暖通空調管道的建築保溫材料預計將以4.85%的複合年成長率成長。牆體隔熱材料的應用主要受歐盟外牆維修的推動,歐盟市場佔據了很大佔有率。在需要使用樓板下發泡材材料來建造防凍地基的地區,地板和地下室保溫材料預計將溫和成長。
對於天花板和閣樓應用,吹入式纖維素隔熱材料是首選,因為它可以降低30%的人事費用。 LEED新推出的「聲學性能」認證正在加速商業建築商採用桶裝和瓦片式礦棉保溫材料。隨著資料中心指定使用R-6等級的風管護套以降低風機能耗,以及冷冷屋頂結構推動了陡坡住宅中聚異氰脲酸酯保溫材料的使用,預計到2031年,暖通空調保溫材料市場規模將達到50億美元。
區域分析
隨著歐盟能源效率指令 (EPBD) 的修訂,所有成員國都力爭在 2030 年前實現零排放建築的目標,歐洲在 2025 年的銷售額佔全球的 36.91%。在德國,根據《氣候行動法案》(BEG),2024 年共進行了 42 萬個維修工程。在法國,從 2025 年起將禁止出租能源效率等級為 F 和 G 的房屋,將影響 480 萬戶住宅。在瑞典,U 值低於 0.15 W/m²K 已成為強制性要求,而這只有使用厚礦棉或真空吸音板才能實現。
亞太地區是成長最快的地區,複合年成長率達4.89%,主要得益於中國計劃到2025年使75%的都市區建築達到綠色標準。印度2024年《建築標準法》的修訂適用於面積超過100平方公尺的商業建築,將外牆的U值提高至0.40 W/m²K。在日本,從2025年起,新建的非住宅建築的能耗必須比標準低20%。在東協等新興市場,EDGE和綠建築標誌認證已在高檔工程中應用,但在住宅領域的應用率仍低於15%。
北美佔據了較大的市場佔有率,其成長並非由新建住宅推動,而是由稅收優惠的房屋維修驅動,因為不斷上漲的房屋抵押貸款利率已經減緩了住宅開工量。在加拿大,950萬套1980年以前建造的住宅可獲得高達29,600美元的免息貸款。在墨西哥,修訂後的NOM-020-ENER標準強制要求空調區域的建築圍護結構達到一定的隔熱性能。南美洲和中東及非洲(MEA)的市佔率總合不足10%,但偶爾會激增。沙烏地阿拉伯的建築規範現在強制要求所有政府項目使用R-13隔熱牆,而該國60%的牆體材料依賴進口。
其他好處:
- Excel格式的市場預測(ME)表
- 3個月的分析師支持
目錄
第1章:引言
- 研究假設和市場定義
- 調查範圍
第2章:調查方法
第3章執行摘要
第4章 市場狀況
- 市場概覽
- 市場促進因素
- 節能建築的需求日益成長
- 北美地區擴大環保型維修的獎勵
- 政府加強對使用環保和永續材料的支持力度
- 對低VOC生物基發泡材的需求日益成長
- 亞太地區的基礎建設和工業化進程
- 市場限制因素
- 原料和安裝成本上漲
- 價格合理的替代品
- 對發泡全球暖化潛能的監管
- 價值鏈分析
- 監理展望
- 波特五力模型
第5章 市場規模與成長預測
- 依材料類型
- 玻璃纖維
- 礦棉
- 纖維素
- 聚氨酯/聚異氰酸酯發泡體(PUR/PIR)
- 聚苯乙烯
- 其他材質(軟木、氣凝膠及真空絕熱板、噴塗泡沫、麻、矽酸鈣等)
- 透過使用
- 屋頂
- 牆體(外牆和中空牆)
- 地面層和地下室
- 天花板和閣樓
- 隔音隔間和空調管道
- 最終用戶
- 住宅
- 非住宅
- 商業
- 基礎設施
- 其他非住宅產業(教育、醫療保健、公共和宗教設施等)
- 依建築類型
- 新建工程
- 維修
- 按地區
- 亞太地區
- 中國
- 印度
- 日本
- 韓國
- 東南亞國協
- 其他亞太國家
- 北美洲
- 美國
- 加拿大
- 墨西哥
- 歐洲
- 德國
- 英國
- 法國
- 義大利
- 西班牙
- 北歐國家
- 其他歐洲國家
- 南美洲
- 巴西
- 阿根廷
- 其他南美國家
- 中東和非洲
- 沙烏地阿拉伯
- 南非
- 其他中東和非洲國家
- 亞太地區
第6章 競爭情勢
- 市場集中度
- 策略趨勢
- 市佔率和排名分析
- 公司簡介
- Armacell
- Aspen Aerogels Inc.
- Atlas Roofing Corporation
- BASF SE
- Beijing New Building Materials Public Limited Company
- Cellofoam North America Inc.
- Covestro AG
- Dow
- DuPont
- GAF Materials LLC
- Holcim
- Huntsman International LLC
- Johns Manville
- Kingspan Group
- Knauf Group
- Owens Corning
- Recticel NV/SA
- ROCKWOOL A/S
- Saint-Gobain
- Synthos
第7章 市場機會與未來展望
According to Mordor Intelligence, the building insulation materials market size is expected to increase from USD 32.51 billion in 2025 to USD 33.79 billion in 2026 and reach USD 40.99 billion by 2031, growing at a CAGR of 3.94% over 2026-2031.
This report is Segmented by Material Type (Fiberglass, Mineral Wool, Cellulose, and More), Application (Roof, Wall, Floor and Basement, and More), End-User (Residential, Non-Residential), Installation (New Construction, Renovation), and Geography (Asia-Pacific, North America, Europe, South America, Middle East and Africa). The Market Forecasts are Provided in Terms of Value (USD).
Global Building Insulation Materials Market Trends and Insights
Growing Demand for Energy-Efficient Buildings
Forty-seven countries strengthened envelope standards in 2024 as buildings consumed 30% of global final energy. California's Title 24-2025 increased attic minimums to R-49, displacing lower-value fiberglass in favor of blown-in cellulose. The EU EPBD recast obliges member states to upgrade 3% of public floor area each year, adding roughly 240 million m2 of facade insulation by 2030. Japan now requires third-party certification for non-residential structures above 300 m2, which is accelerating continuous-insulation systems that eliminate thermal bridges. These rules collectively position high-R-value products as default specifications rather than premium add-ons.
Increasing Green Retrofitting Incentives in North America
The U.S. Inflation Reduction Act offers a 30% tax credit on insulation materials up to USD 1,200 annually, while the 179D deduction pays USD 5 per square foot for deep-energy retrofits. Canada's Greener Homes Grant provided USD 3,700 equivalent per homeowner in 2024-2025 and drove attic and basement projects where heat loss surpasses 35%. Utility rebates such as Pacific Gas & Electric's USD 0.15 per square foot wall-cavity incentive shorten payback periods to under five years. These fiscal levers have shifted insulation from a long-term payback purchase to near-term cash-flow positive upgrades, lifting renovation demand ahead of the new-build cycle.
High Materials and Installation Cost
Spray polyurethane foam averages USD 1.50-2.00 per board foot installed in the United States, double fiberglass batts, while delivering only 30-40% higher R-value. Contractor shortages left North America 15,000 insulators short in 2025, pushing lead times to 12 weeks. Glass-fiber rovings rose 9% on Europe's energy spike, and styrene volatility added USD 80 per cubic meter to foam costs. These economics split the market into premium projects that adopt aerogels and value segments that postpone upgrades.
Other drivers and restraints analyzed in the detailed report include:
- Increasing Government Support for Eco-Friendly and Sustainable Materials
- Growing Preference for Low-VOC Bio-based Foams
- Availability of Affordable Alternatives
For complete list of drivers and restraints, kindly check the Table Of Contents.
Segment Analysis
Fiberglass held 34.65% of the building insulation materials market share in 2025, reflecting its low installed cost and contractor familiarity. Polystyrene materials are forecast to grow at a 4.18% CAGR through 2031 as continuous-insulation codes favor rigid boards that break thermal bridges. Mineral wool volume climbed 11% in European high-rise retrofits after tighter flame-spread rules. Polyurethane and polyisocyanurate foams are transitioning to HFO blowing agents, while aerogels and vacuum panels take niche share in space-constrained retrofits.
The building insulation materials market size for premium aerogel solutions commands 40-50% price premiums. Contractors default to fiberglass in code-minimum residential walls, reserve polystyrene for R-30+ commercial envelopes, and adopt bio-based foams for green-certified projects. Mineral wool's non-combustibility exempts it from costly intumescent coatings, giving it an embedded cost edge where fire testing is strict.
Roof assemblies captured 29.19% of the 2025 demand. However, acoustic partitions and HVAC duct wraps are projected to expand at a 4.85% CAGR as open-plan retrofits seek better sound privacy and ASHRAE 90.1-2022 tightens duct leakage limits. Wall insulation applications are mainly driven by EU facade upgrades, which account for a significant share. Floor and basement products grow modestly where frost-protected foundations need under-slab foam.
Ceiling and attic applications favor blown-in cellulose that trims labor costs by 30%. LEED's new Acoustic Performance credit is pivoting commercial builders toward mineral-wool batts and tiles. The building insulation materials market size for HVAC wraps is poised to reach USD 5 billion by 2031 as data centers specify R-6 duct jackets to cut fan energy, while cool-roof assemblies are pulling polyiso into steep-slope housing.
Complete Report Scope:
- By Material Type
- Fiberglass
- Mineral Wool
- Cellulose
- Polyurethane/Polyisocyanurate Foams (PUR/PIR)
- Polystyrene
- Other Materials (Cork, Aerogel and Vacuum Insulation Panels, Spray Foams, Hemp, Calcium-Silicate, etc.)
- By Application
- Roof
- Wall (External and Cavity)
- Floor and Basement
- Ceiling and Attic
- Acoustic Partition and HVAC Duct
- By End-User
- Residential
- Non-Residential
- Commercial
- Infrastructure
- Other Non-Residential Industries (Education, Healthcare, Civic and Religious,etc.)
- By Installation
- New Construction
- Renovation
- By Geography
- Asia-Pacific
- China
- India
- Japan
- South Korea
- ASEAN Countries
- Rest of Asia-Pacific
- North America
- United States
- Canada
- Mexico
- Europe
- Germany
- United Kingdom
- France
- Italy
- Spain
- Nordics Countries
- Rest of Europe
- South America
- Brazil
- Argentina
- Rest of South America
- Middle East and Africa
- Saudi Arabia
- South Africa
- Rest of Middle East and Africa
- Asia-Pacific
Geography Analysis
Europe held 36.91% of 2025 revenue as the EPBD recast steers every member state toward zero-emission buildings by 2030. Germany processed 420,000 retrofits in 2024 under BEG, and France's ban on F- and G-rated rentals from 2025 affects 4.8 million dwellings. Sweden now requires U-values below 0.15 W/m2K, achieved only with thick mineral wool or vacuum panels.
Asia-Pacific is the fastest-growing region at 4.89% CAGR, propelled by China's plan for 75% of urban buildings to meet green standards by 2025. India's 2024 code extension covers commercial buildings above 100 m2 and tightens wall U-values to 0.40 W/m2K. Japan requires new non-residential buildings to beat baseline energy use by 20% from 2025. Emerging ASEAN markets adopt EDGE and Green Mark in premium projects, though residential penetration remains below 15%.
North America commands a significant market share, with growth rooted in tax-driven retrofits rather than new homes, as mortgage rates dampen housing starts. Canada's interest-free loans up to USD 29,600 are targeting 9.5 million pre-1980 homes. Mexico's updated NOM-020-ENER introduces mandatory envelope resistance in air-conditioned zones. South America and MEA together contribute under 10% but show episodic surges; Saudi Arabia's code now mandates R-13 walls in all government projects, relying on 60% imports.
- Armacell
- Aspen Aerogels Inc.
- Atlas Roofing Corporation
- BASF SE
- Beijing New Building Materials Public Limited Company
- Cellofoam North America Inc.
- Covestro AG
- Dow
- DuPont
- GAF Materials LLC
- Holcim
- Huntsman International LLC
- Johns Manville
- Kingspan Group
- Knauf Group
- Owens Corning
- Recticel NV/SA
- ROCKWOOL A/S
- Saint-Gobain
- Synthos
Additional Benefits:
- The market estimate (ME) sheet in Excel format
- 3 months of analyst support
TABLE OF CONTENTS
1 Introduction
- 1.1 Study Assumptions and Market Definition
- 1.2 Scope of the Study
2 Research Methodology
3 Executive Summary
4 Market Landscape
- 4.1 Market Overview
- 4.2 Market Drivers
- 4.2.1 Growing Demand for Energy Efficient Buildings
- 4.2.2 Increasing Green Retrofitting Incentives in North America
- 4.2.3 Increasing Governemnt Support for the Usage of Eco-Friendly and Sustainable Materials
- 4.2.4 Growing Preference for Low-VOC Bio-based Foams
- 4.2.5 Rising Infrastructure and Industrialization in Asia-Pacific
- 4.3 Market Restraints
- 4.3.1 High Materials and Installation Cost
- 4.3.2 Availability of Affordable Alternatives
- 4.3.3 Regulatory Scrutiny on Global Warming Potential of Blowing Agents
- 4.4 Value Chain Analysis
- 4.5 Regulatory Outlook
- 4.6 Porter's Five Forces
- 4.6.1 Bargaining Power of Suppliers
- 4.6.2 Bargaining Power of Buyers
- 4.6.3 Threat of New Entrants
- 4.6.4 Threat of Substitutes
- 4.6.5 Degree of Competition
5 Market Size and Growth Forecasts (Value)
- 5.1 By Material Type
- 5.1.1 Fiberglass
- 5.1.2 Mineral Wool
- 5.1.3 Cellulose
- 5.1.4 Polyurethane/Polyisocyanurate Foams (PUR/PIR)
- 5.1.5 Polystyrene
- 5.1.6 Other Materials (Cork, Aerogel and Vacuum Insulation Panels, Spray Foams, Hemp, Calcium-Silicate, etc.)
- 5.2 By Application
- 5.2.1 Roof
- 5.2.2 Wall (External and Cavity)
- 5.2.3 Floor and Basement
- 5.2.4 Ceiling and Attic
- 5.2.5 Acoustic Partition and HVAC Duct
- 5.3 By End-User
- 5.3.1 Residential
- 5.3.2 Non-Residential
- 5.3.2.1 Commercial
- 5.3.2.2 Infrastructure
- 5.3.2.3 Other Non-Residential Industries (Education, Healthcare, Civic and Religious,etc.)
- 5.4 By Installation
- 5.4.1 New Construction
- 5.4.2 Renovation
- 5.5 By Geography
- 5.5.1 Asia-Pacific
- 5.5.1.1 China
- 5.5.1.2 India
- 5.5.1.3 Japan
- 5.5.1.4 South Korea
- 5.5.1.5 ASEAN Countries
- 5.5.1.6 Rest of Asia-Pacific
- 5.5.2 North America
- 5.5.2.1 United States
- 5.5.2.2 Canada
- 5.5.2.3 Mexico
- 5.5.3 Europe
- 5.5.3.1 Germany
- 5.5.3.2 United Kingdom
- 5.5.3.3 France
- 5.5.3.4 Italy
- 5.5.3.5 Spain
- 5.5.3.6 Nordics Countries
- 5.5.3.7 Rest of Europe
- 5.5.4 South America
- 5.5.4.1 Brazil
- 5.5.4.2 Argentina
- 5.5.4.3 Rest of South America
- 5.5.5 Middle East and Africa
- 5.5.5.1 Saudi Arabia
- 5.5.5.2 South Africa
- 5.5.5.3 Rest of Middle East and Africa
- 5.5.1 Asia-Pacific
6 Competitive Landscape
- 6.1 Market Concentration
- 6.2 Strategic Moves
- 6.3 Market Share (%)/Ranking Analysis
- 6.4 Company Profiles (includes Global Overview, Market Overview, Core Segments, Financials, Strategic Information, Products and Services, Recent Developments)
- 6.4.1 Armacell
- 6.4.2 Aspen Aerogels Inc.
- 6.4.3 Atlas Roofing Corporation
- 6.4.4 BASF SE
- 6.4.5 Beijing New Building Materials Public Limited Company
- 6.4.6 Cellofoam North America Inc.
- 6.4.7 Covestro AG
- 6.4.8 Dow
- 6.4.9 DuPont
- 6.4.10 GAF Materials LLC
- 6.4.11 Holcim
- 6.4.12 Huntsman International LLC
- 6.4.13 Johns Manville
- 6.4.14 Kingspan Group
- 6.4.15 Knauf Group
- 6.4.16 Owens Corning
- 6.4.17 Recticel NV/SA
- 6.4.18 ROCKWOOL A/S
- 6.4.19 Saint-Gobain
- 6.4.20 Synthos
7 Market Opportunities and Future Outlook
- 7.1 White-space and Unmet-Need Assessment

 懸空地板隔熱材料市場-2026年至2032年全球市場預測
 動態隔熱系統市場:按類型、應用、最終用途、國家和地區分類-全球產業分析、市場規模、市場佔有率及2026年至2033年預測
 動態隔熱系統市場規模、佔有率和趨勢分析報告:按系統類型、應用、最終用途、地區和細分市場預測(2026-2033 年)
 防火材料市場分析及預測(至2035年):依類型、產品、技術、應用、形式、材料類型、最終用戶及安裝方法分類建築隔熱材料市場-2026-2032年全球市場預測
 全球建築隔熱材料市場:依材料、建築類型、應用和地區分類-預測至2031年建築隔熱材料市場-2026-2032年全球市場預測防火材料市場-2026-2032年全球市場預測屋頂隔熱市場:2026-2032年全球市場預測(依材料、產品類型、屋頂類型、安裝方法、保溫材料類型和應用分類)建築隔熱材料市場規模、佔有率和趨勢分析報告:按產品、應用、最終用途、地區和細分市場分類(2026-2033 年)