


 |
市場調查報告書
商品編碼
2123991
物聯網保險:市場佔有率分析、產業趨勢與統計、成長預測(2026-2031)IoT Insurance - Market Share Analysis, Industry Trends & Statistics, Growth Forecasts (2026 - 2031) |
||||||

※ 本網頁內容可能與最新版本有所差異。詳細情況請與我們聯繫。
據 Mordor Intelligence 稱,物聯網保險市場在 2025 年的價值為 527.8 億美元,預計到 2031 年將達到 2475.8 億美元,而 2026 年為 682.7 億美元,預測期(2026-2031 年)的複合年成長率為 29.40%。
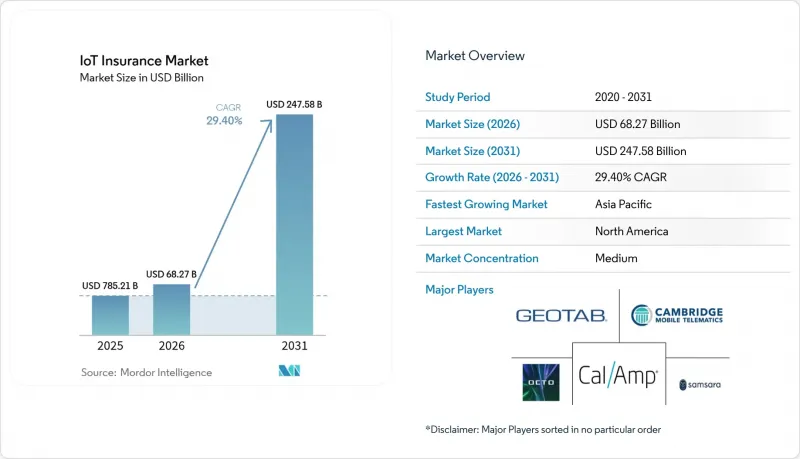
本報告按部署模式(雲端和本地部署)、保險類型(產物保險、人壽保險等)、物聯網技術類型(車載資訊系統、智慧家庭感測器、穿戴式裝置和醫療保健設備等)、終端用戶產業(零售和商業、住宅、汽車、工業等)以及地區進行細分。市場預測以美元計價。
全球物聯網保險市場趨勢與洞察
基於使用量的保險(UBI)的普及
遠端資訊處理驅動的基於使用量的保險 (UBI) 正在重新定義個人和商用車輛的保險費率,其關注點從靜態的人口統計因素轉移到即時駕駛行為。 Progressive Inc.累計,截至 2025 年 2 月,其淨保費收入為 66.84 億美元,年增 17%。這主要歸功於遠端資訊處理保險保單,目前該類保單占公司承保總額的 18%。車隊營運商也看到了類似的成果。一家豪華運輸服務供應商在實施 Samsara 的互聯營運套件後,保險成本降低了 15%。這凸顯了企業對精細化行為評分的強勁需求。人工智慧驅動的模式識別能夠提前預測高風險駕駛行為,從而透過預防性指導降低索賠頻率,最終降低保險公司的賠付率。
智慧家庭和工業感測器的介紹
水災、火災和設備故障是造成財產和工業損失的主要原因。低成本感測器能夠有效應對這些挑戰,在損失擴大之前向用戶和保險公司發出警報。 State Farm 已售出 200 萬個 Ting 電氣火災感測器,並在 70 萬個連網家庭中實現了相關保險索賠減少 80%。在商業領域,HSB 的 Relayr 分析套件透過預測性維護,有效地避免了業務中斷,使電梯維護合作夥伴的收入提高了 12%。保險公司提供 5% 至 20% 的保費折扣,以反映這些預防措施的益處,並鼓勵更廣泛地使用這些設備。
資料隱私與網路安全風險
2024年7月發生的一起全球IT系統故障影響了850萬個系統,造成100億至150億美元的經濟損失。這凸顯了互聯設備所帶來的系統性風險。蘇黎世保險將網路威脅列為電子產品製造商面臨的五大風險之一,並警告稱,韌體漏洞可能導致保險公司和被保險人遭受連鎖損失。未能遵守即將在歐洲實施的「網路彈性法」的供應商可能面臨高達1500萬歐元的罰款,這將成為該法推廣的障礙,但也會為那些提前建立安全架構的公司帶來競爭優勢。
細分市場分析
雲端環境佔物聯網保險市場63.20%的佔有率,並以30.70%的複合年成長率快速成長,預計到2031年,雲端平台物聯網保險市場規模將達到1,663.1億美元。彈性運算、開放API和託管安全修補程式使保險公司擺脫了維護資本密集型資料中心的負擔。 Samsara的互聯營運雲預計將在2025年第四季產生14.58億美元的年度經常性收入(ARR),這表明可擴展的遙測架構正在推動企業採用該技術。
在嚴格監管的司法管轄區和資料主權法規禁止境外處理的地區,本地部署仍然普遍存在。然而,FedRAMP High 和 ISO 27018 等安全認證正在降低人們對多租戶雲端的擔憂,加速從本地伺服器逐步遷移到雲端。邊緣節點正日益融入雲端架構,確保自動駕駛汽車保險的超低延遲,同時中央分析系統最佳化定價演算法。隨著混合模式的成熟,保險公司在不影響集中式精算監管的前提下,獲得了更大的情境柔軟性。
至2025年,產物保險業將佔總收入的47.80%,並擁有物聯網保險市場規模最大的產品類別。隨著智慧家庭和工業感測器能夠實際有效地避免損失,財產及產物保險自然成為首批應用領域。同時,人壽保險核保業正以33.20%的複合年成長率成長,利用持續的穿戴式裝置數據來最佳化死亡率假設,並透過動態保費設定來促進健康行為。
在企業保險領域,工業IoT正日益融入勞工保險,預測性維護正在降低工傷事故的發生頻率。從被動調整轉向主動分析,對尋求降低綜合比率和獲取可驗證投資組合遙測數據的再保險公司來說極具吸引力。從長遠來看,跨保險商品搭售,例如將人壽保險、汽車保險和住宅保險圍繞單一感測器套件進行整合,將模糊傳統的保險產品界限,並使以數據為中心的平台獲得競爭優勢。
區域分析
預計到2025年,北美將佔據37.20%的市場佔有率,這主要歸功於完善的車載資訊服務法規和消費者的廣泛接受。 State Farm大規模部署Ting感測器,以及Progressive有效合約數量成長18%,都顯示市場正朝著基於感測器的價值提案方向發展。加拿大監管機構正在調整AIDA和CPPA隱私法,以平衡創新與消費者權益,從而促進設備緩慢但穩定地普及。
在歐洲,設備安全和資料共用正透過歐盟資料法和即將訂定的《網路韌性法案》在所有27個成員國中逐步標準化並持續發展。據歐洲保險和職業退休金管理局(EIOPA)稱,已有17%的保險公司提供物聯網汽車保險,隨著合規框架的完善和消費者信心的增強,預計物聯網汽車保險的普及率將進一步提高。德國、法國和英國在物聯網應用方面處於主導,而歐盟新成員國則受益於凝聚基金,該基金用於擴大大規模物聯網部署所需的寬頻覆蓋範圍。
在亞太地區,人工智慧正以33.00%的複合年成長率成長,這主要得益於印度將外國直接投資(FDI)上限提高至100%,吸引了許多跨國公司的投資;以及中國訂定的《國家金融監管法》(NFRA),該法為人工智慧和數據管治制定了規則。預計澳洲和紐西蘭的車載資訊服務終端數量將從2023年的160萬台增至2028年的270萬台,鞏固在該地區汽車產業的領先地位。在日本,三井住友保險等保險公司正在分階段進行生成式人工智慧的試點測試,以完善其嚴謹的風險管理體系,從而避免業務轉型過於激進。
拉丁美洲、中東和非洲仍在發展中,但其未來潛力巨大。墨西哥5G覆蓋範圍的改善以及巴西開放的保險體係有望縮短部署週期。波灣合作理事會(GCC)成員國正在投資建設大型智慧大型企劃,而這些項目中整合的感測器網路與基礎設施、房地產和網路保險領域的商業物聯網覆蓋範圍自然契合。
其他好處:
- Excel格式的市場預測(ME)表
- 3個月的分析師支持
目錄
第1章:引言
- 研究假設和市場定義
- 調查範圍
第2章:調查方法
第3章執行摘要
第4章 市場狀況
- 市場概覽
- 市場促進因素
- 按里程計費保險(UBI)的普及
- 智慧家庭和工業感測器的介紹
- 物聯網硬體和資料通訊成本快速下降
- 監管機構致力於推動數據驅動的保費設定
- 參數化與觸發式防護與控制產品的出現
- 再保險公司對其投資組合的持續遙測需求
- 市場限制因素
- 資料隱私與網路安全風險
- 傳統核心整合的複雜性
- 感測器數據可靠性和校準漂移
- 對汽車製造商和保險公司之間數據交換的反壟斷審查
- 產業價值鏈分析
- 監理情勢
- 技術展望
- 產業吸引力—五力分析
- 供應商的議價能力
- 買方的議價能力
- 新進入者的威脅
- 替代品的威脅
- 競爭公司之間的競爭
- 宏觀經濟因素對市場的影響
第5章 市場規模與成長預測
- 按部署模式
- 雲
- 現場
- 按保險類型
- 產物保險
- 人壽保險
- 衛生保健
- 企業保險
- 按物聯網技術類型分類
- 汽車遠端資訊處理
- 智慧家庭感應器
- 穿戴式裝置和健康管理設備
- 工業IoT閘道器
- 環境和參數感測器
- 按最終用戶行業分類
- 零售和商業
- 智慧住宅
- 車
- 產業
- 衛生保健
- 公共基礎設施
- 物流和導航
- 其他終端用戶產業
- 按地區
- 北美洲
- 美國
- 加拿大
- 墨西哥
- 南美洲
- 巴西
- 阿根廷
- 智利
- 其他南美國家
- 歐洲
- 德國
- 英國
- 法國
- 義大利
- 西班牙
- 俄羅斯
- 其他歐洲國家
- 亞太地區
- 中國
- 印度
- 日本
- 韓國
- 新加坡
- 馬來西亞
- 澳洲
- 其他亞太國家
- 中東和非洲
- 中東
- 阿拉伯聯合大公國
- 沙烏地阿拉伯
- 土耳其
- 其他中東國家
- 非洲
- 南非
- 奈及利亞
- 埃及
- 其他非洲國家
- 中東
- 北美洲
第6章 競爭情勢
- 市場集中度
- 策略趨勢
- 市佔率分析
- 公司簡介
- Octo Telematics SpA
- Cambridge Mobile Telematics, Inc.
- Geotab Inc.
- CalAmp Corp.
- Samsara Inc.
- Trak Global Group Ltd
- Zubie, Inc.
- Mojio Inc.
- Queclink Wireless Solutions Co. Ltd
- Telit Cinterion PLC
- Sensata Technologies Holding plc
- Laird Connectivity LLC
- Kuantum Pvt Ltd(Kruzr)
- Smart Things Lab Co. Ltd
- Roost Inc.
- Notion(fka Iris Inc.)
- Eddy Solutions Inc.
- HSB("Sensor Solutions by HSB")
- ThingCo Global Ltd
- LexisNexis Risk Solutions Group
- Flow Insurance Ltd
- Kinsa Inc.
- Metromile Enterprise Solutions
- Safehub, Inc.
- Parsyl, Inc.
第7章 市場機會與未來趨勢
- 評估閒置頻段和未滿足的需求
According to Mordor Intelligence, the IoT insurance market size was valued at USD 52.78 billion in 2025 and estimated to grow from USD 68.27 billion in 2026 to reach USD 247.58 billion by 2031, at a CAGR of 29.40% during the forecast period (2026-2031).
This report is Segmented by Deployment Model (Cloud and On-Premise), Insurance Line (Property and Casualty, Life, and More), Iot Technology Type (Vehicle Telematics, Smart-Home Sensors, Wearables and Health Devices, and More), End-User Industry (Retail and Commercial, Residential, Automotive, Industrial, and More), and Geography. The Market Forecasts are Provided in Terms of Value (USD).
Global IoT Insurance Market Trends and Insights
Proliferation of Usage-Based Insurance (UBI)
Telematics-enabled UBI is redefining personal and commercial auto premiums as real-time driver behavior replaces static demographic factors. Progressive wrote USD 6.684 billion in net premiums during February 2025, a 17% year-over-year rise driven chiefly by telematics policies that now represent 18% of its book. Fleet operators replicate those gains; a luxury transport provider cut insurance spend by 15% after implementing Samsara's connected-operations suite, confirming enterprise appetite for granular behavioral scoring. AI-driven pattern recognition further predicts collision-prone maneuvers, enabling proactive coaching that lowers claims frequency and ultimately reduces loss ratios for carriers.
Adoption of Smart-Home and Industrial Sensors
Water escape, fire, and equipment failure account for a majority of property and industrial losses; low-cost sensors address these pain points by alerting users and insurers before damage escalates. State Farm has shipped 2 million Ting electrical-fire sensors, reporting an 80% reduction in related claims across 700,000 connected homes. In commercial settings, HSB's Relayr analytics suite lifts revenue for elevator maintenance partners by 12% through predictive servicing that prevents business interruption. Insurers match these preventive gains with premium discounts ranging from 5% to 20% to encourage wider device adoption.
Data-Privacy and Cybersecurity Exposure
A global IT outage in July 2024 struck 8.5 million systems and inflicted USD 10-15 billion in economic loss, underscoring the systemic risk of interconnected devices. Zurich lists cyber threats among the top five risks facing electronics manufacturers, warning that compromised firmware can trigger cascading losses for both carriers and insureds. Compliance with Europe's forthcoming Cyber Resilience Act can cost non-conforming vendors up to EUR 15 million in penalties, creating adoption friction yet offering a competitive moat for firms that build secure architectures upfront.
Other drivers and restraints analyzed in the detailed report include:
- Rapid Fall in IoT Hardware and Connectivity Costs
- Regulatory Push for Data-Driven Pricing
- Legacy-Core Integration Complexity
For complete list of drivers and restraints, kindly check the Table Of Contents.
Segment Analysis
Cloud environments control 63.20% of the IoT insurance market and will expand at a 30.70% CAGR, lifting the IoT insurance market size for cloud platforms to USD 166.31 billion by 2031. Elastic compute, API openness, and managed security patches free carriers from maintaining capital-intensive data centers. Samsara's connected-operations cloud reached USD 1.458 billion in ARR in Q4 2025, illustrating how scalable telemetry architectures translate into enterprise adoption.
On-premise deployments persist in heavily regulated jurisdictions or where data sovereignty statutes prohibit offshore processing. Even so, security certifications such as FedRAMP High and ISO 27018 have reduced the perceived risk of multi-tenant clouds, prompting phased migration away from local servers. Edge nodes are increasingly integrated into cloud stacks, ensuring ultra-low latency for autonomous vehicle coverage while central analytics refine pricing algorithms. As hybrid models mature, carriers gain situational flexibility without compromising centralized actuarial oversight.
Property and Casualty lines hold 47.80% of 2025 revenue, representing the largest IoT insurance market size by product class. Smart-home and industrial sensors deliver tangible loss-avoidance, making P&C a natural first adopter. However, life underwriters are growing at 33.20% CAGR; they leverage continuous wearable data to refine mortality assumptions and incentivize healthy behavior through dynamic premiums.
Commercial lines increasingly embed industrial IoT into workers' compensation, where predictive maintenance lowers injury frequency. The shift from retrospective claims adjustment to preventive analytics compresses combined ratios and appeals to reinsurers seeking demonstrable portfolio telemetry. Longer term, cross-line bundling-such as combining life, auto, and home policies around a single sensor suite-will blur historic product boundaries and reward data-centric platforms.
Complete Report Scope:
- By Deployment Model
- Cloud
- On-Premise
- By Insurance Line
- Property and Casualty
- Life
- Health
- Commercial Lines
- By IoT Technology Type
- Vehicle Telematics
- Smart-Home Sensors
- Wearables and Health Devices
- Industrial IoT Gateways
- Environmental and Parametric Sensors
- By End-user Industry
- Retail and Commercial
- Residential (Smart-homes)
- Automotive
- Industrial
- Healthcare
- Public Infrastructure
- Logistics and Navigation
- Other End-user Industries
- By Geography
- North America
- United States
- Canada
- Mexico
- South America
- Brazil
- Argentina
- Chile
- Rest of South America
- Europe
- Germany
- United Kingdom
- France
- Italy
- Spain
- Russia
- Rest of Europe
- Asia-Pacific
- China
- India
- Japan
- South Korea
- Singapore
- Malaysia
- Australia
- Rest of Asia-Pacific
- Middle East and Africa
- Middle East
- United Arab Emirates
- Saudi Arabia
- Turkey
- Rest of Middle East
- Africa
- South Africa
- Nigeria
- Egypt
- Rest of Africa
- Middle East
- North America
Geography Analysis
North America's 37.20% revenue share in 2025 derives from well-established telematics regulations and widespread consumer acceptance. State Farm's mass deployment of Ting sensors and Progressive's 18% policy-in-force growth illustrate a broad shift toward sensor-mediated value propositions. Canadian regulators are tailoring AIDA and CPPA privacy laws to balance innovation with consumer sovereignty, fostering gradual yet steady device uptake.
Europe experiences cohesive growth through the EU Data Act and forthcoming Cyber Resilience Act, which standardize device security and data sharing across 27 member states. EIOPA notes that 17% of carriers already offer motor insurance linked to IoT and expects penetration to climb as compliance frameworks build consumer confidence. Germany, France, and the United Kingdom spearhead adoption, while newer EU members benefit from cohesion funds that expand broadband coverage required for massive IoT roll-outs.
Asia-Pacific records a 33.00% CAGR, driven by India's FDI ceiling lift to 100% that invites multinational capital, and China's NFRA guidelines that delineate AI and data-governance rules. Australian and New Zealand fleets will rise from 1.6 million telematics units in 2023 to 2.7 million by 2028, cementing regional auto dominance. Japan pursues incremental generative-AI pilots within insurers like Mitsui Sumitomo to complement meticulous risk cultures, thereby avoiding abrupt operational shifts.
Latin America and the Middle East and Africa remain nascent yet promising. Mexico's improving 5G coverage and Brazil's open-insurance regime are expected to shorten the adoption lag. Gulf Cooperation Council countries invest in smart-city megaprojects where embedded sensor grids naturally dovetail with commercial IoT coverage for infrastructure, property, and cyber lines.
- Octo Telematics S.p.A.
- Cambridge Mobile Telematics, Inc.
- Geotab Inc.
- CalAmp Corp.
- Samsara Inc.
- Trak Global Group Ltd
- Zubie, Inc.
- Mojio Inc.
- Queclink Wireless Solutions Co. Ltd
- Telit Cinterion PLC
- Sensata Technologies Holding plc
- Laird Connectivity LLC
- Kuantum Pvt Ltd (Kruzr)
- Smart Things Lab Co. Ltd
- Roost Inc.
- Notion (fka Iris Inc.)
- Eddy Solutions Inc.
- HSB ("Sensor Solutions by HSB")
- ThingCo Global Ltd
- LexisNexis Risk Solutions Group
- Flow Insurance Ltd
- Kinsa Inc.
- Metromile Enterprise Solutions
- Safehub, Inc.
- Parsyl, Inc.
Additional Benefits:
- The market estimate (ME) sheet in Excel format
- 3 months of analyst support
TABLE OF CONTENTS
1 INTRODUCTION
- 1.1 Study Assumptions and Market Definition
- 1.2 Scope of the Study
2 RESEARCH METHODOLOGY
3 EXECUTIVE SUMMARY
4 MARKET LANDSCAPE
- 4.1 Market Overview
- 4.2 Market Drivers
- 4.2.1 Proliferation of usage-based insurance (UBI)
- 4.2.2 Adoption of smart-home and industrial sensors
- 4.2.3 Rapid fall in IoT hardware and data-connectivity costs
- 4.2.4 Regulatory push for data-driven premium pricing
- 4.2.5 Emergence of parametric, trigger-based P and C products
- 4.2.6 Reinsurers' demand for continuous portfolio telemetry
- 4.3 Market Restraints
- 4.3.1 Data-privacy and cybersecurity exposure
- 4.3.2 Legacy-core integration complexity
- 4.3.3 Sensor-data reliability and calibration drift
- 4.3.4 Antitrust scrutiny on OEM-insurer data exchange
- 4.4 Industry Value Chain Analysis
- 4.5 Regulatory Landscape
- 4.6 Technological Outlook
- 4.7 Industry Attractiveness - Porter's Five Forces Analysis
- 4.7.1 Bargaining Power of Suppliers
- 4.7.2 Bargaining Power of Buyers
- 4.7.3 Threat of New Entrants
- 4.7.4 Threat of Substitutes
- 4.7.5 Intensity of Competitive Rivalry
- 4.8 Impact of Macroeconomic Factors on the Market
5 MARKET SIZE AND GROWTH FORECASTS (VALUES)
- 5.1 By Deployment Model
- 5.1.1 Cloud
- 5.1.2 On-Premise
- 5.2 By Insurance Line
- 5.2.1 Property and Casualty
- 5.2.2 Life
- 5.2.3 Health
- 5.2.4 Commercial Lines
- 5.3 By IoT Technology Type
- 5.3.1 Vehicle Telematics
- 5.3.2 Smart-Home Sensors
- 5.3.3 Wearables and Health Devices
- 5.3.4 Industrial IoT Gateways
- 5.3.5 Environmental and Parametric Sensors
- 5.4 By End-user Industry
- 5.4.1 Retail and Commercial
- 5.4.2 Residential (Smart-homes)
- 5.4.3 Automotive
- 5.4.4 Industrial
- 5.4.5 Healthcare
- 5.4.6 Public Infrastructure
- 5.4.7 Logistics and Navigation
- 5.4.8 Other End-user Industries
- 5.5 By Geography
- 5.5.1 North America
- 5.5.1.1 United States
- 5.5.1.2 Canada
- 5.5.1.3 Mexico
- 5.5.2 South America
- 5.5.2.1 Brazil
- 5.5.2.2 Argentina
- 5.5.2.3 Chile
- 5.5.2.4 Rest of South America
- 5.5.3 Europe
- 5.5.3.1 Germany
- 5.5.3.2 United Kingdom
- 5.5.3.3 France
- 5.5.3.4 Italy
- 5.5.3.5 Spain
- 5.5.3.6 Russia
- 5.5.3.7 Rest of Europe
- 5.5.4 Asia-Pacific
- 5.5.4.1 China
- 5.5.4.2 India
- 5.5.4.3 Japan
- 5.5.4.4 South Korea
- 5.5.4.5 Singapore
- 5.5.4.6 Malaysia
- 5.5.4.7 Australia
- 5.5.4.8 Rest of Asia-Pacific
- 5.5.5 Middle East and Africa
- 5.5.5.1 Middle East
- 5.5.5.1.1 United Arab Emirates
- 5.5.5.1.2 Saudi Arabia
- 5.5.5.1.3 Turkey
- 5.5.5.1.4 Rest of Middle East
- 5.5.5.2 Africa
- 5.5.5.2.1 South Africa
- 5.5.5.2.2 Nigeria
- 5.5.5.2.3 Egypt
- 5.5.5.2.4 Rest of Africa
- 5.5.5.1 Middle East
- 5.5.1 North America
6 COMPETITIVE LANDSCAPE
- 6.1 Market Concentration
- 6.2 Strategic Moves
- 6.3 Market Share Analysis
- 6.4 Company Profiles (includes Global level Overview, Market level overview, Core Segments, Financials as available, Strategic Information, Market Rank/Share for key companies, Products and Services, and Recent Developments)
- 6.4.1 Octo Telematics S.p.A.
- 6.4.2 Cambridge Mobile Telematics, Inc.
- 6.4.3 Geotab Inc.
- 6.4.4 CalAmp Corp.
- 6.4.5 Samsara Inc.
- 6.4.6 Trak Global Group Ltd
- 6.4.7 Zubie, Inc.
- 6.4.8 Mojio Inc.
- 6.4.9 Queclink Wireless Solutions Co. Ltd
- 6.4.10 Telit Cinterion PLC
- 6.4.11 Sensata Technologies Holding plc
- 6.4.12 Laird Connectivity LLC
- 6.4.13 Kuantum Pvt Ltd (Kruzr)
- 6.4.14 Smart Things Lab Co. Ltd
- 6.4.15 Roost Inc.
- 6.4.16 Notion (fka Iris Inc.)
- 6.4.17 Eddy Solutions Inc.
- 6.4.18 HSB ("Sensor Solutions by HSB")
- 6.4.19 ThingCo Global Ltd
- 6.4.20 LexisNexis Risk Solutions Group
- 6.4.21 Flow Insurance Ltd
- 6.4.22 Kinsa Inc.
- 6.4.23 Metromile Enterprise Solutions
- 6.4.24 Safehub, Inc.
- 6.4.25 Parsyl, Inc.
7 MARKET OPPORTUNITIES AND FUTURE TRENDS
- 7.1 White-Space and Unmet-Need Assessment

 災害保險追蹤市場規模、佔有率和成長分析:按產品、部署模式、應用、最終用戶、公司規模、財產類型和地區分類——2026-2033年行業預測
 2026年全球災害保險追蹤市場報告
 物聯網保險市場規模、佔有率、趨勢和預測:按保險類型、組件、應用和地區分類,2026-2034 年
 物聯網市場追蹤調查:保險2026年物聯網保險全球市場報告日本物聯網保險市場報告(按類型(財產和意外保險、健康保險、人壽保險及其他)、應用和地區分類,2026-2034年)
 物聯網保險市場規模、佔有率和成長分析(按類型、最終用戶、組件和地區分類)-2026-2033年產業預測
 全球物聯網保險市場