


 |
市場調查報告書
商品編碼
2123796
超薄玻璃:市場佔有率分析、行業趨勢和統計數據以及成長預測(2026-2031 年)Ultra-Thin Glass - Market Share Analysis, Industry Trends & Statistics, Growth Forecasts (2026 - 2031) |
||||||

※ 本網頁內容可能與最新版本有所差異。詳細情況請與我們聯繫。
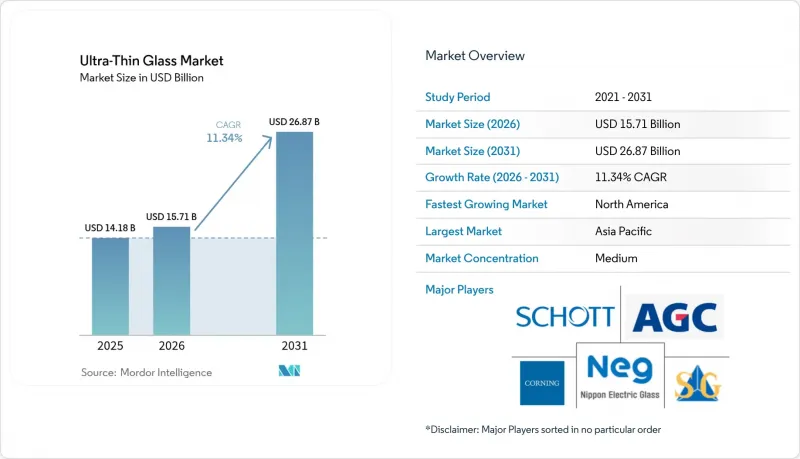
根據 Mordor Intelligence 預測,超薄玻璃市場規模預計將在 2025 年達到 141.8 億美元,2026 年達到 157.1 億美元,到 2031 年達到 268.7 億美元,2026 年至 2031 年的複合年成長率為 11.34%。
本報告按玻璃類型(鋁矽酸鹽、硼矽酸、鈉鈣玻璃及其他)、製造流程(熔融拉絲、下拉、浮法、卷對卷)、應用領域(半導體基板、觸控面板、感測器、汽車及其他)、最終用戶(消費性電子、汽車及其他)和地區(亞太地區及其他)進行細分。市場預測以美元計價。
全球超薄玻璃市場趨勢及洞察
家用電子電器需求增加
到2025年,家用電子電器將佔據市場的大部分佔有率,並實現兩位數的成長,這主要得益於屏下感測器和全面屏觸控模組的強勁升級週期。三星Galaxy S25 Ultra採用康寧新一代大猩猩裝甲2代,顯著降低了表面反射率。這項創新促使其他OEM廠商也開始採用類似的0.4毫米基板。隨後,筆記型電腦廠商也開始採用超薄玻璃面板,摒棄了先前使用的易泛黃的聚醯亞胺薄膜。然而,該領域的趨勢正在發生變化,用於人工智慧加速器的半導體基板開始佔據市場佔有率。這些先進的封裝應用不僅平均售價更高,而且還採用無鹼化學成分。這確保了112 Gbps SerDes通道的安全,並悄悄將收入重心轉移到這些對性能要求極高的等級產品上。
折疊式智慧型手機和筆記型電腦的快速普及
折疊式外形規格的出現徹底改變了超薄玻璃的經濟格局。三星顯示器正在部署第8.6代OLED生產線,並計畫為預計2026年發布的蘋果折疊式iPhone提供無摺痕面板。為了降低風險,中國面板製造商正在合作開發微浮法鈉鈣玻璃蓋板。這些創新蓋板具有卓越的耐用性和顯著的成本優勢。同時,康寧公司簽署了一項授權協議,授權其硼矽酸生產線在面向大眾市場的折疊式設備領域,其價格與可靠性之間的平衡已接近「最佳水準」。
由於採用高純度原料及精密加工工藝,成本較高。
由於含鐵量低於50ppm的電子級二氧化矽、高純度氧化鋁粉末以及鉑銠熔爐的價格飆升,成本不斷上漲。 2025年,二氧化矽現貨價格大幅上漲,影響了利潤率,尤其是對於沒有避險合約的浮法生產線而言。高溫運作爐需要定期更換坩堝堝。此外,與鈉鈣玻璃相比,離子交換和雷射圖形化技術需要價格更高的鋁矽酸鹽玻璃蓋板。天然氣價格飆升給歐洲製造商帶來了越來越大的壓力。雖然肖特公司對其位於美因茨的電熔設備維修緩解了部分壓力,但仍無法完全阻止能源價格的波動。
細分市場分析
預計到2025年,鈉鈣超薄產品將佔銷售額的46.09%,並有望以12.10%的複合年成長率成長,這主要得益於微浮法生產線的高良率和小於100微米的厚度。鋁矽酸鹽玻璃是折疊式設備覆蓋材料的主要材料,其超過800兆帕的表面抗壓強度保證了其能夠承受20萬次折疊式而不開裂。硼矽酸玻璃和無鹼玻璃是支撐半導體基板的基礎材料,能夠保護高速互連,其膨脹率低於3.5ppm/ 度C。鋰鋁鋁矽酸鹽玻璃由於其近乎零膨脹率,仍然是抬頭顯示器(HUD)光學元件領域的小眾產品。在ISO 12543-4耐久性測試中,硼矽酸玻璃在汽車層壓板領域表現出色,儘管成本較高,但高階OEM廠商正擴大將其應用於高階車型。因此,儘管中國浮法玻璃製造商正大幅擴大其用於中端電子產品的鈉鈣玻璃產量,但擁有眾多專利的現有企業仍在利潤豐厚的鋁矽酸鹽玻璃和硼矽酸玻璃領域保持領先地位。
到2025年,使用浮法和微浮法生產的玻璃將佔總產量的50.68%,隨著產能的擴大,預計到2031年,其複合年成長率將達到12.89%。微浮法生產線的成本遠低於熔融拉絲法,在運轉率更短。然而,對於某些對缺陷零容忍的應用,例如玻璃中介層和折疊式蓋板,仍然依賴熔融和下拉法。這種趨勢源自於這些方法中熔融玻璃不會與耐火材料表面接觸。例如,肖特公司的下拉硼硼矽酸玻璃厚度可達20 μm,表面粗糙度小於0.5 nm。而錫浴浮法無法達到這種性能,因為熔融玻璃會與表面接觸,導致表面不規則,粗糙度約為2 nm。同時,分切拉伸和捲對卷製程正在滿足快速成長的軟性電子產品市場的需求。特別是,康寧Willow公司是曲面OLED照明領域的先驅,而弗勞恩霍夫研究所則為太陽能模組提供捲筒塗層。因此,製程選擇已演變為在可接受的雜質水準和資本投資之間取得平衡,供應鏈也變得日益分散。
區域分析
預計到2025年,亞太地區將佔全球銷售額的49.59%,這主要得益於韓國OLED領域的投資以及中國浮法製程設備的維修,從而增強了規模經濟效益。北美地區預計到2031年將以11.91%的複合年成長率成長,這主要受《晶片法案》(CHIPS Act)推動的晶圓廠建設以及汽車強制輕量化政策的限制。各大公司正在推動對先進封裝技術的需求,而AGC位於墨西哥特拉斯卡拉的工廠則為美國原始設備製造商(OEM)供應產品。歐洲市場佔據著相當大的佔有率,其發展受到汽車玻璃需求和嚴格的生態設計法規的影響。肖特公司對電熔設備的維修有助於減少二氧化碳排放,並降低能源價格波動帶來的風險。同時,寶馬等汽車製造商正在採用超薄車頂,以實現其為 2027 年設定的車隊目標。雖然南美洲和中東及非洲 (MEA) 地區仍在發展中,但預計它們將受益於太陽能發電計劃,特別是對 100μm硼矽酸玻璃蓋板的需求,這將是 2028 年以後的重點。
其他好處:
- Excel格式的市場預測(ME)表
- 3個月的分析師支持
目錄
第1章:引言
- 研究假設和市場定義
- 調查範圍
第2章:調查方法
第3章執行摘要
第4章 市場狀況
- 市場概覽
- 市場促進因素
- 家用電器需求不斷成長
- 折疊式智慧型手機和筆記型電腦的快速普及
- 軟性OLED和MicroLED顯示器生產線的進步
- 汽車玻璃和抬頭顯示器(HUD)的減重需求
- 用於小晶片封裝的玻璃中介層
- 市場限制因素
- 高純度原料和精密加工帶來的高成本。
- 大面積處理過程中出現脆化和產量下降。
- 粒徑大於 0.3 毫米的玻璃廢棄物的回收途徑有限。
- 價值鏈分析
- 波特五力模型
第5章 市場規模與成長預測
- 玻璃類型
- 鋁矽酸鹽(例如,Gorilla、Dragontrail)
- 硼矽酸/無鹼
- 鈉鈣超薄片
- 其他(例如鋁鋁矽酸鹽)
- 透過製造程序
- 融合繪圖
- 下抽/溢流
- 浮子和微型浮子
- 開槽拉絲/卷對卷
- 透過使用
- 半導體基板
- 觸控面板顯示幕
- 指紋感應器
- 汽車玻璃
- 其他應用(汽車顯示器和玻璃等)
- 按最終用戶行業分類
- 家用電子產品
- 車
- 生物技術
- 其他終端用戶產業(能源、電力等)
- 按地區
- 亞太地區
- 中國
- 印度
- 日本
- 韓國
- 其他亞太國家
- 北美洲
- 美國
- 加拿大
- 墨西哥
- 歐洲
- 德國
- 英國
- 法國
- 義大利
- 其他歐洲國家
- 南美洲
- 巴西
- 阿根廷
- 其他南美國家
- 中東和非洲
- 沙烏地阿拉伯
- 南非
- 其他中東和非洲國家
- 亞太地區
第6章 競爭情勢
- 市場集中度
- 策略趨勢
- 市佔率和排名分析
- 公司簡介
- AGC Inc.
- Central Glass Co., Ltd.
- Changzhou Almaden Co., Ltd.
- Corning Incorporated
- CSG Holding Co., Ltd.
- Emerge Glass
- Fraunhofer
- Irico Group New Energy Company Limited
- Nippon Electric Glass Co., Ltd.
- Nippon Sheet Glass Co., Ltd.
- Nitto Denko Corporation.
- OFILM
- Samsung
- SCHOTT AG
- Taiwan Glass Ind. Corp.
- Tunghsu Optoelectronic Technology
- Xinyi Glass Holdings Limited.
第7章 市場機會與未來展望
According to Mordor Intelligence, the ultra-Thin glass market size is projected to be USD 14.18 billion in 2025, USD 15.71 billion in 2026, and reach USD 26.87 billion by 2031, growing at a CAGR of 11.34% from 2026 to 2031.
This report is Segmented by Glass Type (Aluminosilicate, Borosilicate, Soda-Lime, and Others), Manufacturing Process (Fusion Draw, Down-Draw, Float, and Roll-To-Roll), Application (Semiconductor Substrate, Touch Panels, Sensors, Automotive, and Others), End-User (Consumer Electronics, Automotive, and More), and Geography (Asia-Pacific, and More). The Market Forecasts are Provided in Terms of Value (USD).
Global Ultra-Thin Glass Market Trends and Insights
Growing Demand from Consumer Electronics
In 2025, consumer electronics accounted for a significant portion of the market volume, driven by a robust upgrade cycle towards under-display sensors and edge-to-edge touch modules, fueling double-digit growth. Samsung's Galaxy S25 Ultra, featuring the new Corning Gorilla Armor 2, achieved a notable reduction in surface reflectance. This innovation has led rival OEMs to pursue similar 0.4-millimeter substrates. Following suit, notebook vendors are now adopting ultra-thin glass panels, moving away from the previously used yellow-prone polyimide films. However, the segment's dynamics are evolving, with semiconductor substrates for AI accelerators beginning to capture a larger market share. These advanced packaging applications not only command higher average selling prices but also utilize alkali-free chemistries. This ensures the protection of 112 Gbps SerDes lanes, subtly shifting the revenue focus towards these performance-critical grades.
Rapid Adoption in Foldable Smartphones and Notebooks
Ultra-thin glass economics have been revolutionized by the advent of foldable form factors. Samsung Display is rolling out its 8.6-generation OLED line, set to deliver crease-free panels tailored for Apple's anticipated foldable iPhone debuting in 2026. In a bid to mitigate risks, Chinese panel manufacturers are collaborating on microfloat soda-lime covers. These innovative covers boast impressive endurance and come at a significant cost advantage. Meanwhile, Corning has struck a deal, licensing its Willow roll-to-roll borosilicate, specifically designed for 180-degree notebook hinges. As a result, the industry's spotlight has shifted from merely ensuring hinge durability to mastering yield management. Notably, both float and microfloat lines are nearing the pivotal threshold, a sweet spot that harmonizes price and reliability for the mass-market foldable segment.
High Cost of High-Purity Raw Materials and Precision Processing
Costs rise as electronic-grade silica, with iron content less than 50 ppm, high-purity alumina powder, and platinum-rhodium furnace hardware see price hikes. In 2025, spot silica prices surged, impacting float-line margins, especially for those without hedged contracts. Fusion-draw furnaces, operating at high temperatures, necessitate crucible replacements periodically. Additionally, ion-exchange and laser patterning techniques command a significant premium for aluminosilicate covers compared to soda-lime. European manufacturers grapple with heightened pressures from soaring natural-gas tariffs. While SCHOTT's electric-melting retrofit in Mainz offers some relief, it doesn't fully shield against energy price fluctuations.
Other drivers and restraints analyzed in the detailed report include:
- Advancements in Flexible OLED and Micro-LED Display Lines
- Weight-Reduction Needs in Automotive Glazing and HUDs
- Brittleness and Yield Loss During Large-Area Handling
For complete list of drivers and restraints, kindly check the Table Of Contents.
Segment Analysis
Soda-lime ultra-thin products captured 46.09% of 2025 revenue and are forecast to grow at a 12.10% CAGR, underpinned by microfloat lines that hit sub-100 μm thickness at high yield. Aluminosilicate commands foldable-device covers where surface compression above 800 MPa secures 200,000 folds without cracks. Borosilicate and alkali-free glass underpin semiconductor substrates; their sub-3.5 ppm/°C expansion protects high-speed interconnects. Lithium-aluminosilicate remains a niche in HUD optics for its near-zero expansion. ISO 12543-4 durability tests favor borosilicate in automotive laminates, nudging premium OEMs upscale despite higher costs. Chinese float operators are therefore scaling soda-lime to significant production levels for mid-tier electronics, while patent-rich incumbents retain high-margin aluminosilicate and borosilicate tiers.
Float and microfloat technologies delivered 50.68% of 2025 production, and capacity expansions point to a 12.89% CAGR through 2031. The cost of a microfloat line is significantly lower than that of a fusion draw, allowing for a shorter payback period, assuming an optimal utilization rate. However, certain zero-defect applications, such as glass interposers and foldable covers, remain reliant on fusion and down-draw methods. This preference is due to the fact that in these methods, the melt never comes into contact with refractory surfaces. For instance, SCHOTT's down-draw borosilicate achieves a thickness of 20 μm with a roughness of less than 0.5 nm. These metrics are beyond reach in the tin-bath float method, where contact results in asperities of approximately 2 nm. Meanwhile, slit-draw and roll-to-roll processes are catering to the burgeoning flexible electronics market. Notably, Corning Willow is pioneering curved OLED lighting, and Fraunhofer is coating reels for photovoltaic modules. Consequently, the choice of process has evolved into a balancing act between acceptable inclusion density and capital expenditure, leading to a segmentation in the supply base.
Complete Report Scope:
- By Glass Type
- Aluminosilicate (e.g., Gorilla, Dragontrail)
- Borosilicate/Alkali-Free
- Soda-Lime Ultra-Thin
- Others (Lithium-Aluminosilicate, etc.)
- By Manufacturing Process
- Fusion Draw
- Down-Draw/Overflow
- Float and Microfloat
- Slit Draw/Roll-to-Roll
- By Application
- Semiconductor Substrate
- Touch Panel Displays
- Fingerprint Sensors
- Automotive Glazing
- Other Applications (Automotive Displays and Glazing, etc.)
- By End-User Industry
- Consumer Electronics
- Automotive
- Biotechnology
- Other End-User Industries (Energy and Power, etc.)
- By Geography
- Asia-Pacific
- China
- India
- Japan
- South Korea
- Rest of Asia-Pacific
- North America
- United States
- Canada
- Mexico
- Europe
- Germany
- United Kingdom
- France
- Italy
- Rest of Europe
- South America
- Brazil
- Argentina
- Rest of South America
- Middle-East and Africa
- Saudi Arabia
- South Africa
- Rest of Middle-East and Africa
- Asia-Pacific
Geography Analysis
Asia-Pacific delivered 49.59% of 2025 revenue, buoyed by Korean OLED investments and Chinese float retrofits that bolster economies of scale. North America's 11.91% CAGR through 2031, fueled by the CHIPS Act's fabs and mandates for vehicle lightweighting. Major players are driving the demand for advanced packaging, while AGC's Tlaxcala plant in Mexico supplies U.S. OEMs. Europe, holding a notable market share, is influenced by automotive glazing needs and stringent ecodesign regulations. SCHOTT's retrofit of electric melting not only mitigates energy volatility but also reduces CO2 emissions. Meanwhile, OEMs like BMW are adopting ultra-thin roofs to achieve a fleet target by 2027. Although South America and the MEA regions are still emerging, they stand to benefit from solar-energy initiatives, especially with a focus on 100 μm borosilicate covers post-2028.
- AGC Inc.
- Central Glass Co., Ltd.
- Changzhou Almaden Co., Ltd.
- Corning Incorporated
- CSG Holding Co., Ltd.
- Emerge Glass
- Fraunhofer
- Irico Group New Energy Company Limited
- Nippon Electric Glass Co., Ltd.
- Nippon Sheet Glass Co., Ltd.
- Nitto Denko Corporation.
- OFILM
- Samsung
- SCHOTT AG
- Taiwan Glass Ind. Corp.
- Tunghsu Optoelectronic Technology
- Xinyi Glass Holdings Limited.
Additional Benefits:
- The market estimate (ME) sheet in Excel format
- 3 months of analyst support
TABLE OF CONTENTS
1 Introduction
- 1.1 Study Assumptions and Market Definition
- 1.2 Scope of the Study
2 Research Methodology
3 Executive Summary
4 Market Landscape
- 4.1 Market Overview
- 4.2 Market Drivers
- 4.2.1 Growing demand from consumer electronics
- 4.2.2 Rapid adoption in foldable smartphones and notebooks
- 4.2.3 Advancements in flexible OLED and micro-LED display lines
- 4.2.4 Weight-reduction needs in automotive glazing and HUDs
- 4.2.5 Glass interposers for chiplet packaging
- 4.3 Market Restraints
- 4.3.1 High cost of high-purity raw materials and precision processing
- 4.3.2 Brittleness and yield loss during large-area handling
- 4.3.3 Limited recycling streams for greater than 0.3 mm glass waste
- 4.4 Value Chain Analysis
- 4.5 Porter's Five Forces
- 4.5.1 Threat of New Entrants
- 4.5.2 Bargaining Power of Buyers
- 4.5.3 Bargaining Power of Suppliers
- 4.5.4 Threat of Substitute Products
- 4.5.5 Degree of Competition
5 Market Size and Growth Forecasts (Value)
- 5.1 By Glass Type
- 5.1.1 Aluminosilicate (e.g., Gorilla, Dragontrail)
- 5.1.2 Borosilicate/Alkali-Free
- 5.1.3 Soda-Lime Ultra-Thin
- 5.1.4 Others (Lithium-Aluminosilicate, etc.)
- 5.2 By Manufacturing Process
- 5.2.1 Fusion Draw
- 5.2.2 Down-Draw/Overflow
- 5.2.3 Float and Microfloat
- 5.2.4 Slit Draw/Roll-to-Roll
- 5.3 By Application
- 5.3.1 Semiconductor Substrate
- 5.3.2 Touch Panel Displays
- 5.3.3 Fingerprint Sensors
- 5.3.4 Automotive Glazing
- 5.3.5 Other Applications (Automotive Displays and Glazing, etc.)
- 5.4 By End-User Industry
- 5.4.1 Consumer Electronics
- 5.4.2 Automotive
- 5.4.3 Biotechnology
- 5.4.4 Other End-User Industries (Energy and Power, etc.)
- 5.5 By Geography
- 5.5.1 Asia-Pacific
- 5.5.1.1 China
- 5.5.1.2 India
- 5.5.1.3 Japan
- 5.5.1.4 South Korea
- 5.5.1.5 Rest of Asia-Pacific
- 5.5.2 North America
- 5.5.2.1 United States
- 5.5.2.2 Canada
- 5.5.2.3 Mexico
- 5.5.3 Europe
- 5.5.3.1 Germany
- 5.5.3.2 United Kingdom
- 5.5.3.3 France
- 5.5.3.4 Italy
- 5.5.3.5 Rest of Europe
- 5.5.4 South America
- 5.5.4.1 Brazil
- 5.5.4.2 Argentina
- 5.5.4.3 Rest of South America
- 5.5.5 Middle-East and Africa
- 5.5.5.1 Saudi Arabia
- 5.5.5.2 South Africa
- 5.5.5.3 Rest of Middle-East and Africa
- 5.5.1 Asia-Pacific
6 Competitive Landscape
- 6.1 Market Concentration
- 6.2 Strategic Moves
- 6.3 Market Share(%)/Ranking Analysis
- 6.4 Company Profiles (includes Global level Overview, Market level overview, Core Segments, Financials, Strategic Info, Products and Services, Recent Developments)
- 6.4.1 AGC Inc.
- 6.4.2 Central Glass Co., Ltd.
- 6.4.3 Changzhou Almaden Co., Ltd.
- 6.4.4 Corning Incorporated
- 6.4.5 CSG Holding Co., Ltd.
- 6.4.6 Emerge Glass
- 6.4.7 Fraunhofer
- 6.4.8 Irico Group New Energy Company Limited
- 6.4.9 Nippon Electric Glass Co., Ltd.
- 6.4.10 Nippon Sheet Glass Co., Ltd.
- 6.4.11 Nitto Denko Corporation.
- 6.4.12 OFILM
- 6.4.13 Samsung
- 6.4.14 SCHOTT AG
- 6.4.15 Taiwan Glass Ind. Corp.
- 6.4.16 Tunghsu Optoelectronic Technology
- 6.4.17 Xinyi Glass Holdings Limited.
7 Market Opportunities and Future Outlook
- 7.1 White-space and Unmet-need Assessment
- 7.2 Development of Advanced Glass for Solar Energy Projects

 超薄玻璃市場:按材料類型、厚度、製程、應用和最終用戶分類-2026-2032年全球市場預測
 超薄玻璃市場:按厚度、應用和地區分類
 超薄玻璃市場報告:按厚度類型、製造流程、應用、終端用戶產業和地區分類(2026-2034 年)
 超薄玻璃市場規模、佔有率和成長分析(按厚度、製造流程、應用、終端用戶產業和地區分類)-2026-2033年產業預測
 全球超薄透明玻璃市場
 全球超薄玻璃市場規模(按厚度範圍、應用、最終用戶產業、區域範圍和預測)
 2032年超薄玻璃市場預測:全球厚度、製造流程、應用、最終用戶和地區分析
 超薄玻璃市場規模、佔有率、趨勢分析報告:按應用、地區、細分市場、預測,2025-2030 年
 超薄玻璃市場機會、成長動力、產業趨勢分析及 2025 - 2034 年預測