


 |
市場調查報告書
商品編碼
2123500
滴灌:市場佔有率分析、產業趨勢與統計、成長預測(2026-2031)Drip Irrigation - Market Share Analysis, Industry Trends & Statistics, Growth Forecasts (2026 - 2031) |
||||||

※ 本網頁內容可能與最新版本有所差異。詳細情況請與我們聯繫。
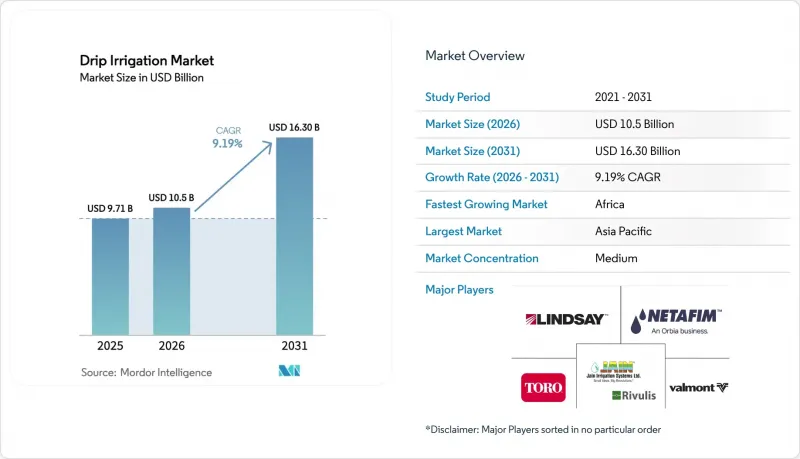
根據 Mordor Intelligence 估計,滴灌市場在 2025 年的價值為 97.1 億美元,到 2026 年將達到 105 億美元。
此外,預計到 2031 年,該行業將以 9.19% 的複合年成長率成長,達到 163 億美元,這凸顯了向節水農業系統的決定性轉變。
本報告按應用領域(例如,地表滴灌)、組件(例如,發送器/滴灌器)、作物類型(例如,田間作物)、最終用戶(例如,商業農場)、銷售管道(例如,直銷)和地區(例如,北美、歐洲)進行分類。市場預測以價值(美元)和數量(單位)表示。
全球滴灌市場趨勢及洞察
促進因素影響分析
政府對微灌系統的補貼
稅收優惠正在縮短商業農戶的投資回收期。在印度,總理農業灌溉計畫(Pradhan Mantri Krishi Sinchayee Yojana)在2016年至2025年間提供了2,196.87億印度盧比(約26億美元)的資金,為小規模農戶補貼高達55%的系統成本。在美國,環境品質獎勵計畫(EQIP)每年撥款3億美元,到2024年,滴灌計畫將佔津貼計畫的42%。在以色列,稅額扣抵可減少30%的實際資本支出,而沙烏地阿拉伯則強制要求10公頃以上的新農場採用滴灌,並提供5億美元的津貼。在這些項目中,蔬菜和果園等高價值作物的投資回收期均不到2.5年,從而推動了滴灌市場的永續發展。
資金限制阻礙了小規模農業的普及。
每公頃1200至1800美元的安裝成本超過了許多2公頃農場的年農業收入。在印度,儘管有55%的補貼,但自付費用仍然超過每公頃540美元,超過了無抵押貸款的限額。孟加拉的一個試點計畫採用每月15美元的「按需付費」模式,還款率達72%,但小規模。除非硬體價格再下降20%至30%,否則資金籌措將與作物生長週期掛鉤,但分散農地的普及率將落後於滴灌市場的整體發展。
細分市場分析
2025年,地表滴灌在灌溉方式細分市場仍維持最大佔有率,達67.0%。這反映了其安裝成本低且適用於一年生作物。地下滴灌是成長最快的細分市場,預計到2031年將以11.6%的複合年成長率成長,因為果園和葡萄園經營者致力於減少因蒸發和雜草損害造成的水分損失。由於長期缺水問題日益嚴重,地下滴灌預計將應用於除高價值作物以外的其他作物,其對滴灌市場的貢獻預計在預測期結束時將有所成長。
隨著組件價格逐步下降和控制技術不斷進步,種植者正將土壤濕度感測器與地下灌溉管線結合使用,並最佳化灌溉計劃,從而將高階果園的用水效率提高高達90%。印度的政府津貼和加州《永續地下水管理法案》下的水資源分配削減也促進了地下灌溉系統的發展,使其投資回收期縮短至不到四個種植季。地表灌溉系統仍將在短週期作物中發揮重要作用。然而,不斷上漲的電費和更嚴格的蒸發法規預計將逐步將資金重新分配到地下灌溉設施。這些變化將共同維持兩種灌溉系統的平衡成長,但地下灌溉技術的更快普及將為滴灌市場的長期設備更新奠定基礎。
到2025年,滴管材將佔據組件細分市場30.0%的最大佔有率,這主要得益於定期更換週期和耕地面積的大幅擴張。控制器和感測器是成長最快的細分市場,預計到2031年將以14.0%的複合年成長率成長,這主要得益於農地灌溉自動化、勞動力成本降低高達30%以及即時氣象資料整合技術的進步。因此,整合數位硬體的滴灌市場規模成長速度遠超整體市場,這得益於感測器價格的下降和基於雲端的分析技術,這些技術將投資回收期縮短至三年以內。
在商品化噴頭市場競爭日益激烈的背景下,高價值電子產品的成長正幫助老牌企業維持利潤率。目前,中國製造的壓力補償式噴頭售價為每台0.08美元。儘管由於水質問題和離網農業的趨勢,對過濾器和水泵的需求穩步成長,但數位設備仍然是性能差異化的明顯優勢。製造商透過將軟體訂閱與控制器捆綁銷售,獲得了持續的收入,並為未來的升級留住了基本客群。隨著部署範圍從大型農場擴展到中型企業,感測器的採用將進一步加速,控制器和感測器將繼續引領組件級成長。
區域分析
亞太地區佔最大的市場佔有率,預計到2025年將佔全球滴灌市場銷售額的42%。印度優惠的補貼政策和中國大規模的現代化改造,正鼓勵生產者將大片農地改造為滴灌面積,使經銷商能夠迅速擴大業務規模。各國政府正將資本津貼與水費改革結合,使自動化系統即使對於中型農場也成為經濟可行的選擇。製造商也在印度和澳洲進行在地化生產,從而降低物流成本,縮短大型專案的交付時間。整合土壤感測器和氣象數據的數位平台,正吸引新疆大型棉花種植園以及日本和韓國的特色作物種植者等早期採用者。
亞太地區的擴張主要受印度恆河平原持續的地下水枯竭和澳洲墨累-達令河流域反覆發生的乾旱所驅動。微灌技術已被納入各國氣候變遷計畫的適應目標,從而產生了對控制器、過濾器和滴灌帶的多年穩定需求。印度強大的分銷網路和政府市場正在幫助小規模農戶融入正規的採購管道,這些管道提供安裝和農業技術支援等一攬子服務。泰國和越南的出口型水果種植者正在鋪設地下灌溉管道,以確保為高階市場提供穩定的水果品質。供應商提供基於訂閱的遠端監控服務,以確保系統在關鍵生長階段的運作。
預計到2031年,非洲將經歷最快的成長,年複合成長率(CAGR)將達到11.0%,這主要得益於開發銀行提供的資金支持,這些資金結合了硬體和農業技術培訓。在肯亞,滴灌系統正在半乾旱地區推廣,以減少降雨不穩定造成的作物損失,並改善糧食安全狀況。在埃及,滴灌系統正在推動沙漠農業發展,使柑橘和葡萄等高價值作物得以出口,儘管地表水資源有限。在南非西開普省葡萄酒產區,感測器控制的滴灌系統正被用來保護葡萄園免受長期乾旱的影響。中東的生產者、歐洲的地中海種植者以及北美的果園主都注意到了這些成功案例,並正在採用類似的模式,進一步加速了全球節水農業的發展勢頭。
其他好處:
- Excel格式的市場預測(ME)表
- 3個月的分析師支持
目錄
第1章:引言
- 研究假設和市場定義
- 調查範圍
第2章:調查方法
第3章執行摘要
第4章 市場狀況
- 市場概覽
- 市場促進因素
- 政府對微灌系統的補貼
- 精密農業簡介
- 水資源短缺日益加劇
- 經證實,產量可提高20%至40%。
- 物聯網 (IoT) 與感測器的整合實現了精準的水資源管理。
- 強制種植抗氣候變遷作物
- 市場限制因素
- 資金限制阻礙了小規模農戶採用這些技術。
- 在水質較硬的地區,堵塞會增加營運成本。
- 經銷商分散阻礙了服務品質的提升。
- 電力補貼扭曲了灌溉選擇。
- 監理情勢
- 技術展望
- 波特五力分析
第5章 市場規模與成長預測
- 透過使用
- 地表滴灌
- 地下滴灌
- 按組件
- 發送器
- 靜脈注射管/靜脈注射注射線
- 篩選
- 壓力泵
- 閥門和管件
- 控制器和感測器
- 配件(地釘、連接件、插頭)
- 按作物類型
- 田間作物
- 蔬菜
- 水果作物
- 葡萄園
- 其他作物(經濟作物和觀賞作物)
- 最終用戶
- 商業農場
- 溫室/苗圃
- 住宅花園和景觀設計
- 運動場高爾夫球場
- 按銷售管道
- 直銷
- 經銷商/分銷商
- 線上零售
- 按地區
- 北美洲
- 美國
- 加拿大
- 墨西哥
- 其他北美國家
- 歐洲
- 德國
- 英國
- 法國
- 西班牙
- 義大利
- 俄羅斯
- 其他歐洲國家
- 亞太地區
- 印度
- 中國
- 日本
- 韓國
- 澳洲
- 其他亞太國家
- 南美洲
- 巴西
- 阿根廷
- 智利
- 其他南美國家
- 中東
- 以色列
- 沙烏地阿拉伯
- 阿拉伯聯合大公國
- 土耳其
- 其他中東國家
- 非洲
- 南非
- 埃及
- 肯亞
- 其他非洲國家
- 北美洲
第6章 競爭情勢
- 市場集中度
- 策略趨勢
- 市佔率分析
- 公司簡介
- Netafim Limited(Orbia Advance Corporation)
- Jain Irrigation Systems Ltd.(Rivulis Irrigation Ltd.)
- The Toro Company
- Rain Bird Corporation
- Valmont Industries Inc.
- Rivulis Irrigation Ltd.
- Lindsay Corporation
- Chinadrip Irrigation Equipment Co. Ltd.
- Antelco Pty Ltd.
- Sistema Azud SA
- Metzer Group Ltd.
- Mahindra EPC Irrigation Ltd.
- Irritec SpA
- Hunter Industries Inc.
- Dayu Irrigation Group Co. Ltd.
第7章 市場機會與未來展望
According to Mordor Intelligence, the drip irrigation market size was valued at USD 9.71 billion in 2025 and is estimated to reach USD 10.50 billion in 2026, further projected to grow at a CAGR of 9.19% to reach USD 16.30 billion by 2031, underscoring a decisive shift toward water-efficient farming systems.
This report is Segmented by Application (Surface Drip Irrigation and More), by Component (Emitters / Drippers, and More), by Crop Type (Field Crops, and More), by End-User (Commercial Farms, and More), by Sales Channel (Direct Sales, and More), and by Geography (North America, Europe, and More). The Market Forecasts are Provided in Terms of Value (USD) and Volume (Units).
Global Drip Irrigation Market Trends and Insights
Drivers Impact Analysis
Government subsidies for micro-irrigation
Fiscal incentives compress capital-recovery timelines for commercial growers. India's Pradhan Mantri Krishi Sinchayee Yojana disbursed INR 21,968.7 crore (USD 2.6 billion) between fiscal years 2016 and 2025, subsidizing up to 55% of the system cost for small farmers. The United States allocated USD 300 million annually through the Environmental Quality Incentives Program, with drip accounting for 42% of funded projects in 2024. Israel's tax credits trimmed effective capital outlay by 30%, while Saudi Arabia mandated drip on new farms larger than 10 hectares, channeling USD 500 million in grants. Across programs, payback now falls below 2.5 years for high-value crops, such as vegetables and orchards, driving sustained growth in the drip irrigation market.
Capital Constraints Limit Smallholder Adoption
Installation costs of USD 1,200-USD 1,800 per hectare exceed annual farm incomes in many two-hectare operations. Despite 55% subsidies in India, out-of-pocket spending still tops USD 540 per hectare, above collateral-free borrowing limits. Pay-as-you-go pilots in Bangladesh, priced at USD 15 per month, achieved a 72% repayment rate yet remain small-scale. Until hardware prices drop by another 20%-30%, financing will align with crop cycles, however, penetration in fragmented holdings will lag behind the broader drip irrigation market.
Other drivers and restraints analyzed in the detailed report include:
- Precision agriculture adoption
- Escalating water scarcity
- Internet of Things (IoT) Sensor Integration Unlocks Precision Water Management
- Clogging Escalates Operating Costs in Hard-Water Zones
For complete list of drivers and restraints, kindly check the Table Of Contents.
Segment Analysis
Surface drip irrigation retained the largest share at 67.0% of the by-application segment in 2025, reflecting its lower installation cost and suitability for annual crops. Subsurface drip irrigation is the fastest-growing sub-segment and is projected to expand at an 11.6% CAGR through 2031, as orchard and vineyard operators focus on reducing evaporative losses and weed pressure. Rising long-term water stress drives the adoption of subsurface irrigation beyond premium crops, increasing its contribution to the drip irrigation market by the end of the forecast window.
As component prices gradually decline and guidance technologies improve, growers are pairing subsurface lines with soil-moisture sensors that fine-tune scheduling, increasing water-use efficiency to up to 90% in premium orchards. State incentives in India and allocation cuts under the Sustainable Groundwater Management Act in California also favor buried systems, shortening payback periods to fewer than four seasons. Surface systems will remain influential for short-cycle crops. However, rising electricity tariffs and stricter evaporation caps will progressively reallocate capital toward subsurface installations. The combined shift sustains balanced growth across both formats, but the faster trajectory of subsurface technology underpins long-run upgrades in the drip irrigation market.
Drip tubes and lines held the largest share at 30.0% of the by-component segment in 2025, driven by regular replacement cycles and the expansion of broad acreage. Controllers and sensors represent the fastest-growing sub-segment, advancing at a 14.0% CAGR through 2031 as farms automate water delivery, trim labor by up to 30%, and integrate real-time weather data. The drip irrigation market size, linked to digital hardware, therefore tracks well above the overall market pace, buoyed by falling sensor prices and cloud-based analytics that compress the payback period to less than three years.
Growth in higher-value electronics also helps incumbents shield margins as price competition intensifies for commoditized emitters, where Chinese pressure-compensating units now sell for USD 0.08 each. Filters and pumps are rising steadily in response to water-quality and off-grid trends, yet digital devices remain the clear performance differentiator. Manufacturers bundle software subscriptions with controllers, generating recurring revenue and securing clients for future upgrades. As adoption spreads from mega-farms to mid-size operators, sensor penetration will continue to accelerate, keeping controllers and sensors at the forefront of component-level growth.
Complete Report Scope:
- By Application
- Surface Drip Irrigation
- Subsurface Drip Irrigation
- By Component
- Emitters and Drippers
- Drip Tubes and Lines
- Filters
- Pressure Pumps
- Valves and Fittings
- Controllers and Sensors
- Accessories (Stake, Joiners, and Plugs)
- By Crop Type
- Field Crops
- Vegetable Crops
- Orchard Crops
- Vineyards
- Other Crops (Commercial and Ornamental)
- By End-User
- Commercial Farms
- Greenhouses and Nurseries
- Residential Gardens and Landscapes
- Sports Fields and Golf Courses
- By Sales Channel
- Direct Sales
- Dealer and Distributor
- Online Retail
- By Geography
- North America
- United States
- Canada
- Mexico
- Rest of North America
- Europe
- Germany
- United Kingdom
- France
- Spain
- Italy
- Russia
- Rest of Europe
- Asia-Pacific
- India
- China
- Japan
- South Korea
- Australia
- Rest of Asia-Pacific
- South America
- Brazil
- Argentina
- Chile
- Rest of South America
- Middle East
- Israel
- Saudi Arabia
- United Arab Emirates
- Turkey
- Rest of Middle East
- Africa
- South Africa
- Egypt
- Kenya
- Rest of Africa
- North America
Geography Analysis
The Asia-Pacific region holds the largest market share, accounting for 42% of the global revenue in the drip irrigation market in 2025. Favorable subsidy programs in India and broad modernization efforts in China encourage growers to convert vast field-crop acreage, allowing distributors to scale quickly. Governments couple capital grants with water-pricing reforms, making automated systems economically sensible even for mid-size farms. Manufacturers also localize production in India and Australia, reducing logistics costs and shortening delivery times for high-volume projects. Digital platforms that integrate soil sensors and weather data are attracting early adopters among large cotton estates in Xinjiang and specialty crop producers in Japan and South Korea.
Asia-Pacific's expansion is underpinned by persistent groundwater depletion across the Indo-Gangetic Plain and by recurring drought in Australia's Murray-Darling Basin. National climate action plans incorporate micro-irrigation into adaptation targets, creating a dependable multi-year demand for controllers, filters, and drip tape. Strong dealer networks in India and government e-marketplaces facilitate the integration of smallholders into organized procurement channels, which bundle installation with agronomic support. Export-oriented fruit growers in Thailand and Vietnam adopt subsurface lines to secure consistent quality for premium markets. Suppliers respond by offering subscription-based remote monitoring, ensuring system uptime during critical growth stages.
Africa is projected to record the fastest growth, registering an 11.0% CAGR through 2031, propelled by development-bank financing that pairs hardware with agronomic training. Kenya deploys drip kits in semi-arid counties, reducing crop losses from erratic rainfall and improving food security outcomes. Egypt promotes desert agriculture with the use of drip systems, enabling the high-value export of citrus and grapes despite its limited surface water resources. South Africa's Western Cape wine region adopts deficit-irrigation strategies through sensor-guided drip irrigation, safeguarding vines during prolonged droughts. Middle East producers, Europe's Mediterranean growers, and North American orchardists observe these successes and adapt similar models, reinforcing global momentum toward water-efficient farming.
- Netafim Limited (Orbia Advance Corporation)
- Jain Irrigation Systems Ltd. (Rivulis Irrigation Ltd.)
- The Toro Company
- Rain Bird Corporation
- Valmont Industries Inc.
- Rivulis Irrigation Ltd.
- Lindsay Corporation
- Chinadrip Irrigation Equipment Co. Ltd.
- Antelco Pty Ltd.
- Sistema Azud S.A.
- Metzer Group Ltd.
- Mahindra EPC Irrigation Ltd.
- Irritec S.p.A.
- Hunter Industries Inc.
- Dayu Irrigation Group Co. Ltd.
Additional Benefits:
- The market estimate (ME) sheet in Excel format
- 3 months of analyst support
TABLE OF CONTENTS
1 Introduction
- 1.1 Study Assumptions and Market Definition
- 1.2 Scope of the Study
2 Research Methodology
3 Executive Summary
4 Market Landscape
- 4.1 Market Overview
- 4.2 Market Drivers
- 4.2.1 Government subsidies for micro-irrigation
- 4.2.2 Precision agriculture adoption
- 4.2.3 Escalating water scarcity
- 4.2.4 Proven 20%-40% yield gains
- 4.2.5 Internet of Things (IoT) Sensor Integration Unlocks Precision Water Management
- 4.2.6 Climate-resilient cropping mandates
- 4.3 Market Restraints
- 4.3.1 Capital Constraints Limit Smallholder Adoption
- 4.3.2 Clogging Escalates Operating Costs in Hard-Water Zones
- 4.3.3 Dealer Fragmentation Impedes Service Quality
- 4.3.4 Electricity Subsidies Distort Irrigation Choices
- 4.4 Regulatory Landscape
- 4.5 Technological Outlook
- 4.6 Porter's Five Forces Analysis
- 4.6.1 Threat of New Entrants
- 4.6.2 Bargaining Power of Buyers
- 4.6.3 Bargaining Power of Suppliers
- 4.6.4 Threat of Substitutes
- 4.6.5 Intensity of Competitive Rivalry
5 Market Size and Growth Forecasts (Value)
- 5.1 By Application
- 5.1.1 Surface Drip Irrigation
- 5.1.2 Subsurface Drip Irrigation
- 5.2 By Component
- 5.2.1 Emitters and Drippers
- 5.2.2 Drip Tubes and Lines
- 5.2.3 Filters
- 5.2.4 Pressure Pumps
- 5.2.5 Valves and Fittings
- 5.2.6 Controllers and Sensors
- 5.2.7 Accessories (Stake, Joiners, and Plugs)
- 5.3 By Crop Type
- 5.3.1 Field Crops
- 5.3.2 Vegetable Crops
- 5.3.3 Orchard Crops
- 5.3.4 Vineyards
- 5.3.5 Other Crops (Commercial and Ornamental)
- 5.4 By End-User
- 5.4.1 Commercial Farms
- 5.4.2 Greenhouses and Nurseries
- 5.4.3 Residential Gardens and Landscapes
- 5.4.4 Sports Fields and Golf Courses
- 5.5 By Sales Channel
- 5.5.1 Direct Sales
- 5.5.2 Dealer and Distributor
- 5.5.3 Online Retail
- 5.6 By Geography
- 5.6.1 North America
- 5.6.1.1 United States
- 5.6.1.2 Canada
- 5.6.1.3 Mexico
- 5.6.1.4 Rest of North America
- 5.6.2 Europe
- 5.6.2.1 Germany
- 5.6.2.2 United Kingdom
- 5.6.2.3 France
- 5.6.2.4 Spain
- 5.6.2.5 Italy
- 5.6.2.6 Russia
- 5.6.2.7 Rest of Europe
- 5.6.3 Asia-Pacific
- 5.6.3.1 India
- 5.6.3.2 China
- 5.6.3.3 Japan
- 5.6.3.4 South Korea
- 5.6.3.5 Australia
- 5.6.3.6 Rest of Asia-Pacific
- 5.6.4 South America
- 5.6.4.1 Brazil
- 5.6.4.2 Argentina
- 5.6.4.3 Chile
- 5.6.4.4 Rest of South America
- 5.6.5 Middle East
- 5.6.5.1 Israel
- 5.6.5.2 Saudi Arabia
- 5.6.5.3 United Arab Emirates
- 5.6.5.4 Turkey
- 5.6.5.5 Rest of Middle East
- 5.6.6 Africa
- 5.6.6.1 South Africa
- 5.6.6.2 Egypt
- 5.6.6.3 Kenya
- 5.6.6.4 Rest of Africa
- 5.6.1 North America
6 Competitive Landscape
- 6.1 Market Concentration
- 6.2 Strategic Moves
- 6.3 Market Share Analysis
- 6.4 Company Profiles (Includes Global level Overview, Market level overview, Core Segments, Financials as Available, Strategic Information, Market Rank/Share for key companies, Products and Services, and Recent Developments)
- 6.4.1 Netafim Limited (Orbia Advance Corporation)
- 6.4.2 Jain Irrigation Systems Ltd. (Rivulis Irrigation Ltd.)
- 6.4.3 The Toro Company
- 6.4.4 Rain Bird Corporation
- 6.4.5 Valmont Industries Inc.
- 6.4.6 Rivulis Irrigation Ltd.
- 6.4.7 Lindsay Corporation
- 6.4.8 Chinadrip Irrigation Equipment Co. Ltd.
- 6.4.9 Antelco Pty Ltd.
- 6.4.10 Sistema Azud S.A.
- 6.4.11 Metzer Group Ltd.
- 6.4.12 Mahindra EPC Irrigation Ltd.
- 6.4.13 Irritec S.p.A.
- 6.4.14 Hunter Industries Inc.
- 6.4.15 Dayu Irrigation Group Co. Ltd.
7 Market Opportunities and Future Outlook

 滴灌市場:按類型、組件、專案階段、應用、最終用途和分銷管道分類-2026-2032年全球預測
 全球滴灌市場(至2031年):按組件(壓力泵、滴灌主管道/管材、閥門、發送器/滴灌器、過濾器和施肥器、接頭和配件)、作物類型、應用和地區分類溫室滴灌系統市場:依產品類型、作物類型、溫室結構、最終用戶、通路分類,全球預測(2026-2032年)
 滴灌市場規模、佔有率和成長分析(按系統類型、組件類型、作物類型、最終用戶和地區分類)-2026-2033年產業預測
 2026年全球滴灌市場報告
 滴灌市場-全球產業規模、佔有率、趨勢、機會和預測:按組件、作物類型、發送器類型、應用、最終用戶、地區和競爭格局分類,2021-2031年
 滴灌市場規模、佔有率和趨勢分析報告:按組件、流量、方法、作物、地區和細分市場預測,2026-2033年
 滴灌系統市場:全球 2025-2029
 滴水盤市場機會、成長動力、產業趨勢分析及 2025 - 2034 年預測
 全球滴灌灌水器市場