


 |
市場調查報告書
商品編碼
2123461
交易監控系統:市場佔有率分析、產業趨勢與統計、成長預測(2026-2031)Trade Surveillance Systems - Market Share Analysis, Industry Trends & Statistics, Growth Forecasts (2026 - 2031) |
||||||

※ 本網頁內容可能與最新版本有所差異。詳細情況請與我們聯繫。
據 Mordor Intelligence 稱,貿易監控系統的市場規模預計在 2026 年達到 33.2 億美元,高於 2025 年的 28.4 億美元,預計到 2031 年將達到 72.9 億美元。
預計 2026 年至 2031 年的複合年成長率為 17.05%。
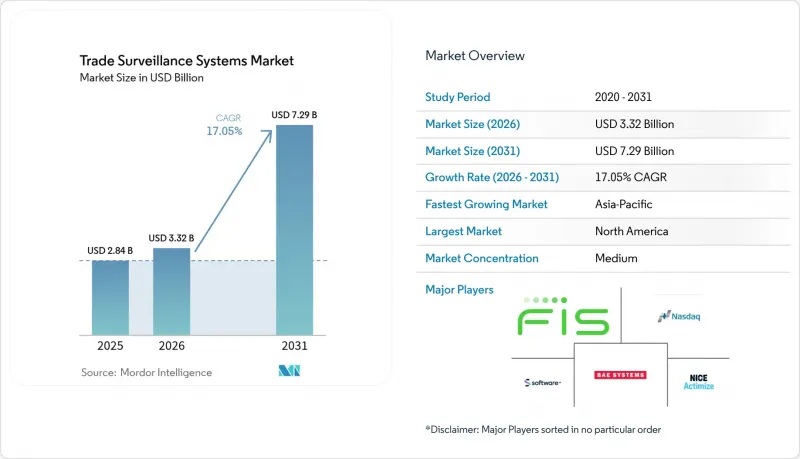
本報告按組件(解決方案和服務)、部署模式(本地部署和雲端部署)、交易類型(股票、債券等)、最終用戶(賣方機構、買方機構等)、組織規模(一級全球銀行、二級和中型企業等)以及地區進行細分。市場預測以美元計價。
全球交易監控系統市場趨勢與洞察
多資產電子交易平台的快速擴張
目前,高頻交易和演算法交易策略占美國股票交易量的一半以上,這造成了監控盲點,而傳統的規則集難以彌補這些盲點。公司必須關聯股票、債券、選擇權和大宗商品的訂單簿,同時也要考慮毫秒級的延遲差異,因為這些差異使得交易所之間的套利成為可能。倫敦交易所從交易商模式轉向全自動、訂單主導交易所的轉變,生動地展現了流動性增加與市場操縱風險加劇並存的現實。為了應對這項挑戰,供應商正在整合資料饋送,並加入交易所特定的調整功能,以偵測分散市場中的欺騙交易和分層交易行為。
強制性CAT及其他交易後透明度法規
美國證券交易委員會的「公司代幣發行」(CAT)方案要求美國經紀公司根據單一模式報告所有股票和選擇權交易事件。儘管2025年3月的修訂案減少了個人資料部分,但保留了唯一標識符,這使得公司每年能夠節省1200萬美元的成本,同時仍能向監管機構提供完整的資訊。類似的壓力在歐洲也日益增大,MiFIR 3引入了數位代幣識別碼和新的生效日期標籤,要求系統升級以處理更豐富的數據。因此,金融機構正在將監控系統定位為重要的合規基礎設施,而不僅僅是選擇權風險管理工具。
與傳統前台、中台和後勤部門系統進行高階整合的複雜性。
英國近92%的金融機構仍依賴大型主機以夜間批次方式處理交易文件,這種速度與每秒監控的需求不符。協調訊息協定、欄位分類系統和時間同步需要製定多年藍圖,通常涉及50多個內部團隊。缺乏協調會導致資料饋送不完整和警報遺漏,運作新舊平台並行運行一段時間,直到監管機構確認資料完整性。
細分市場分析
預計到2025年,該解決方案將佔據交易監控系統市場61.55%的佔有率,凸顯了整合訂單、執行和通訊資料的端到端平台的重要性。該細分市場受益於高昂的轉換成本和持續的規則更新,使供應商能夠持續獲得授權收入。隨著銀行在關鍵監管期限前續簽企業許可證,與該解決方案相關的交易監控系統市場規模預計將穩定成長。
儘管規模較小,但隨著金融機構將模型調優和監管合規映射等工作外包,服務業正以18%的複合年成長率快速成長。託管服務合約彌補了內部人才的不足,並提供全天候支持,不受地域限制。服務提供者將部署、行為模型校準和上運作後測試打包在一起,對於中型經紀公司而言,這比聘請專業的量化分析師更具成本效益。
即使到了2025年,本地部署預計仍將保持54.15%的市場佔有率,這反映了資料主權義務以及審計人員對安裝在防火牆內的系統的偏好。然而,源自雲端服務的交易監控系統市場規模預計將成長最快,到2031年將以19.05%的複合年成長率成長,因為監管機構明確表示「加密資料可以儲存在經批准的司法管轄區內」。
雲端服務供應商提供強大的運算能力,可在夜間回測數百萬個場景,這種能力在本地部署的網格上很難複製,除非投入過多的資源。混合模式正日益受到關注,因為它允許將個人識別資訊保留在本地資料中心,同時將匿名化的交易記錄傳輸到雲端叢集進行高級分析。新加坡和加拿大的成功先導計畫表明,只要加密金鑰始終由客戶掌控,此類架構就能通過監管審查。
區域分析
亞太地區以17.6%的複合年成長率領先全球,在監管技術領域從追隨者躍升為先行者。新加坡金融管理局(MAS)正在試行一項以人工智慧為基礎的反洗錢和反恐融資(AML-CFT)模型,並將其整合到交易監控系統中,打造一個其他監管機構密切關注的參考實施方案。在香港,對持牌虛擬資產業者實施監控範圍已成為強制性要求,導致交易所和主仲介的支出增加。
北美仍是最大的貢獻地區,佔比33.92%,主要得益於Caterpillar(CAT)以及預計2025年中期生效的賣空機制。美國受惠於供應商與主要股票和選擇權交易所的地理位置接近性,而隨著跨交易所交易量的成長,加拿大的投資也正在加速增加。
歐洲的實施已進入成熟階段,MiFIR II 和 EMIR 已納入嚴格的交易報告要求。即將修訂的 MiFIR 3 將引入數位代幣標識符,並擴大監管範圍。歐洲大陸的銀行正在升級其系統,以確保各業務部門的交易識別碼保持一致;同時,英國公司也在並行推進相關流程,以應對脫歐後監管方面的差異。
其他好處:
- Excel格式的市場預測(ME)表
- 3個月的分析師支持
目錄
第1章:引言
- 研究假設和市場定義
- 調查範圍
第2章:調查方法
第3章執行摘要
第4章 市場狀況
- 市場概覽
- 市場促進因素
- 全球多元資產電子交易平台的快速擴張。
- 強制性綜合審計追蹤(CAT)和其他交易後透明度法規
- 利用人工智慧/機器學習進行異常檢測可以減少誤報和合規成本。
- 提供雲端原生 SaaS 可降低整體擁有成本 (TCO)。
- 受監管機構對加密貨幣和數位資產交易的採用率不斷提高
- 真實資產的代幣化正在造成監控的新盲點。
- 市場限制因素
- 與傳統前台、中台和後勤部門系統整合的複雜性。
- 貿易監測領域資料科學人才短缺
- 全球監管框架的差異導致合規成本高昂。
- 更嚴格的隱私法規限制了綜合監控資料的整合。
- 產業價值鏈分析
- 監理情勢
- 技術展望
- 產業吸引力—五力分析
- 供應商的議價能力
- 買方的議價能力
- 新進入者的威脅
- 替代品的威脅
- 競爭公司之間的競爭
- 宏觀經濟因素對市場的影響
第5章 市場規模與成長預測
- 按組件
- 解決方案
- 服務
- 部署模式
- 現場
- 雲
- 按交易類型
- 庫存
- 紐帶
- 衍生性商品
- 外匯
- 商品
- 數位資產
- 最終用戶
- 賣方機構
- 買方組織
- 市場場所和交易所
- 監管機構和自我規範組織
- 按組織規模
- 世界一流銀行
- 二線和中型企業
- 小規模金融機構及證券公司
- 金融科技與加密貨幣交易所
- 按地區
- 北美洲
- 美國
- 加拿大
- 墨西哥
- 南美洲
- 巴西
- 阿根廷
- 智利
- 其他南美國家
- 歐洲
- 德國
- 英國
- 法國
- 義大利
- 西班牙
- 俄羅斯
- 其他歐洲國家
- 亞太地區
- 中國
- 印度
- 日本
- 韓國
- 澳洲
- 新加坡
- 馬來西亞
- 其他亞太國家
- 中東和非洲
- 中東
- 阿拉伯聯合大公國
- 沙烏地阿拉伯
- 土耳其
- 其他中東國家
- 非洲
- 南非
- 奈及利亞
- 其他非洲國家
- 中東
- 北美洲
第6章 競爭情勢
- 市場集中度
- 策略趨勢
- 市佔率分析
- 公司簡介
- NICE Ltd.(Actimize)
- Nasdaq Inc.(SMARTS)
- BAE Systems Digital Intelligence
- Fidelity National Information Services Inc.(FIS)
- Software AG
- Eventus Systems Inc.
- ACA Group
- TradingHub Group Ltd.
- eflow Ltd.
- B-next Group GmbH
- Solidus Labs Inc.
- Aquis Technologies Ltd.
- Trillium Management LLC
- SIA SpA
- IBM Watson Financial RegTech
- S&P Global Market Intelligence(KYC/Surveillance)
- VoxSmart Ltd.
- OneMarketData LLC
- SteelEye Ltd.
- CranSoft(Scila AB)
- KX Systems(First Derivatives plc)
- ShieldFC Ltd.
- IPC Systems Inc.(Connexus)
- Trapets AB
- Corvil Analytics by Pico
- Digital Reasoning Systems Inc.
第7章 市場機會與未來趨勢
- 評估閒置頻段和未滿足的需求
According to Mordor Intelligence, trade surveillance systems market size in 2026 is estimated at USD 3.32 billion, growing from 2025 value of USD 2.84 billion with 2031 projections showing USD 7.29 billion, growing at 17.05% CAGR over 2026-2031.
This report is Segmented by Component (Solutions and Services), Deployment Mode (On-Premise and Cloud), Trading Type (Equities, Fixed Income, and More), End-User (Sell-Side Institutions, Buy-Side Institutions, and More), Organisation Size (Tier-1 Global Banks, Tier-2 and Mid-Sized Firms, and More), and Geography. The Market Forecasts are Provided in Terms of Value (USD).
Global Trade Surveillance Systems Market Trends and Insights
Rapid Expansion of Multi-Asset Electronic Trading Venues
High-frequency and algorithmic strategies now drive more than half of US equity volumes, creating surveillance blind spots that legacy rule sets struggle to cover. Firms must correlate order books across equities, fixed income, options, and commodities while accounting for millisecond latency gaps that enable cross-venue arbitrage. The shift from dealer models to fully automated order-driven venues in London illustrates how liquidity gains coexist with higher market-abuse risk. Vendors respond by unifying data feeds and embedding venue-specific calibrations that flag spoofing and layering across fragmented markets.
Mandatory CAT and Other Post-Trade Transparency Mandates
The CAT regime obliges US brokers to report every equity and option event under one schema. A March 2025 amendment trimmed personal data fields yet preserved unique identifiers, saving firms USD 12 million yearly while keeping regulators fully informed. Similar pressure builds in Europe, where MiFIR 3 introduces digital-token identifiers and new effective-date tags, compelling upgrades to handle richer payloads. Institutions, therefore, treat surveillance as foundational compliance infrastructure rather than optional risk tooling.
High Integration Complexity with Legacy Front-, Middle- and Back-Office Systems
Nearly 92% of UK institutions still rely on mainframes that batch-process trade files overnight, a cadence incompatible with second-by-second surveillance. Bridging message protocols, field taxonomies, and clock synchronisation requires multi-year roadmaps, often involving 50-plus internal teams. Disconnects cause incomplete data feeds and missed alerts, forcing parallel run periods where old and new platforms coexist until regulators certify data integrity.
Other drivers and restraints analyzed in the detailed report include:
- AI/ML-Powered Anomaly Detection Reducing False Positives and Cost
- Cloud-Native SaaS Delivery Lowering Total Cost of Ownership
- Shortage of Trade-Surveillance Data-Science Talent
For complete list of drivers and restraints, kindly check the Table Of Contents.
Segment Analysis
Solutions held 61.55% of the trade surveillance systems market share in 2025, underscoring the primacy of end-to-end platforms that integrate order, execution, and communications data. The segment benefits from high switching costs and continual rule updates, positioning vendors for recurring licensing revenue. The trade surveillance systems market size attached to solutions is projected to lift steadily as banks renew enterprise licences before key regulatory deadlines.
Services, though smaller, grow at 18% CAGR as institutions outsource model tuning and regulatory mapping. Managed-service contracts fill in-house talent gaps and provide 24-hour coverage across regions. Providers bundle implementation, behavioural-model calibration, and post-go-live testing, a package that mid-tier brokers consider more cost-effective than hiring specialised quants.
On-premise deployments retained a 54.15% share in 2025, reflecting data-sovereignty obligations and auditor preference for systems housed within firewalls. Yet the trade surveillance systems market size attributed to cloud offerings is set to rise fastest, expanding at 19.05% CAGR through 2031 as regulators issue clarifications that encrypted data may reside in approved jurisdictions.
Cloud providers offer elastic compute for back-testing millions of scenarios overnight, an ability that on-premise grids struggle to replicate without oversizing. Hybrid models gain traction because they keep personally identifiable information in local data centres while diverting de-identified trade records to cloud clusters for heavy analytics. Successful pilots in Singapore and Canada demonstrate that such architectures pass regulatory inspection when encryption keys remain client-controlled.
Complete Report Scope:
- By Component
- Solutions
- Services
- By Deployment Mode
- On-Premise
- Cloud
- By Trading Type
- Equities
- Fixed Income
- Derivatives
- Foreign Exchange
- Commodities
- Digital Assets
- By End-user
- Sell-Side Institutions
- Buy-Side Institutions
- Market Venues and Exchanges
- Regulators and SROs
- By Organisation Size
- Tier-1 Global Banks
- Tier-2 and Mid-Sized Firms
- Small FIs and Broker-Dealers
- FinTech and Crypto Exchanges
- By Geography
- North America
- United States
- Canada
- Mexico
- South America
- Brazil
- Argentina
- Chile
- Rest of South America
- Europe
- Germany
- United Kingdom
- France
- Italy
- Spain
- Russia
- Rest of Europe
- Asia-Pacific
- China
- India
- Japan
- South Korea
- Australia
- Singapore
- Malaysia
- Rest of Asia-Pacific
- Middle East and Africa
- Middle East
- United Arab Emirates
- Saudi Arabia
- Turkey
- Rest of Middle East
- Africa
- South Africa
- Nigeria
- Rest of Africa
- Middle East
- North America
Geography Analysis
Asia-Pacific records the fastest regional CAGR of 17.6%, moving from follower to front-runner in supervisory technology. Monetary Authority of Singapore pilots AI-based AML-CFT models that feed into trade-surveillance controls, creating reference implementations that other regulators monitor closely. Hong Kong mandates surveillance coverage for licensed virtual-asset operators, lifting spending among exchanges and prime brokers.
North America remains the largest contributor with a 33.92% share, driven by CAT and planned short-sale flags that take effect mid-2025. The United States benefits from vendor proximity to major equity and options venues, while Canada accelerates investment as cross-listing volumes climb.
Europe holds a mature adopter profile where MiFID II and EMIR already embed strict transaction reporting. Upcoming MiFIR 3 changes introduce digital-token identifiers that widen the regulatory perimeter. Continental banks upgrade systems to reconcile trade identifiers across business lines, and UK firms run parallel processes to manage post-Brexit divergence.
- NICE Ltd. (Actimize)
- Nasdaq Inc. (SMARTS)
- BAE Systems Digital Intelligence
- Fidelity National Information Services Inc. (FIS)
- Software AG
- Eventus Systems Inc.
- ACA Group
- TradingHub Group Ltd.
- eflow Ltd.
- B-next Group GmbH
- Solidus Labs Inc.
- Aquis Technologies Ltd.
- Trillium Management LLC
- SIA S.p.A.
- IBM Watson Financial RegTech
- S&P Global Market Intelligence (KYC/Surveillance)
- VoxSmart Ltd.
- OneMarketData LLC
- SteelEye Ltd.
- CranSoft (Scila AB)
- KX Systems (First Derivatives plc)
- ShieldFC Ltd.
- IPC Systems Inc. (Connexus)
- Trapets AB
- Corvil Analytics by Pico
- Digital Reasoning Systems Inc.
Additional Benefits:
- The market estimate (ME) sheet in Excel format
- 3 months of analyst support
TABLE OF CONTENTS
1 INTRODUCTION
- 1.1 Study Assumptions and Market Definition
- 1.2 Scope of the Study
2 RESEARCH METHODOLOGY
3 EXECUTIVE SUMMARY
4 MARKET LANDSCAPE
- 4.1 Market Overview
- 4.2 Market Drivers
- 4.2.1 Rapid expansion of global multi-asset electronic trading venues
- 4.2.2 Mandatory consolidated audit trail (CAT) and other post-trade transparency mandates
- 4.2.3 AI/ML-powered anomaly detection reduces false positives and compliance costs
- 4.2.4 Cloud-native SaaS delivery lowering total cost of ownership
- 4.2.5 Growing adoption of crypto and digital-asset trading by regulated institutions
- 4.2.6 Tokenisation of real-world assets creating new surveillance blind spots
- 4.3 Market Restraints
- 4.3.1 High integration complexity with legacy front-, middle- and back-office systems
- 4.3.2 Shortage of trade-surveillance data-science talent
- 4.3.3 Fragmented global rule sets leading to costly rule-mapping
- 4.3.4 Rising privacy regulations limiting holistic surveillance data pooling
- 4.4 Industry Value Chain Analysis
- 4.5 Regulatory Landscape
- 4.6 Technological Outlook
- 4.7 Industry Attractiveness - Porter's Five Forces Analysis
- 4.7.1 Bargaining Power of Suppliers
- 4.7.2 Bargaining Power of Buyers
- 4.7.3 Threat of New Entrants
- 4.7.4 Threat of Substitutes
- 4.7.5 Intensity of Competitive Rivalry
- 4.8 Impact of Macroeconomic Factors on the Market
5 MARKET SIZE AND GROWTH FORECASTS (VALUES)
- 5.1 By Component
- 5.1.1 Solutions
- 5.1.2 Services
- 5.2 By Deployment Mode
- 5.2.1 On-Premise
- 5.2.2 Cloud
- 5.3 By Trading Type
- 5.3.1 Equities
- 5.3.2 Fixed Income
- 5.3.3 Derivatives
- 5.3.4 Foreign Exchange
- 5.3.5 Commodities
- 5.3.6 Digital Assets
- 5.4 By End-user
- 5.4.1 Sell-Side Institutions
- 5.4.2 Buy-Side Institutions
- 5.4.3 Market Venues and Exchanges
- 5.4.4 Regulators and SROs
- 5.5 By Organisation Size
- 5.5.1 Tier-1 Global Banks
- 5.5.2 Tier-2 and Mid-Sized Firms
- 5.5.3 Small FIs and Broker-Dealers
- 5.5.4 FinTech and Crypto Exchanges
- 5.6 By Geography
- 5.6.1 North America
- 5.6.1.1 United States
- 5.6.1.2 Canada
- 5.6.1.3 Mexico
- 5.6.2 South America
- 5.6.2.1 Brazil
- 5.6.2.2 Argentina
- 5.6.2.3 Chile
- 5.6.2.4 Rest of South America
- 5.6.3 Europe
- 5.6.3.1 Germany
- 5.6.3.2 United Kingdom
- 5.6.3.3 France
- 5.6.3.4 Italy
- 5.6.3.5 Spain
- 5.6.3.6 Russia
- 5.6.3.7 Rest of Europe
- 5.6.4 Asia-Pacific
- 5.6.4.1 China
- 5.6.4.2 India
- 5.6.4.3 Japan
- 5.6.4.4 South Korea
- 5.6.4.5 Australia
- 5.6.4.6 Singapore
- 5.6.4.7 Malaysia
- 5.6.4.8 Rest of Asia-Pacific
- 5.6.5 Middle East and Africa
- 5.6.5.1 Middle East
- 5.6.5.1.1 United Arab Emirates
- 5.6.5.1.2 Saudi Arabia
- 5.6.5.1.3 Turkey
- 5.6.5.1.4 Rest of Middle East
- 5.6.5.2 Africa
- 5.6.5.2.1 South Africa
- 5.6.5.2.2 Nigeria
- 5.6.5.2.3 Rest of Africa
- 5.6.5.1 Middle East
- 5.6.1 North America
6 COMPETITIVE LANDSCAPE
- 6.1 Market Concentration
- 6.2 Strategic Moves
- 6.3 Market Share Analysis
- 6.4 Company Profiles (includes Global level Overview, Market level overview, Core Segments, Financials as available, Strategic Information, Market Rank/Share for key companies, Products and Services, and Recent Developments)
- 6.4.1 NICE Ltd. (Actimize)
- 6.4.2 Nasdaq Inc. (SMARTS)
- 6.4.3 BAE Systems Digital Intelligence
- 6.4.4 Fidelity National Information Services Inc. (FIS)
- 6.4.5 Software AG
- 6.4.6 Eventus Systems Inc.
- 6.4.7 ACA Group
- 6.4.8 TradingHub Group Ltd.
- 6.4.9 eflow Ltd.
- 6.4.10 B-next Group GmbH
- 6.4.11 Solidus Labs Inc.
- 6.4.12 Aquis Technologies Ltd.
- 6.4.13 Trillium Management LLC
- 6.4.14 SIA S.p.A.
- 6.4.15 IBM Watson Financial RegTech
- 6.4.16 S&P Global Market Intelligence (KYC/Surveillance)
- 6.4.17 VoxSmart Ltd.
- 6.4.18 OneMarketData LLC
- 6.4.19 SteelEye Ltd.
- 6.4.20 CranSoft (Scila AB)
- 6.4.21 KX Systems (First Derivatives plc)
- 6.4.22 ShieldFC Ltd.
- 6.4.23 IPC Systems Inc. (Connexus)
- 6.4.24 Trapets AB
- 6.4.25 Corvil Analytics by Pico
- 6.4.26 Digital Reasoning Systems Inc.
7 MARKET OPPORTUNITIES AND FUTURE TRENDS
- 7.1 White-Space and Unmet-Need Assessment

 交易監控系統市場:按組件、組織規模、資產類別、部署類型和最終用戶分類-2026-2032年全球市場預測
 交易監控和金融犯罪監控市場預測至2034年——全球技術、部署模式、金融犯罪類型、資產類別、應用、最終用戶和區域分析
 2026-2030年全球貿易監控系統市場
 貿易監控系統市場報告:按組件、部署類型、企業規模、最終用戶和地區分類(2026-2034 年)
 交易監控市場:按組件、產業和地區分類
 2026年全球交易監控系統市場報告
 全球貿易監測市場規模、佔有率、趨勢和成長分析報告(2026-2034)
 全球交易監控系統市場(按應用程式和最終用戶分類)—預測至 2030 年
 交易監測系統的全球市場:2025-2029年
 交易監控市場規模、佔有率、趨勢分析報告:按組件、部署、地區、細分市場預測,2025 年至 2030 年