


 |
市場調查報告書
商品編碼
2123378
B2B工業穿戴裝置:市佔率分析、產業趨勢與統計及成長預測(2026-2031年)B2B Enterprise And Industrial Wearables - Market Share Analysis, Industry Trends & Statistics, Growth Forecasts (2026 - 2031) |
||||||

※ 本網頁內容可能與最新版本有所差異。詳細情況請與我們聯繫。
據 Mordor Intelligence 稱,2025 年 B2B 企業和工業穿戴式裝置市場價值為 204.4 億美元,預計到 2031 年將從 2026 年的 260.5 億美元成長至 875.6 億美元,預測期(2026-2031 年)的複合年成長率為 27.45%。
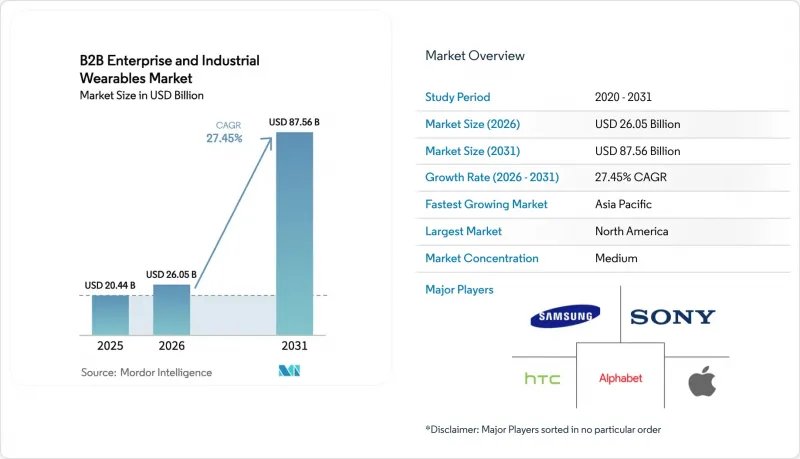
本報告按設備類型(頭戴式顯示器、腕戴式設備、智慧眼鏡等)、終端用戶產業(IT與電信、醫療保健等)、組件(感測器、顯示器與光學元件等)、應用(遠端援助與工作流程指導等)、連接技術(藍牙/BLE等)以及地區進行細分。市場預測以美元(USD)為單位。
全球B2B企業及工業穿戴設備市場趨勢與洞察
不斷擴展的應用生態系統正在推動企業採用這些應用。
企業評估穿戴式裝置時,不再只專注於顯示解析度或電池續航力,而是更重視軟體堆疊與現有ERP、MES和CMMS工作流程的整合度。 PTC的Vuforia Studio現在標配200多個模組化AR工作流程,無需編寫自訂程式碼即可部署,將試點階段從數月縮短至數週。西門子的工業邊緣運算市場將類似的即插即用邏輯擴展到製造執行環境,使工廠能夠在平行生產線上運行相同的工作流程,同時最大限度地減少IT投資。波音公司透過實施AR指導,將線束組裝時間縮短了25%,並將錯誤率降低了90%。這使得財務部門在為所有機器的部署提供資金之前,能夠清楚地了解所需的投資報酬率。這種從客製化開發到API優先模組的轉變,降低了切換成本,加快了用戶採用速度,並將市場從單純的研發興趣轉變為正式的資本預算項目。
對建設智慧工廠的需求
中國的「中國製造2025」計畫和印度的生產連結獎勵計畫計畫等國家級項目,正投入數十億美元用於自動化生產線,這些生產線依賴佩戴智慧型裝置的技師進行異常處理和品質檢驗。寶馬雷根斯堡物流團隊報告稱,引入智慧眼鏡後,揀貨錯誤率降低了15%;博世則將來自穿戴式感測器的資料流導入其ConnectedWorld物聯網平台,以觸發預測性維護工單。這些應用案例印證了穿戴式裝置將在工業4.0中作為人機介面發揮作用的觀點,它將實體資產與數位孿生體連接起來,並在工廠管理者實施流程變更之前進行模擬。隨著工廠向數據工廠轉型,對頭戴式顯示器、智慧手套和生物識別背心的需求也隨之成長。
缺乏企業級應用程式
許多擴增實境(AR)和工作流程指導套件仍處於試點階段,缺乏必要的功能,例如ISO 9001審計追蹤、基於角色的存取控制或FDA 510(k)檢驗,而這些功能是遠端檢測生命徵象所必需的。醫院往往被迫依賴不符合電子健康記錄(EHR)互通性要求的消費級穿戴設備,導致臨床人員必須手動核對數據。 Android、專有即時作業系統(RTOS)和iOS等平台之間的碎片化迫使IT部門並行維護多個程式碼庫,從而增加了維護成本。歐盟職業安全與健康管理局(EU-OSHA)警告稱,不透明的資料流會增加社會心理風險,這對工人委員會來說是一個警告訊號。在軟體達到企業管治標準之前,部署進度將落後於硬體準備。
細分市場分析
預計到2025年,智慧眼鏡將佔銷售額的31.02%,反映出其在免持偵測和遠端專家工作流程方面的成熟度。 RealWear和Vuzix的產品符合IP67防水防塵標準,並將語音控制與高亮度微型OLED光學元件結合,使汽車生產線工人無需摘下手套即可查看手冊。隨著下一代光學技術帶來更輕的外形規格和更廣闊的視野,智慧眼鏡市場預計將穩定成長。同時,智慧服裝和人體感測器預計將以28.74%的複合年成長率成長,這反映了即時監測熱壓力和有害氣體暴露的監管趨勢。霍尼韋爾的生物識別安全背心整合了PPG(脈搏波測量)、加速計和二氧化碳感測器,無需增加笨重的裝置即可滿足美國職業安全與健康管理局(OSHA)的中暑預防指南,將紡織品整合式穿戴裝置定位為本世紀的突破性外形規格。
隨著其應用範圍的擴大,如今已涵蓋用於發送雙因素認證和通知PIN碼的腕戴設備、用於密閉空間虛擬實境訓練的頭戴式顯示器(HMD,用於救援訓練)以及執法機關用於證據收集的穿戴式式攝影機。索尼的4K 1吋microOLED顯示器使得眼鏡可以擁有類似處方箋鏡框的外觀,卻能提供工業級的亮度,從而克服了曾經圍繞頭戴式電腦的社會偏見。扁平光學元件和波導管的專利有望進一步減輕重量,確保長時間佩戴的舒適性,並加速維護工作中對加固型平板電腦的替代品。
到2025年,製造業將佔總支出的27.95%,主要驅動力是預測性維護和組裝指導。這一市場佔有率的取得歸因於高昂的人事費用和嚴格的百萬分之缺陷率目標,這些因素促使企業投資自動化。寶馬和博世的案例表明,減少返工能夠帶來即時的投資回報,甚至在考慮減少安全事故之前也是如此。醫療保健產業是成長最快的產業,複合年成長率高達29.86%,這得益於美國醫療保險和醫療補助服務中心(CMS)對遠端患者監護報銷代碼的認證以及美國食品藥品監督管理局(FDA)對臨床生物感測器的批准。持續遙測技術將縮短住院時間,並使醫療服務提供者能夠在基於價值的合約中轉移風險。
IT和電信業的現場工作人員正在使用擴增實境(AR)疊加技術來減少現場維修次數並最大限度地降低初始故障率。同時,零售倉庫正在引入手套掃描儀,以將揀貨週期縮短幾秒鐘。運輸公司正在為其車隊分發智慧型手錶,這些手錶還可用作駕駛員的安全監測器,收集遠端資訊處理數據以及心率變異性數據,以預測疲勞程度。公共產業和石油燃氣公司正在為檢查員配備ATEX認證的智慧眼鏡,以語音記錄的檢查日誌取代紙本記錄。
區域分析
預計到2025年,北美市場將佔全球銷售額的39.65%。嚴格的美國航太、汽車和石油巨頭正持續將穿戴式科技融入其數位藍圖,推動市場朝著既定的年度預算目標邁進。在加拿大,堅固耐用的智慧眼鏡正被用於偏遠的礦區和林區,為需要在無電網環境下進行診斷的通勤工人提供輔助設備。在墨西哥,穿戴式裝置正部署在加工廠,以滿足北美原始設備製造商(OEM)的零缺陷要求。
預計到2031年,亞太地區的年複合成長率將達到30.90%。北京的「中國製造2025」計畫正在資助長三角Delta的自動化工廠,並將穿戴式裝置的數據整合到即時製造執行系統(MES)儀表板中。印度的生產連結獎勵計畫(PLI)正在資助製藥和汽車行業的智慧穿戴試點項目,以解決勞動力技能缺口問題。在日本的「社會5.0」計畫中,穿戴式裝置被定位為老化勞動力與機器人同事之間的互動介面,智慧外骨骼和生物識別袖套有助於減輕肌肉骨骼壓力。韓國的半導體製造廠正在使用支援超寬頻(UWB)技術的徽章來加強無塵室區域分類,而澳洲的礦業公司則正在使用疲勞感應背心來降低事故風險。
在歐洲,我們看到強勁且受監管支持的成長。德國正利用工業4.0補助和CE認證的專業知識,出口穿戴式裝置承包生產線。隨著GDPR強制要求本地推理,邊緣人工智慧晶片製造商正受到越來越多的關注。在法國和義大利,由於工人委員會正在討論監控光學設備,智慧眼鏡的普及速度有所放緩,但都靈和摩德納的汽車產業叢集正在試行使用智慧眼鏡進行扭力扳手校準。在英國,隨著脫歐後標準的分歧,合規性變得更加複雜,但也為創新供應商提供了快速進入市場的途徑。在其他地區,中東正在投資大型大型企劃,包括在建築工地強制佩戴穿戴式安全設備;而在南美洲,巴西的露天礦場正在試驗使用邊緣人工智慧穿戴式設備。
其他好處:
- Excel格式的市場預測(ME)表
- 3個月的分析師支持
目錄
第1章:引言
- 研究假設和市場定義
- 調查範圍
第2章:調查方法
第3章執行摘要
第4章 市場狀況
- 市場概覽
- 市場促進因素
- 不斷擴展的應用生態系統正在推動企業採用這些應用。
- 引進智慧工廠的需求
- 5G獨立組網和專用網路的快速普及
- 邊緣AI晶片可降低延遲和功耗。
- 為確保工人安全而採取的監管措施
- 數位孿生技術在重工業的應用
- 市場限制因素
- 企業應用短缺
- 與資料安全和遺留IT整合相關的挑戰
- 初始總擁有成本高,投資報酬率不確定性
- 人們對工人的隱私以及穿著這種服裝造成的疲勞表示擔憂。
- 產業價值鏈分析
- 監理情勢
- 技術展望
- 宏觀經濟因素對市場的影響
- 波特五力分析
第5章 市場規模與成長預測
- 依設備類型
- HMD
- 腕錶
- 智慧眼鏡
- 智慧服裝和人體感應器
- 穿戴式相機
- 其他
- 按最終用戶行業分類
- 資訊科技/通訊
- 衛生保健
- 零售與電子商務
- 保險和金融服務
- 製造業
- 運輸/物流
- 其他
- 按組件
- 感應器
- 顯示器和光學裝置
- 處理器和記憶體
- 連接模組
- 電源和電池
- 軟體和服務
- 透過使用
- 遠距援助工作流程指南
- 工人安全與健康監測
- 訓練模擬
- 預測性保護
- 庫存和資產管理
- 品質檢驗和文件記錄
- 透過連接技術
- Bluetooth/BLE
- Wi-Fi/Wi-Fi 6/6E
- 4G LTE/LTE-M/NB-IoT
- 5G 和 5G RedCap
- 超寬頻和短程射頻
- 按地區
- 北美洲
- 美國
- 加拿大
- 墨西哥
- 南美洲
- 巴西
- 阿根廷
- 其他南美國家
- 歐洲
- 德國
- 英國
- 法國
- 義大利
- 西班牙
- 其他歐洲國家
- 亞太地區
- 中國
- 日本
- 印度
- 韓國
- 澳洲
- 其他亞太國家
- 中東和非洲
- 中東
- 沙烏地阿拉伯
- 阿拉伯聯合大公國
- 土耳其
- 其他中東國家
- 非洲
- 南非
- 埃及
- 奈及利亞
- 其他非洲國家
- 中東
- 北美洲
第6章 競爭情勢
- 市場集中度
- 策略趨勢
- 市佔率分析
- 公司簡介
- Meta Platforms Inc.(Oculus VR LLC)
- Alphabet Inc.
- Samsung Electronics Co. Ltd.
- Sony Group Corporation
- HTC Corporation
- Apple Inc.
- Fitbit LLC(Google LLC)
- Xiaomi Corp.
- Seiko Epson Corporation
- Microsoft Corporation
- Texas Instruments Incorporated
- Toshiba Corporation
- Honeywell International Inc.
- RealWear Inc.
- Zebra Technologies Corporation
- Vuzix Corporation
- ProGlove GmbH
- Qualcomm Incorporated
- Panasonic Holdings Corporation
- Kopin Corporation
第7章 市場機會與未來展望
According to Mordor Intelligence, the B2B enterprise and industrial wearables market size was valued at USD 20.44 billion in 2025 and estimated to grow from USD 26.05 billion in 2026 to reach USD 87.56 billion by 2031, at a CAGR of 27.45% during the forecast period (2026-2031).
This report is Segmented by Device Type (HMDs, Wrist Wears, Smart Glass, and More), End-User Industry (IT and Telecom, Healthcare, and More), Component (Sensors, Displays and Optics, and More), Application (Remote Assistance and Workflow Guidance, and More), Connectivity Technology (Bluetooth/BLE, and More), and Geography. The Market Forecasts are Provided in Terms of Value (USD).
Global B2B Enterprise And Industrial Wearables Market Trends and Insights
Growing App Ecosystem Fuels Enterprise Adoption
Enterprises increasingly judge wearables by how well the software stack integrates with existing ERP, MES, and CMMS workflows, rather than by display resolution or battery longevity. PTC's Vuforia Studio now ships with over 200 modular AR workflows that can be deployed without custom code, shrinking pilot phases from months to weeks. Siemens' Industrial Edge Marketplace extends similar plug-and-play logic to manufacturing execution environments, allowing plants to run the same workflow in parallel lines with minimal IT investment. At Boeing, AR guidance reduced wiring-harness assembly time by 25% and errors by 90%, providing the ROI clarity that finance groups require before funding fleetwide rollouts. This pivot from bespoke development to API-first modules lowers switching costs, accelerates user onboarding, and solidifies the B2B enterprise and industrial wearables market as a line item in formal capital budgets, rather than an R&D curiosity.
Demand for Smart Factory Set-Ups
National programs such as China's Made in China 2025 and India's Production-Linked Incentive schemes earmark billions for automated production lines that rely on wearable-equipped technicians for exception handling and quality inspection. BMW's Regensburg logistics team reported a 15% reduction in picking errors after smart-glass deployment, while Bosch feeds wearable sensor streams into its ConnectedWorld IoT platform to trigger predictive maintenance work orders. These use cases validate the thesis that wearables serve as the human-machine interface of Industry 4.0, linking physical assets to digital twins that simulate process changes before plant managers pull the trigger. As factories become data factories, demand for head-mounted displays, smart gloves, and biometric vests scales in lockstep.
Lack of Business-Grade Applications
Many AR and workflow guidance suites remain pilot-grade, lacking essential features such as ISO 9001 audit trails, role-based access controls, or FDA 510(k) validations required for continuous vital-sign telemetry. Hospitals are often forced to rely on consumer-grade wearables that do not meet EHR interoperability requirements, leaving clinical staff to manually reconcile data. Fragmentation across Android, proprietary RTOS, and iOS platforms obliges IT to maintain parallel code bases, inflating ownership costs. EU-OSHA has warned that opaque data flows heighten psychosocial risks, a red flag for worker councils. Until software catches up with enterprise governance standards, adoption will lag hardware readiness.
Other drivers and restraints analyzed in the detailed report include:
- Rapid Gains in 5G Stand-Alone and Private Networks
- Edge AI Chips Reduce Latency and Power Budget
- Data Security and Legacy IT Integration Issues
For complete list of drivers and restraints, kindly check the Table Of Contents.
Segment Analysis
Smart glass delivered 31.02% of 2025 revenue, underscoring its maturity in hands-free inspection and remote expert workflows. RealWear and Vuzix units meet IP67 ingress ratings and pair voice control with high-brightness micro-OLED optics, letting automotive line workers navigate manuals without removing gloves. The B2B enterprise and industrial wearables market size for smart glass is projected to expand at a healthy clip as next-generation optics lighten form factors and extend field of view. Yet, smart clothing and body sensors are poised for a 28.74% CAGR, reflecting regulatory moves to monitor heat stress and hazardous gas exposure in real-time. Honeywell's biometric safety vest, which embeds PPG, accelerometer, and CO2 sensors, fulfills OSHA heat illness prevention guidance without adding bulky gear, positioning textile-integrated wearables as the breakout form factor of the decade.
The widening adoption spectrum now includes wrist wear for two-factor authentication and notification pings, HMDs for VR training in confined-space rescue, and wearable cameras for capturing law enforcement evidence. Sony's 4K, 1-inch micro-OLED display enables glasses that resemble prescription frames yet deliver industrial brightness, erasing the cultural stigma once associated with head-mounted computers. Pancake optics and waveguide patents promise further weight reductions, translating to full-shift comfort and accelerating replacement of rugged tablets in maintenance work orders.
Manufacturing accounted for 27.95% of the 2025 spend, primarily driven by predictive maintenance and assembly guidance. The B2B enterprise and industrial wearables market share for the sector stems from high labor costs and strict defect-per-million targets that justify automation outlays. BMW and Bosch demonstrate that reducing rework yields immediate payback, even before accounting for fewer safety incidents. Healthcare is the fastest-growing sector, with a 29.86% CAGR, as the Centers for Medicare and Medicaid Services reimburse remote patient monitoring codes and the FDA clears clinical-grade biosensors. Continuous telemetry reduces hospital stays, allowing providers to shift risk in value-based contracts.
IT and telecom field crews utilize AR overlays to reduce truck rolls and first-time-fix errors, while retail warehouses deploy glove scanners to shave seconds off of pick cycles. Transportation fleets issue smart watches that double as driver safety monitors, collecting heart-rate variability alongside telematics to predict fatigue. Utilities and oil and gas firms equip inspectors with ATEX-certified smart glasses, replacing paper logs with voice-captured inspection records.
Complete Report Scope:
- By Device Type
- HMDs
- Wrist Wears
- Smart Glass
- Smart Clothing and Body Sensors
- Wearable Cameras
- Other Device Types
- By End-User Industry
- IT and Telecom
- Healthcare
- Retail and E-Commerce
- Insurance and Financial Services
- Manufacturing
- Transportation and Logistics
- Other End-User Industries
- By Component
- Sensors
- Displays and Optics
- Processors and Memory
- Connectivity Modules
- Power and Battery
- Software and Services
- By Application
- Remote Assistance and Workflow Guidance
- Worker Safety and Health Monitoring
- Training and Simulation
- Predictive Maintenance
- Inventory and Asset Management
- Quality Inspection and Documentation
- By Connectivity Technology
- Bluetooth / BLE
- Wi-Fi / Wi-Fi 6 / 6E
- 4G LTE / LTE-M / NB-IoT
- 5G and 5G RedCap
- UWB and Short-Range RF
- By Geography
- North America
- United States
- Canada
- Mexico
- South America
- Brazil
- Argentina
- Rest of South America
- Europe
- Germany
- United Kingdom
- France
- Italy
- Spain
- Rest of Europe
- Asia-Pacific
- China
- Japan
- India
- South Korea
- Australia
- Rest of Asia-Pacific
- Middle East and Africa
- Middle East
- Saudi Arabia
- United Arab Emirates
- Turkey
- Rest of Middle East
- Africa
- South Africa
- Egypt
- Nigeria
- Rest of Africa
- Middle East
- North America
Geography Analysis
North America generated 39.65% of 2025 revenue. Stringent OSHA standards and early adoption of AR by logistics behemoths laid the groundwork for widespread uptake. U.S. aerospace, automotive, and oil majors continue to layer wearables on top of digital-twin roadmaps, driving the B2B enterprise and industrial wearables market toward established annual budgets. Canada utilizes rugged smart glass in remote mining and forestry operations, where fly-in-fly-out crews require off-grid diagnostics. Mexico's maquiladora plants adopt wearables to satisfy zero-defect mandates from North American OEMs.
Asia-Pacific is poised for a 30.90% CAGR through 2031. Beijing's Made in China 2025 agenda finances automated factories in the Yangtze River Delta, embedding wearable feeds into real-time MES dashboards. India's Production-Linked Incentive outlays fund smart clothing pilots for the pharmaceutical and automotive sectors, addressing labor-skill gaps. Japan's Society 5.0 vision positions wearables as the interface between an aging workforce and robotic co-workers, with smart exoskeletons and biometric sleeves helping to ease musculoskeletal strain. South Korea's semiconductor fabs deploy UWB-enabled badges to enforce cleanroom zoning, while Australia's mines adopt fatigue-detection vests to mitigate accident risks.
Europe shows robust yet regulated growth. Germany leverages Industrie 4.0 subsidies and CE-marking expertise to export turnkey wearable-enabled production lines. GDPR compels on-premises inference, putting the spotlight on edge AI chipmakers. France and Italy face slower roll-outs as worker councils debate surveillance optics, though automotive clusters in Turin and Modena pilot smart glasses for torque-wrench calibration. The United Kingdom's divergent post-Brexit standards add compliance complexity but also open fast-track routes for innovative suppliers. Elsewhere, the Middle East invests in smart-city megaprojects that include wearable safety mandates on construction sites, while South America pilots edge-AI-enabled wearables in Brazil's open-pit mines.
- Meta Platforms Inc. (Oculus VR LLC)
- Alphabet Inc.
- Samsung Electronics Co. Ltd.
- Sony Group Corporation
- HTC Corporation
- Apple Inc.
- Fitbit LLC (Google LLC)
- Xiaomi Corp.
- Seiko Epson Corporation
- Microsoft Corporation
- Texas Instruments Incorporated
- Toshiba Corporation
- Honeywell International Inc.
- RealWear Inc.
- Zebra Technologies Corporation
- Vuzix Corporation
- ProGlove GmbH
- Qualcomm Incorporated
- Panasonic Holdings Corporation
- Kopin Corporation
Additional Benefits:
- The market estimate (ME) sheet in Excel format
- 3 months of analyst support
TABLE OF CONTENTS
1 INTRODUCTION
- 1.1 Study Assumptions and Market Definition
- 1.2 Scope of the Study
2 RESEARCH METHODOLOGY
3 EXECUTIVE SUMMARY
4 MARKET LANDSCAPE
- 4.1 Market Overview
- 4.2 Market Drivers
- 4.2.1 Growing App Ecosystem Fuels Enterprise Adoption
- 4.2.2 Demand for Smart Factory Set-Ups
- 4.2.3 Rapid Gains in 5G Stand-Alone and Private Networks
- 4.2.4 Edge AI Chips Reduce Latency and Power Budget
- 4.2.5 Regulatory Push for Workforce Safety Compliance
- 4.2.6 Mainstreaming of Digital Twins in Heavy Industry
- 4.3 Market Restraints
- 4.3.1 Lack of Business-Grade Applications
- 4.3.2 Data Security and Legacy IT Integration Issues
- 4.3.3 High Up-Front TCO and Uncertain ROI
- 4.3.4 Worker Privacy and Wear Fatigue Concerns
- 4.4 Industry Value Chain Analysis
- 4.5 Regulatory Landscape
- 4.6 Technological Outlook
- 4.7 Impact of Macroeconomic Factors on the Market
- 4.8 Porter's Five Forces Analysis
- 4.8.1 Threat of New Entrants
- 4.8.2 Bargaining Power of Buyers
- 4.8.3 Bargaining Power of Suppliers
- 4.8.4 Threat of Substitute Products
- 4.8.5 Intensity of Competitive Rivalry
5 MARKET SIZE AND GROWTH FORECASTS (VALUE)
- 5.1 By Device Type
- 5.1.1 HMDs
- 5.1.2 Wrist Wears
- 5.1.3 Smart Glass
- 5.1.4 Smart Clothing and Body Sensors
- 5.1.5 Wearable Cameras
- 5.1.6 Other Device Types
- 5.2 By End-User Industry
- 5.2.1 IT and Telecom
- 5.2.2 Healthcare
- 5.2.3 Retail and E-Commerce
- 5.2.4 Insurance and Financial Services
- 5.2.5 Manufacturing
- 5.2.6 Transportation and Logistics
- 5.2.7 Other End-User Industries
- 5.3 By Component
- 5.3.1 Sensors
- 5.3.2 Displays and Optics
- 5.3.3 Processors and Memory
- 5.3.4 Connectivity Modules
- 5.3.5 Power and Battery
- 5.3.6 Software and Services
- 5.4 By Application
- 5.4.1 Remote Assistance and Workflow Guidance
- 5.4.2 Worker Safety and Health Monitoring
- 5.4.3 Training and Simulation
- 5.4.4 Predictive Maintenance
- 5.4.5 Inventory and Asset Management
- 5.4.6 Quality Inspection and Documentation
- 5.5 By Connectivity Technology
- 5.5.1 Bluetooth / BLE
- 5.5.2 Wi-Fi / Wi-Fi 6 / 6E
- 5.5.3 4G LTE / LTE-M / NB-IoT
- 5.5.4 5G and 5G RedCap
- 5.5.5 UWB and Short-Range RF
- 5.6 By Geography
- 5.6.1 North America
- 5.6.1.1 United States
- 5.6.1.2 Canada
- 5.6.1.3 Mexico
- 5.6.2 South America
- 5.6.2.1 Brazil
- 5.6.2.2 Argentina
- 5.6.2.3 Rest of South America
- 5.6.3 Europe
- 5.6.3.1 Germany
- 5.6.3.2 United Kingdom
- 5.6.3.3 France
- 5.6.3.4 Italy
- 5.6.3.5 Spain
- 5.6.3.6 Rest of Europe
- 5.6.4 Asia-Pacific
- 5.6.4.1 China
- 5.6.4.2 Japan
- 5.6.4.3 India
- 5.6.4.4 South Korea
- 5.6.4.5 Australia
- 5.6.4.6 Rest of Asia-Pacific
- 5.6.5 Middle East and Africa
- 5.6.5.1 Middle East
- 5.6.5.1.1 Saudi Arabia
- 5.6.5.1.2 United Arab Emirates
- 5.6.5.1.3 Turkey
- 5.6.5.1.4 Rest of Middle East
- 5.6.5.2 Africa
- 5.6.5.2.1 South Africa
- 5.6.5.2.2 Egypt
- 5.6.5.2.3 Nigeria
- 5.6.5.2.4 Rest of Africa
- 5.6.5.1 Middle East
- 5.6.1 North America
6 COMPETITIVE LANDSCAPE
- 6.1 Market Concentration
- 6.2 Strategic Moves
- 6.3 Market Share Analysis
- 6.4 Company Profiles (includes Global Level Overview, Market Level Overview, Core Segments, Financials as Available, Strategic Information, Market Rank/Share for Key Companies, Products and Services, and Recent Developments)
- 6.4.1 Meta Platforms Inc. (Oculus VR LLC)
- 6.4.2 Alphabet Inc.
- 6.4.3 Samsung Electronics Co. Ltd.
- 6.4.4 Sony Group Corporation
- 6.4.5 HTC Corporation
- 6.4.6 Apple Inc.
- 6.4.7 Fitbit LLC (Google LLC)
- 6.4.8 Xiaomi Corp.
- 6.4.9 Seiko Epson Corporation
- 6.4.10 Microsoft Corporation
- 6.4.11 Texas Instruments Incorporated
- 6.4.12 Toshiba Corporation
- 6.4.13 Honeywell International Inc.
- 6.4.14 RealWear Inc.
- 6.4.15 Zebra Technologies Corporation
- 6.4.16 Vuzix Corporation
- 6.4.17 ProGlove GmbH
- 6.4.18 Qualcomm Incorporated
- 6.4.19 Panasonic Holdings Corporation
- 6.4.20 Kopin Corporation
7 MARKET OPPORTUNITIES AND FUTURE OUTLOOK
- 7.1 White-Space and Unmet-Need Assessment

 神經多樣性雇主的支援平台市場預測至2034年:按平台類型、交付方式、經營模式、最終用戶和地區分類的全球分析
 企業穿戴式裝置市場規模、佔有率和成長分析:按設備類型、應用、技術、最終用戶和地區分類-2026-2033年產業預測
 2026-2030年全球物聯網(IoT)工業穿戴裝置市場
 企業穿戴式裝置市場報告:按產品類型、技術、最終用戶和地區分類(2026-2034 年)
 2026年全球工業無線自動化市場報告
 全球工業穿戴裝置市場規模、佔有率、趨勢和成長分析報告(2026-2034年)全球工業無線自動化市場規模(按類型、應用、區域範圍和預測)
 全球企業穿戴式裝置市場
 工業無線自動化市場(2025-2029)