


 |
市場調查報告書
商品編碼
2123361
LED磷光體:市場佔有率分析、產業趨勢與統計、成長預測(2026-2031)LED Phosphors - Market Share Analysis, Industry Trends & Statistics, Growth Forecasts (2026 - 2031) |
||||||

※ 本網頁內容可能與最新版本有所差異。詳細情況請與我們聯繫。
根據 Mordor Intelligence 預測,LED磷光體市場預計將從 2025 年的 5.2 億美元成長到 2026 年的 6.1 億美元,到 2031 年達到 10.2 億美元,在預測期(2026-2031 年)內,預計複合年成長率為 10.83%。
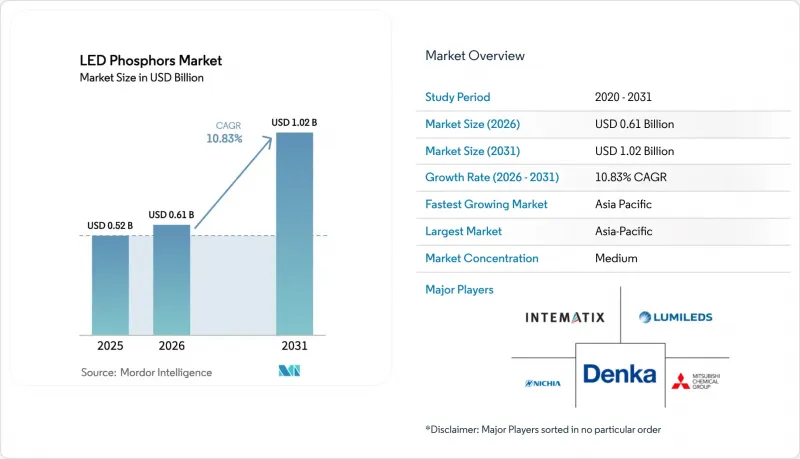
本報告按磷光體材料(氮化物基、矽酸鹽基等)、發光顏色(日光白、白熾燈等)、應用領域(智慧型手機、液晶電視、筆記型電腦和平板電腦、汽車照明等)、終端用戶產業(消費性電子產品OEM廠商、汽車OEM廠商、顯示面板製造商等)和地區進行細分。市場預測以美元計價。
全球LED磷光體市場趨勢與洞察
智慧照明在全球的應用正在迅速成長。
該市將高壓鈉燈升級為聯網LED陣列,推動了對能夠實現2700K至6500K相關色溫,並支援調光至暖光控制演算法的多磷光體混合物的訂單成長。預計光是北美城市到2024年就將安裝超過850萬個智慧路燈節點,年增34%。類似的措施正在歐洲和亞太地區擴展。這些項目推動了對低熱漂移和窄色溫容差磷光體的需求,這些特性現在已被納入大多數公共競標規範。智慧建築維修進一步推動了需求,預計到2030年,智慧照明控制將使全球照明電力消耗量降低19%。隨著紫外線(UV)消毒模組成為醫療保健和飯店照明設備的標配,紫外線相容磷光體的庫存正在收緊,這進一步鞏固了利基供應商的有利價格趨勢。
政府針對固體照明的能源效率法規
自2024年起,美國、歐洲和中國採用的標準對發光效率提出了更高的要求,而這只有透過高效能磷光體系統才能實現。美國商用照明燈具的最低標準將於2025年1月提高至150 lm/W,這將迫使原始設備製造商(OEM)轉向使用YAG、Ce和氮化物基紅色混合螢光粉,以最大程度地減少斯托克斯損耗。歐洲修訂後的生態設計法規增加了顏色品質指標,有效地淘汰了低顯色指數(CRI)的磷光體混合物。同時,在中國,與180 lm/W閾值掛鉤的補貼正在加速對窄頻綠色和紅色發光體的需求。這些法規共同作用,正在縮小低性能化學成分的市場佔有率,並加速LED磷光體市場向更高品質配方的轉變。
稀土元素氧化物的供應與價格波動
2024年,中國供應了全球70%的稀土元素產量和超過90%的精煉稀土,這種集中度導致出口配額制度在2025年初推高了氧化銪現貨價格22%。亞洲以外的磷光體生產商被迫承擔飆升的原料成本,導致利潤率下降或被迫轉向顯色指數(CRI)較低的配方。澳洲和美國的新精煉計畫預計將於2026年底全面運作,但它們的總合將不足以滿足預期需求的8%,這使得LED磷光體市場極易受到地緣政治衝擊的影響。
細分市場分析
預計到2025年,氮化物基材料將佔據LED磷光體市場40.32%的佔有率,並將以11.01%的複合年成長率持續成長至2031年。氮化物基LED磷光體混合物的市場規模正在擴大,這主要得益於對自我調整遠光燈和高階室內照明燈具的需求,這些應用即使在結溫超過度C的情況下也需要嚴格的波長穩定性。石榴石型YAG Ce螢光粉憑藉其成熟的高良率工藝和超過85%的量子效率,在對成本高度敏感的燈具領域繼續保持著主導地位。
製程創新,例如降低顆粒尺寸分佈和整合晶片上磷光體沉積技術,使得亮度更高、厚度更薄的迷你LED構裝成為可能,從而拓展了其應用範圍。 2024年在歐洲生效的RoHS鎘禁令迫使原始設備製造商(OEM)放棄傳統的矽酸鹽基紅色磷光體,轉而使用不含鎘的氮化物基替代品,儘管成本更高,但這進一步鞏固了氮化物基磷光體在跨境產品線中的優勢。
預計到2025年,白熾燈混合光源將佔總出貨量的36.81%,反映出其在住宅和辦公室照明領域的廣泛應用。然而,受控環境農業和醫療照光治療需求的推動,紅色磷光體預計將以11.92%的複合年成長率成長。在這些領域,需要600奈米至700奈米的窄頻發射以增強生物效應。因此,與紅色產品相關的LED磷光體市場規模預計將比其他任何顏色細分市場成長更快。
2020年至2024年間,室內農場的占地面積增加了28%,這些農場正朝著使用頻譜最佳化照明設備的方向發展,以提高每瓦光合有效輻射(光合有效輻射)密度。以人為本的照明透過使用可調節的白光光源來模擬陽光的節奏,這些光源結合了冷暖色調並增強了紅色亮度。在2700K至6500K色溫範圍內,顯色指數(CRI)達到95或更高的產品如今已具備商業性可行性,凸顯了特种红色LED供應商的盈利潛力。
區域分析
預計到2025年,亞太地區將佔全球銷售額的51.07%,複合年成長率達13.09%,進一步鞏固其作為LED和顯示器製造中心的地位。成本優勢源自於稀土元素提純和磷光體合成可在同一地點完成,中國生產商採購氧化銪的價格為每公斤340美元,而北美進口商的價格為每公斤465美元。隨著LG Display和三星顯示器擴大mini-LED背光產能,預計到2028年,韓國LED磷光體市場規模將翻倍,進而滿足新增需求。
憑藉多年累積的材料科學深厚專業知識,日本向汽車和高階照明等細分市場供應超窄頻氮化物基紅光發光裝置,從而獲得溢價,但供應有限。在北美和歐洲,受逐步淘汰光效低於150流明/瓦照明燈具的法規推動,銷量成長緩慢,但產品組合正朝著高附加價值方向發展。這兩個地區都在推廣回收以降低供應風險,歐洲的《關鍵材料法案》旨在2030年從廢棄燈具中回收25%的稀土元素。
在中東和非洲等新興市場以及南美部分地區,由於大規模的路燈和基礎設施維修,LED 的供應量正在逐漸增加。阿拉伯聯合大公國(阿拉伯聯合大公國)計劃在 2025 年完成 120 萬盞路燈的 LED 改造,屆時市政能源消耗將減少 42%。進口關稅和物流複雜性仍然阻礙 LED 在拉丁美洲的普及,但巴西和阿根廷的獎勵計劃正在縮小價格差距。
其他好處:
- Excel格式的市場預測(ME)表
- 3個月的分析師支持
目錄
第1章:引言
- 研究假設和市場定義
- 調查範圍
第2章:調查方法
第3章執行摘要
第4章 市場狀況
- 市場概覽
- 市場促進因素
- 智慧照明在全球的應用正在迅速成長。
- 政府對固體照明的能源效率要求
- 高流明LED構裝成本快速降低
- 擴大亞洲顯示面板產能
- OEM廠商對晝夜節律可調磷光體混合物的需求
- 關注用於LED的量子點和磷光體的混合解決方案
- 市場限制因素
- 稀土元素氧化物供應和價格的波動
- 高臨界窄頻紅色磷光體高成本
- 高驅動電流下熱快速冷卻性能的局限性
- 由於 RoHS 指令的嚴格規定,一些較老的磷光體成分受到限制。
- 產業價值鏈分析
- 監理情勢
- 波特五力分析
第5章 市場規模與成長預測
- 磷光體材料
- 氮化物體系
- 石榴石(YAG:Ce)
- 矽酸鹽
- 鋁酸鹽型
- 其他
- 按發射顏色
- 日白
- 白熾色
- 紅色的
- 綠色的
- 藍色的
- 紫外線
- 透過使用
- 智慧型手機
- 液晶電視
- 筆記型電腦和平板電腦
- 汽車照明
- 通用照明(住宅、商業和工業用途)
- 園藝和醫療照明
- 其他
- 按最終用途行業分類
- 消費性電子產品OEM製造商
- 汽車OEM廠商
- 顯示面板製造商
- 照明燈具製造商
- 專業產品和醫療設備製造商
- 按地區
- 北美洲
- 美國
- 加拿大
- 墨西哥
- 南美洲
- 巴西
- 阿根廷
- 其他南美國家
- 歐洲
- 德國
- 英國
- 法國
- 義大利
- 西班牙
- 其他歐洲國家
- 亞太地區
- 中國
- 日本
- 印度
- 韓國
- ASEAN
- 其他亞太國家
- 中東
- 沙烏地阿拉伯
- 阿拉伯聯合大公國
- 其他中東國家
- 非洲
- 南非
- 奈及利亞
- 其他非洲國家
- 北美洲
第6章 競爭情勢
- 市場集中度
- 策略趨勢
- 市佔率分析
- 公司簡介
- Nichia Corporation
- Intematix Corporation
- Denka Company Limited
- Mitsubishi Chemical Group Corporation
- Lumileds Holding BV
- Cree LED, Inc.
- Citizen Electronics Co., Ltd.
- Beijing Yuji International Co., Ltd.
- Luming Technology Group Co., Ltd.
- PhosphorTech Corporation
- OSRAM GmbH
- Seoul Semiconductor Co., Ltd.
- Samsung Electronics Co., Ltd.
- Epistar Corporation
- LG Innotek Co., Ltd.
- Everlight Electronics Co., Ltd.
- Broadcom Inc.
- Bridgelux, Inc.
- Toyoda Gosei Co., Ltd.
- Sharp Corporation
- Merck KGaA
- TDK Corporation
- Lumichem Korea Co., Ltd.
第7章 市場機會與未來展望
According to Mordor Intelligence, the LED phosphors market size is expected to grow from USD 0.52 billion in 2025 to USD 0.61 billion in 2026 and reach USD 1.02 billion by 2031, at a CAGR of 10.83% during the forecast period (2026-2031).
This report is Segmented by Phosphor Material (Nitride-Based, Silicate Phosphors, and More), Emission Color (Cool White, Warm White, and More), Application (Smartphones, LCD Televisions, Laptops and Tablets, Automotive Lighting, and More), End-Use Industry (Consumer Electronics OEMs, Automotive OEMs, Display Panel Manufacturers, and More), and Geography. The Market Forecasts are Provided in Terms of Value (USD).
Global LED Phosphors Market Trends and Insights
Surge in Global Smart-Lighting Deployments
Municipal retrofits from high-pressure sodium to connected LED arrays are amplifying orders for multi-phosphor blends capable of delivering correlated color temperatures spanning 2 700 K-6 500 K while supporting dim-to-warm control algorithms. North American cities installed more than 8.5 million smart streetlight nodes in 2024, a 34% year-over-year increase, and similar initiatives are scaling across Europe and Asia Pacific. These projects elevate demand for phosphors with low thermal drift and tight binning tolerances, attributes now embedded into most public tender specifications. Smart-building upgrades add further pull, with intelligent lighting controls expected to cut global lighting electricity use 19% by 2030. As ultraviolet disinfection modules become standard in healthcare and hospitality fixtures, inventories of UV-capable phosphors have tightened, reinforcing a favorable price trend for niche suppliers.
Government Energy-Efficiency Mandates for Solid-State Lighting
Standards adopted in the United States, Europe, and China since 2024 require efficacy levels that only high-conversion phosphor systems can deliver. The U.S. floor for commercial luminaires moved to 150 lm/W in January 2025, pushing OEMs toward YAG:Ce and nitride red blends that minimize Stokes losses. Europe's updated Ecodesign rules added color-quality metrics, effectively sidelining low-CRI phosphor mixes, while China linked subsidies to 180 lm/W thresholds, accelerating demand for narrow-band green and red emitters. Collectively, these mandates compress the addressable space for low-performance chemistries and accelerate the LED phosphors market shift toward premium formulations.
Volatility in Rare-Earth Oxide Supply and Pricing
China supplied 70% of global rare-earth output and more than 90% of refining volume in 2024, a concentration that enabled export quotas to lift europium oxide spot prices 22% in early 2025. Phosphor makers outside Asia absorbed raw-material cost spikes that narrowed margins or forced reformulations with inferior CRI. Although new Australian and U.S. refining projects are scheduled for full capacity by late 2026, combined output covers less than 8% of forecast demand, leaving the LED phosphors market exposed to geopolitical shocks.
Other drivers and restraints analyzed in the detailed report include:
- Expanding Display-Panel Production Capacities in Asia
- Quantum-Dot/LED Phosphor Hybrid Solutions Gaining Traction
- High Cost of High-CRI Narrow-Band Red Phosphors
For complete list of drivers and restraints, kindly check the Table Of Contents.
Segment Analysis
Nitride materials controlled 40.32% of LED phosphors market share in 2025 and are projected to register an 11.01% CAGR through 2031. The LED phosphors market size for nitride blends is expanding on the back of adaptive-driving-beam headlamps and premium indoor fixtures that demand tight wavelength stability at junction temperatures above 150 °C. Garnet YAG:Ce remains dominant in cost-sensitive lamps thanks to mature high-yield processes and quantum efficiencies exceeding 85%.
Process innovations that shrink particle-size distributions and integrate phosphor-on-chip deposition enable brighter, thinner mini-LED packages, widening the application envelope. RoHS cadmium caps enacted in Europe during 2024 pushed OEMs to migrate from older silicate reds toward cadmium-free nitride equivalents despite higher costs, reinforcing nitride leadership across cross-border product lines.
Warm white blends held 36.81% of 2025 shipments, mirroring their ubiquity in residential and office lighting. However, red phosphors are forecast to expand at an 11.92% CAGR as controlled-environment agriculture and medical phototherapy specify narrow-band emissions between 600 nm and 700 nm to boost biological efficacy. The LED phosphors market size linked to red products is therefore set to grow faster than any other color segment.
Indoor farms, which added 28% more square footage between 2020 and 2024, are shifting toward spectra-optimized fixtures that elevate photosynthetic photon flux density per watt. In human-centric lighting, tunable white engines blend warm and cool packages alongside red boosts to emulate daylight rhythms; CRI levels above 95 across a 2 700 K-6 500 K range are now commercial reality, underlining the revenue upside for specialty red suppliers.
Complete Report Scope:
- By Phosphor Material
- Nitride-based Phosphors
- Garnet (YAG:Ce) Phosphors
- Silicate Phosphors
- Aluminate Phosphors
- Other Phosphor Materials
- By Emission Color
- Cool White
- Warm White
- Red
- Green
- Blue
- Ultraviolet
- By Application
- Smartphones
- LCD Televisions
- Laptops and Tablets
- Automotive Lighting
- General Lighting (Residential, Commercial, Industrial)
- Horticulture and Medical Lighting
- Other Applications
- By End-Use Industry
- Consumer Electronics OEMs
- Automotive OEMs
- Display Panel Manufacturers
- Lighting Fixture Manufacturers
- Specialty and Medical Device Manufacturers
- By Geography
- North America
- United States
- Canada
- Mexico
- South America
- Brazil
- Argentina
- Rest of South America
- Europe
- Germany
- United Kingdom
- France
- Italy
- Spain
- Rest of Europe
- Asia-Pacific
- China
- Japan
- India
- South Korea
- ASEAN
- Rest of Asia-Pacific
- Middle East
- Saudi Arabia
- United Arab Emirates
- Rest of Middle East
- Africa
- South Africa
- Nigeria
- Rest of Africa
- North America
Geography Analysis
Asia Pacific accounted for 51.07% of 2025 revenues and will expand at a 13.09% CAGR, reinforcing its status as the epicenter of LED and display manufacturing. Cost advantages stem from co-locating rare-earth refining and phosphor synthesis, with Chinese producers paying USD 340 per kg for europium oxide versus USD 465 per kg for North American importers. The LED phosphors market size in South Korea is poised to double by 2028 as mini-LED backlight ramps at LG Display and Samsung Display absorb incremental tonnage.
Japan leverages longstanding materials science depth to supply ultra-narrow nitride reds for automotive and premium lighting niches, commanding price premiums but limited volume. North America and Europe show slower unit growth yet richer mix, driven by mandates that phase out sub-150 lm/W luminaires. Both regions champion recycling to mitigate supply risk; the European Critical Raw Materials Act targets recovering 25% of rare-earth content from discarded lamps by 2030.
Emerging markets in the Middle East and Africa, alongside pockets of South America, add incremental volume via large-scale street-lighting and infrastructure retrofits. The United Arab Emirates completed LED upgrades on 1.2 million streetlights in 2025, trimming municipal energy use by 42%. Import tariffs and logistics complexity still temper Latin American uptake, but incentive programs in Brazil and Argentina are narrowing the affordability gap.
- Nichia Corporation
- Intematix Corporation
- Denka Company Limited
- Mitsubishi Chemical Group Corporation
- Lumileds Holding B.V.
- Cree LED, Inc.
- Citizen Electronics Co., Ltd.
- Beijing Yuji International Co., Ltd.
- Luming Technology Group Co., Ltd.
- PhosphorTech Corporation
- OSRAM GmbH
- Seoul Semiconductor Co., Ltd.
- Samsung Electronics Co., Ltd.
- Epistar Corporation
- LG Innotek Co., Ltd.
- Everlight Electronics Co., Ltd.
- Broadcom Inc.
- Bridgelux, Inc.
- Toyoda Gosei Co., Ltd.
- Sharp Corporation
- Merck KGaA
- TDK Corporation
- Lumichem Korea Co., Ltd.
Additional Benefits:
- The market estimate (ME) sheet in Excel format
- 3 months of analyst support
TABLE OF CONTENTS
1 INTRODUCTION
- 1.1 Study Assumptions and Market Definition
- 1.2 Scope of the Study
2 RESEARCH METHODOLOGY
3 EXECUTIVE SUMMARY
4 MARKET LANDSCAPE
- 4.1 Market Overview
- 4.2 Market Drivers
- 4.2.1 Surge In Global Smart-Lighting Deployments
- 4.2.2 Government Energy-Efficiency Mandates For Solid-State Lighting
- 4.2.3 Rapid Cost Reduction In High-Lumen LED Packages
- 4.2.4 Expanding Display Panel Production Capacities In Asia
- 4.2.5 OEM Demand For Circadian-Tunable Phosphor Blends
- 4.2.6 Quantum-Dot/LED Phosphor Hybrid Solutions Gaining Traction
- 4.3 Market Restraints
- 4.3.1 Volatility In Rare-Earth Oxide Supply And Pricing
- 4.3.2 High Cost Of High-Cri Narrow-Band Red Phosphors
- 4.3.3 Thermal-Quenching Performance Limits At High Drive Currents
- 4.3.4 Stricter ROHS Directives Curbing Some Legacy Phosphor Chemistries
- 4.4 Industry Value Chain Analysis
- 4.5 Regulatory Landscape
- 4.6 Porter's Five Forces Analysis
- 4.6.1 Bargaining Power of Suppliers
- 4.6.2 Bargaining Power of Buyers
- 4.6.3 Threat of New Entrants
- 4.6.4 Threat of Substitute Products
- 4.6.5 Degree of Competition
5 MARKET SIZE AND GROWTH FORECASTS (VALUE)
- 5.1 By Phosphor Material
- 5.1.1 Nitride-based Phosphors
- 5.1.2 Garnet (YAG:Ce) Phosphors
- 5.1.3 Silicate Phosphors
- 5.1.4 Aluminate Phosphors
- 5.1.5 Other Phosphor Materials
- 5.2 By Emission Color
- 5.2.1 Cool White
- 5.2.2 Warm White
- 5.2.3 Red
- 5.2.4 Green
- 5.2.5 Blue
- 5.2.6 Ultraviolet
- 5.3 By Application
- 5.3.1 Smartphones
- 5.3.2 LCD Televisions
- 5.3.3 Laptops and Tablets
- 5.3.4 Automotive Lighting
- 5.3.5 General Lighting (Residential, Commercial, Industrial)
- 5.3.6 Horticulture and Medical Lighting
- 5.3.7 Other Applications
- 5.4 By End-Use Industry
- 5.4.1 Consumer Electronics OEMs
- 5.4.2 Automotive OEMs
- 5.4.3 Display Panel Manufacturers
- 5.4.4 Lighting Fixture Manufacturers
- 5.4.5 Specialty and Medical Device Manufacturers
- 5.5 By Geography
- 5.5.1 North America
- 5.5.1.1 United States
- 5.5.1.2 Canada
- 5.5.1.3 Mexico
- 5.5.2 South America
- 5.5.2.1 Brazil
- 5.5.2.2 Argentina
- 5.5.2.3 Rest of South America
- 5.5.3 Europe
- 5.5.3.1 Germany
- 5.5.3.2 United Kingdom
- 5.5.3.3 France
- 5.5.3.4 Italy
- 5.5.3.5 Spain
- 5.5.3.6 Rest of Europe
- 5.5.4 Asia-Pacific
- 5.5.4.1 China
- 5.5.4.2 Japan
- 5.5.4.3 India
- 5.5.4.4 South Korea
- 5.5.4.5 ASEAN
- 5.5.4.6 Rest of Asia-Pacific
- 5.5.5 Middle East
- 5.5.5.1 Saudi Arabia
- 5.5.5.2 United Arab Emirates
- 5.5.5.3 Rest of Middle East
- 5.5.6 Africa
- 5.5.6.1 South Africa
- 5.5.6.2 Nigeria
- 5.5.6.3 Rest of Africa
- 5.5.1 North America
6 COMPETITIVE LANDSCAPE
- 6.1 Market Concentration
- 6.2 Strategic Moves
- 6.3 Market Share Analysis
- 6.4 Company Profiles (includes Global-level Overview, Market-level Overview, Core Segments, Financials as available, Strategic Information, Market Rank/Share, Products and Services, Recent Developments)
- 6.4.1 Nichia Corporation
- 6.4.2 Intematix Corporation
- 6.4.3 Denka Company Limited
- 6.4.4 Mitsubishi Chemical Group Corporation
- 6.4.5 Lumileds Holding B.V.
- 6.4.6 Cree LED, Inc.
- 6.4.7 Citizen Electronics Co., Ltd.
- 6.4.8 Beijing Yuji International Co., Ltd.
- 6.4.9 Luming Technology Group Co., Ltd.
- 6.4.10 PhosphorTech Corporation
- 6.4.11 OSRAM GmbH
- 6.4.12 Seoul Semiconductor Co., Ltd.
- 6.4.13 Samsung Electronics Co., Ltd.
- 6.4.14 Epistar Corporation
- 6.4.15 LG Innotek Co., Ltd.
- 6.4.16 Everlight Electronics Co., Ltd.
- 6.4.17 Broadcom Inc.
- 6.4.18 Bridgelux, Inc.
- 6.4.19 Toyoda Gosei Co., Ltd.
- 6.4.20 Sharp Corporation
- 6.4.21 Merck KGaA
- 6.4.22 TDK Corporation
- 6.4.23 Lumichem Korea Co., Ltd.
7 MARKET OPPORTUNITIES AND FUTURE OUTLOOK
- 7.1 White-space and Unmet-need Assessment

 2025-2029年全球LED磷光體市場
 LED磷光體市場規模、佔有率及成長分析(按類型、應用和地區分類)-2026-2033年產業預測
 2032 年 LED磷光體市場預測:按類型、材料、技術、應用、最終用戶和地區分類的全球分析
 全球LED磷光體市場