


 |
市場調查報告書
商品編碼
2123290
應用容器:市場佔有率分析、產業趨勢與統計、成長預測(2026-2031)Application Container - Market Share Analysis, Industry Trends & Statistics, Growth Forecasts (2026 - 2031) |
||||||

※ 本網頁內容可能與最新版本有所差異。詳細情況請與我們聯繫。
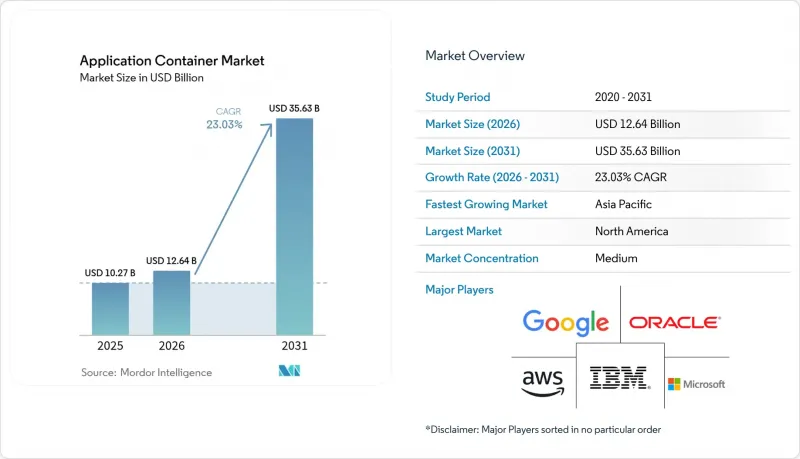
應用容器市場預計將從 2025 年的 102.7 億美元成長到 2026 年的 126.4 億美元,然後在 2031 年達到 356.3 億美元,2026 年至 2031 年的複合年成長率為 23.03%。
本報告按組件(平台和服務)、部署模式(公共雲端、私有雲端等)、組織規模(大型企業和中小企業)、行業(醫療保健、製造業等)、容器用例領域(監控、安全性、網路、儲存等)和地區進行細分。市場預測以美元計價。
全球應用容器市場趨勢及洞察
加速採用微服務架構
從單體架構到微服務架構的轉變正在加速。這是因為企業可以獨立擴展各個功能,縮短發布週期,並降低故障的影響。根據 Docker 2024 年的研究,容器化服務的採用速度比單體架構快 40%。包括摩根大通在內的領先金融機構已將其超過 60% 的交易和風險管理系統容器化,以增強在市場波動環境下的韌性。零售平台正在利用具有自動擴展功能的微服務來處理限時搶購期間的流量,同時降低成本。雖然服務網格的無序擴張和分散式追蹤的開銷增加了複雜性,但生產力的提升仍在持續推動應用容器市場的快速成長。
對混合雲和多重雲端敏捷性的需求
資料居住法規,例如 GDPR 和中國的《資料安全法》,將迫使 58% 的跨國公司在 2025 年前將其工作負載分佈在多個雲端平台上。容器提供了一個一致的執行環境,無需重寫程式碼即可在 AWS EKS、Google GKE 和 Azure AKS 上執行,從而幫助企業避免被單一供應商鎖定。紅帽公司透露,OpenShift 客戶的平均部署規模已覆蓋 2.7 個雲端服務供應商。儘管在異質環境中協調身分管理和可觀測性的營運負擔不容小覷,但滿足主權監管要求的策略需求正在推動對容器平台的投資,並促進應用容器市場的發展。
容器安全漏洞和錯誤配置
根據美國網路安全和基礎設施安全局 (CISA) 於 2025 年 1 月發布的安全加固指南,67% 的容器相關安全漏洞歸因於配置錯誤的基於角色的存取控制 (RBAC)、API 暴露或鏡像過時。國家漏洞資料庫 (NVD) 記錄了 2024 年 342 個與容器相關的 CVE 漏洞,年增 28%。 Unit 42 的一項研究發現,每天有 1200 次針對配置錯誤的叢集的加密貨幣挖礦攻擊試驗。監管機構現在強制要求提供運行時威脅偵測和事件回應的證據,這增加了合規成本,同時也收緊了應用容器市場的採購標準。
細分市場分析
預計到2025年,平台解決方案將佔據應用容器市場56.74%的佔有率,這印證了市場對授權運行時、註冊表和捆綁式編配套件的早期偏好。服務領域預計將以23.41%的複合年成長率成長,其驅動力來自企業難以跟上Kubernetes季度更新、多叢集管治以及日益嚴格的合規性審計,以及企業越來越願意為外部專業知識付費。因此,以服務為主導的應用容器市場預計將比平台收入成長更快,因為買家往往更注重營運彈性而非功能統一性。 IBM的容器諮詢收入預計在2025年成長45%,這表明大型銀行和保險公司認為託管升級比僱用人手不足的系統管理員更具成本效益。供應商現在正將人工智慧驅動的資源調優納入服務契約,從而縮短故障排除週期並提高成本分配的準確性。
託管服務供應商還提供全天候事件回應、SBOM自動化和災害復原培訓等服務——這些服務大多數企業內部平台團隊無法持續提供。小規模的工具供應商透過點擊式主機滿足中階市場的需求,但往往缺乏受監管產業所需的認證和薪資系統。全球系統整合商正在透過整合多重雲端著陸區、GitOps管線和FinOps扣回爭議帳款帳簿來填補這一空白。由於技能短缺問題不太可能在2028年之前解決,常規服務支出仍將是應用容器市場的堅實支柱。隨著時間的推移,平台代碼將逐漸商品化,但值得信賴的維運經驗將確保服務利潤率的健康成長。
預計到2025年,公共雲端將佔總收入的71.34%。這主要得益於託管式Kubernetes消除了繁瑣的控制平面工作,並與原生負載平衡器、身分和存取管理(IAM)以及物件儲存無縫整合。然而,混合雲和多重雲端環境預計將以23.67%的複合年成長率成長,因為資料居住法規和延遲目標迫使企業將叢集在更靠近使用者和受監管資料集的位置。隨著聯邦框架無需重寫程式碼即可在本地機架和多個超大規模資料中心業者中心之間調度Pod,混合部署應用容器市場正在迅速擴張。歐洲數據法以及印度和印尼的類似法規,透過強制要求在國內處理消費者數據,進一步強化了這一趨勢。
電信業者已開始將 5G 核心功能分佈在私有雲端上,以實現亞毫秒級延遲,同時將分析工作負載卸載到低成本的公共區域,從而創建出其他行業將效仿的參考架構。中國企業的目標是到 2025 年將混合 Kubernetes 的採用率提高 80%,將主權雲與工廠和分店的邊緣節點整合。確保一致性仍然是一項挑戰,因為網路策略、服務網格證書和審計日誌需要在叢集之間保持一致,但新的策略引擎和網格聯邦工具正在緩解這一難題。隨著管治架構的建立,混合部署將不再被視為異常,而是容器化採用過程中的自然步驟。這種轉變將打破單一供應商的壟斷,並將成長分散到各個供應商,從而實現收入來源多元化和可移植性。
區域分析
預計到2025年,北美將維持41.22%的容器應用市場佔有率,這得益於金融服務、聯邦機構和數位原生技術公司對Kubernetes的早期採用。區域超大規模資料中心業者雲端服務商正在快速迭代託管控制平面,縮短價值實現時間並提高客戶留存率。美國網路安全與基礎設施安全局 (CISA)、美國國家標準與技術研究院 (NIST) 以及聯邦風險與授權管理計畫 (FedRAMP) 已發布關於加強容器安全性的規範性指南,使風險負責人能夠更有信心地批准雲端原生部署。符合州級資料居住法律的本地主權雲端區域的出現也加速了採購。儘管有這些優勢,但傳統中介軟體供應商基於CPU的授權模式所帶來的成本壓力限制了節點整合,並促使一些公司遷移到開放原始碼替代解決方案。
亞太地區預計將成為成長速度最快的地區,到2031年複合年成長率將達到24.07%,該地區的應用容器市場規模預計將以遠超其他地區的成長率擴張。中國的《資料安全法》和「資料在東方,計算在西方」計畫正在推動雙叢集架構的發展,將敏感資料保護在防火牆之後,同時將分析處理任務卸載到內陸的超級資料中心。印度的數位公共基礎設施,特別是截至2025年12月已處理134億筆交易的“統一支付介面(UPI)”,依靠容器化的微服務來實現亞秒級支付處理的目標。日本製造商正在將託管Kubernetes整合到智慧工廠閘道器中,而澳洲銀行正在採用多重雲端來實現災害復原中的隔離。人才短缺問題依然存在,但由於政府資助的技能再培訓計畫和廠商贊助的培訓機構,技能差距正在縮小。
歐洲的發展趨勢受《一般資料保護規則》(GDPR) 和《2024 年資料法案》的影響,這兩項法規都在推動對混合架構的需求,以確保個人資料留在歐盟境內。德國聯邦金融監理局 (BaFin) 目前要求銀行透過實際容錯移轉演練來證明容器化工作負載的容錯能力,這加速了對該平台的投資。法國和主導國家正在推廣自身的開放原始碼棧,以減少對美國超大規模資料中心業者的依賴,而英國則透過簡化的監管沙盒來吸引金融科技公司。南美、中東和非洲仍在發展中,但充滿活力。巴西的即時支付網路和阿拉伯聯合大公國的智慧城市專案都依賴可部署在資源受限的邊緣節點上的輕量級運行時環境。有限的本地雲端區域和高昂的資料傳輸成本阻礙了其普及,但 5G 的日益普及和新的數位化舉措表明,該領域具有長期穩定成長的潛力。
其他好處:
- Excel格式的市場預測(ME)表
- 3個月的分析師支持
目錄
第1章:引言
- 研究假設和市場定義
- 調查範圍
第2章:調查方法
第3章執行摘要
第4章 市場狀況
- 市場概覽
- 市場促進因素
- 微服務架構的採用正在加速。
- 對混合雲和多重雲端敏捷性的需求
- DevOps 和 CI/CD 管線的激增
- 需要進行資源最佳化和提高成本效益。
- 需要輕量級運行時的邊緣原生 AI 工作負載
- 對敏感計算的需求正在推動容器化安全區域的採用。
- 市場限制因素
- 容器安全漏洞和錯誤配置
- 大規模編配的複雜性
- 開放原始碼容器中 SBOM 合規性的負擔日益加重
- 基於 CPU 的授權模式對於高密度容器來說是不利的。
- 產業價值鏈分析
- 監理情勢
- 技術展望
- 波特五力分析
- 宏觀經濟因素對市場的影響
- 產業生態系分析
- 主要用例和案例研究
- 投資分析
第5章 市場規模與成長預測
- 按組件
- 平台
- 服務
- 按部署模式
- 公共雲端
- 私有雲端
- 混合雲端和多重雲端
- 按組織規模
- 大公司
- 小型企業
- 按行業分類
- 資訊科技/通訊
- BFSI
- 衛生保健
- 零售與電子商務
- 製造業
- 政府/公共部門
- 各行業貨櫃應用案例
- 管理與編配
- 監測
- DevOps 工具鏈
- 安全
- 網路
- 貯存
- 按地區
- 北美洲
- 美國
- 加拿大
- 墨西哥
- 南美洲
- 巴西
- 阿根廷
- 其他南美國家
- 歐洲
- 英國
- 德國
- 法國
- 義大利
- 其他歐洲國家
- 亞太地區
- 中國
- 日本
- 印度
- 韓國
- 其他亞太國家
- 中東和非洲
- 中東
- 阿拉伯聯合大公國
- 沙烏地阿拉伯
- 其他中東國家
- 非洲
- 南非
- 埃及
- 其他非洲國家
- 中東
- 北美洲
第6章 競爭情勢
- 市場集中度
- 策略趨勢
- 市佔率分析
- 公司簡介
- Red Hat, Inc.
- Mirantis, Inc.
- VMware, Inc.
- SUSE SE
- Canonical Ltd.
- Docker, Inc.
- Amazon Web Services, Inc.
- Google LLC
- Microsoft Corporation
- Oracle Corporation
- IBM Corporation
- Rancher Labs, Inc.
- Alibaba Cloud Computing Co., Ltd.
- Hewlett Packard Enterprise Company
- Cisco Systems, Inc.
- Palo Alto Networks, Inc.
- Portainer Ltd.
- Heroku LLC
- NetApp, Inc.
- HashiCorp, Inc.
- Sysdig, Inc.
- Pure Storage, Inc.
第7章 市場機會與未來展望
According to Mordor Intelligence, the application container market size is expected to grow from USD 10.27 billion in 2025 to USD 12.64 billion in 2026 and is forecast to reach USD 35.63 billion by 2031 at a 23.03% CAGR over 2026-2031.
This report is Segmented by Component (Platform, and Services), Deployment Model (Public Cloud, Private Cloud, and More), Organization Size (Large Enterprises, and Small and Medium Enterprises), Industry Vertical (Healthcare, Manufacturing, and More), Container Use-Case Area (Monitoring, Security, Networking, Storage, and More), and Geography. The Market Forecasts are Provided in Terms of Value (USD).
Global Application Container Market Trends and Insights
Accelerating Adoption of Microservices Architecture
The shift from monoliths to microservices is accelerating because enterprises can scale individual functions independently, shorten release cycles, and reduce blast radius during outages. Docker's 2024 study found that containerized services are deployed 40% faster than monolithic stacks. Large financial institutions, including JPMorgan Chase, containerized more than 60% of trading and risk systems to improve resilience during volatile market events. Retail platforms use auto-scaling microservices to handle flash-sale traffic while keeping costs in check. Although service mesh sprawl and distributed tracing overhead introduce complexity, the productivity upside keeps the application container market on a steep growth trajectory.
Demand for Hybrid and Multi-Cloud Agility
Data residency laws such as GDPR and China's Data Security Law forced 58% of multinational firms to split workloads across multiple clouds in 2025. Containers offer a consistent runtime that runs on AWS EKS, Google GKE, and Azure AKS without code rewrites, giving enterprises a way to avoid vendor lock-in. Red Hat disclosed that OpenShift customers now span an average of 2.7 cloud providers per deployment. The operational burden of harmonizing identity management and observability across heterogeneous estates is non-trivial, yet the strategic need to meet sovereignty mandates catalyzes spending on container platforms, strengthening the application container market.
Container Security Vulnerabilities and Misconfigurations
CISA's January 2025 hardening guide attributed 67% of container breaches to misconfigured RBAC, exposed APIs, or stale images. The National Vulnerability Database logged 342 container CVEs in 2024, up 28% year on year. Unit 42 observed 1,200 daily attempts at cryptomining against misconfigured clusters. Regulators now require runtime threat detection and incident response attestations, adding compliance spend but also tightening buying criteria in the application container market.
Other drivers and restraints analyzed in the detailed report include:
- Surge in DevOps and CI/CD Pipelines
- Need for Resource Optimization and Cost Efficiency
- Complexity of Large-Scale Orchestration
For complete list of drivers and restraints, kindly check the Table Of Contents.
Segment Analysis
Platform solutions captured 56.74% of the 2025 application container market share, underscoring the early preference for licensed runtimes, registries, and bundled orchestration suites. Services are forecast to expand at a 23.41% CAGR because enterprises struggle to keep pace with quarterly Kubernetes releases, multi-cluster governance, and escalating compliance reviews, leading them to be willing to pay for outside expertise. The application container market, attributable to services, is therefore positioned to outgrow platform revenue as buyers prioritize operational resilience over feature parity. IBM's container advisory revenues grew 45% in 2025, showing that large banks and insurers view managed upgrades as cheaper than hiring scarce administrators. Vendors now embed AI-driven resource tuning into service contracts, shortening troubleshooting cycles and improving cost allocation accuracy.
Managed service providers also bundle 24x7 incident response, SBOM automation, and disaster-recovery drills that most internal platform teams cannot staff continuously. Smaller tools vendors answer mid-market needs with click-driven consoles, yet they often lack the certifications and indemnities sought by regulated industries. Global systems integrators fill that gap, stitching together multicloud landing zones, GitOps pipelines, and FinOps chargeback ledgers. Skills shortages are unlikely to ease before 2028, so recurring services spend should remain a durable pillar of the application container market. Over time, platform code will commoditize, but trusted operational expertise will keep service margins healthy.
Public cloud accounted for 71.34% of 2025 revenue because managed Kubernetes eliminated control-plane toil and paired seamlessly with native load balancers, IAM, and object storage. Hybrid and multi-cloud estates, however, are projected to climb at a 23.67% CAGR as data-residency laws and latency targets force enterprises to place clusters near users or regulated datasets. The application container market size for hybrid deployments is growing rapidly, as federation frameworks now let teams schedule pods across on-prem racks and multiple hyperscalers without code rewrites. The European Data Act and similar statutes in India and Indonesia heighten this trend by mandating in-country processing for consumer data.
Telecommunications operators have already split 5G core functions across private clouds to achieve sub-10-millisecond latency while shipping analytics workloads to inexpensive public regions, creating reference architectures that other industries follow. Chinese enterprises lifted hybrid Kubernetes usage by 80% in 2025, blending sovereign clouds with edge nodes in factories and branch offices. Consistency remains hard because network policies, service-mesh certificates, and audit logs must align across clusters, yet new policy engines and mesh federation tools are easing that friction. As governance frameworks solidify, hybrid rollouts will no longer be seen as exotic; rather, they will become an expected stage in the container adoption journey. The shift diversifies revenue away from single-provider lock-in, spreading growth across vendors that can power portability.
Complete Report Scope:
- By Component
- Platform
- Services
- By Deployment Model
- Public Cloud
- Private Cloud
- Hybrid and Multi-Cloud
- By Organization Size
- Large Enterprises
- Small and Medium Enterprises
- By Industry Vertical
- IT and Telecom
- BFSI
- Healthcare
- Retail and e-Commerce
- Manufacturing
- Government and Public Sector
- By Container Use-Case Area
- Management and Orchestration
- Monitoring
- DevOps Tool-chain
- Security
- Networking
- Storage
- By Geography
- North America
- United States
- Canada
- Mexico
- South America
- Brazil
- Argentina
- Rest of South America
- Europe
- United Kingdom
- Germany
- France
- Italy
- Rest of Europe
- Asia Pacific
- China
- Japan
- India
- South Korea
- Rest of Asia Pacific
- Middle East and Africa
- Middle East
- United Arab Emirates
- Saudi Arabia
- Rest of Middle East
- Africa
- South Africa
- Egypt
- Rest of Africa
- Middle East
- North America
Geography Analysis
North America retained 41.22% of the 2025 container application market share, benefiting from early Kubernetes adoption across financial services, federal agencies, and digital-native technology firms. Regional hyperscalers iterate rapidly on managed control planes, shortening time-to-value and reinforcing customer stickiness. CISA, NIST, and the Federal Risk and Authorization Management Program have published prescriptive guidance on container hardening, giving risk officers the confidence to approve cloud-native rollouts. Accelerated purchasing has also been fueled by the availability of local sovereign cloud regions that satisfy state-level data residency laws. Despite this lead, cost pressures tied to CPU-based licensing models from legacy middleware suppliers temper node densification and motivate some enterprises to migrate to open-source alternatives.
Asia-Pacific is projected to generate the fastest regional growth at a 24.07% CAGR through 2031, lifting the region's application container market size far more quickly than any other geography. China's Data Security Law and "Eastern-Data, Western-Compute" program are driving dual-cluster architectures that keep sensitive data behind the Great Firewall while offloading analytics to inland megacenters. India's digital public infrastructure, particularly the Unified Payments Interface, which processed 13.4 billion transactions in December 2025, relies on containerized microservices to achieve sub-second settlement targets. Japan's manufacturers embed managed Kubernetes on smart-factory gateways, while Australia's banks adopt multi-cloud for disaster-recovery separation. Talent shortages persist, yet government-funded reskilling programs and vendor-hosted training academies are narrowing the skills gap.
Europe's trajectory is shaped by the General Data Protection Regulation and the 2024 Data Act, both of which amplify demand for hybrid architectures that keep personal data inside EU borders. Germany's BaFin now requires banks to demonstrate containerized workload resilience through live failover drills, accelerating platform investments. France and the Nordics promote sovereign open-source stacks to limit dependence on U.S. hyperscalers, while the United Kingdom courts fintechs with simplified regulatory sandboxes. South America and the Middle East, and Africa remain nascent but vibrant; Brazil's instant-payments network and the United Arab Emirates' smart-city projects both rely on lightweight runtimes deployable on resource-constrained edge nodes. Limited local cloud regions and high data-egress fees slow adoption, yet rising 5G penetration and green-field digital initiatives point to steady long-term upside.
- Red Hat, Inc.
- Mirantis, Inc.
- VMware, Inc.
- SUSE SE
- Canonical Ltd.
- Docker, Inc.
- Amazon Web Services, Inc.
- Google LLC
- Microsoft Corporation
- Oracle Corporation
- IBM Corporation
- Rancher Labs, Inc.
- Alibaba Cloud Computing Co., Ltd.
- Hewlett Packard Enterprise Company
- Cisco Systems, Inc.
- Palo Alto Networks, Inc.
- Portainer Ltd.
- Heroku LLC
- NetApp, Inc.
- HashiCorp, Inc.
- Sysdig, Inc.
- Pure Storage, Inc.
Additional Benefits:
- The market estimate (ME) sheet in Excel format
- 3 months of analyst support
TABLE OF CONTENTS
1 INTRODUCTION
- 1.1 Study Assumptions and Market Definition
- 1.2 Scope of the Study
2 RESEARCH METHODOLOGY
3 EXECUTIVE SUMMARY
4 MARKET LANDSCAPE
- 4.1 Market Overview
- 4.2 Market Drivers
- 4.2.1 Accelerating Adoption of Microservices Architecture
- 4.2.2 Demand for Hybrid and Multi-cloud Agility
- 4.2.3 Surge in DevOps and CI/CD Pipelines
- 4.2.4 Need for Resource Optimization and Cost Efficiency
- 4.2.5 Edge-native AI Workloads Needing Lightweight Runtimes
- 4.2.6 Confidential Computing Requirements Favor Containerized Secure Enclaves
- 4.3 Market Restraints
- 4.3.1 Container Security Vulnerabilities and Misconfigurations
- 4.3.2 Complexity of Large-scale Orchestration
- 4.3.3 Rising SBOM Compliance Overhead for Open-source Containers
- 4.3.4 CPU-based Licensing Models Penalizing High-density Containers
- 4.4 Industry Value Chain Analysis
- 4.5 Regulatory Landscape
- 4.6 Technological Outlook
- 4.7 Porter's Five Forces Analysis
- 4.7.1 Bargaining Power of Suppliers
- 4.7.2 Bargaining Power of Buyers
- 4.7.3 Threat of New Entrants
- 4.7.4 Threat of Substitutes
- 4.7.5 Competitive Rivalry
- 4.8 Impact of Macroeconomic Factors on the Market
- 4.9 Industry Ecosystem Analysis
- 4.10 Key Use Cases and Case Studies
- 4.11 Investment Analysis
5 MARKET SIZE AND GROWTH FORECASTS (VALUE)
- 5.1 By Component
- 5.1.1 Platform
- 5.1.2 Services
- 5.2 By Deployment Model
- 5.2.1 Public Cloud
- 5.2.2 Private Cloud
- 5.2.3 Hybrid and Multi-Cloud
- 5.3 By Organization Size
- 5.3.1 Large Enterprises
- 5.3.2 Small and Medium Enterprises
- 5.4 By Industry Vertical
- 5.4.1 IT and Telecom
- 5.4.2 BFSI
- 5.4.3 Healthcare
- 5.4.4 Retail and e-Commerce
- 5.4.5 Manufacturing
- 5.4.6 Government and Public Sector
- 5.5 By Container Use-Case Area
- 5.5.1 Management and Orchestration
- 5.5.2 Monitoring
- 5.5.3 DevOps Tool-chain
- 5.5.4 Security
- 5.5.5 Networking
- 5.5.6 Storage
- 5.6 By Geography
- 5.6.1 North America
- 5.6.1.1 United States
- 5.6.1.2 Canada
- 5.6.1.3 Mexico
- 5.6.2 South America
- 5.6.2.1 Brazil
- 5.6.2.2 Argentina
- 5.6.2.3 Rest of South America
- 5.6.3 Europe
- 5.6.3.1 United Kingdom
- 5.6.3.2 Germany
- 5.6.3.3 France
- 5.6.3.4 Italy
- 5.6.3.5 Rest of Europe
- 5.6.4 Asia Pacific
- 5.6.4.1 China
- 5.6.4.2 Japan
- 5.6.4.3 India
- 5.6.4.4 South Korea
- 5.6.4.5 Rest of Asia Pacific
- 5.6.5 Middle East and Africa
- 5.6.5.1 Middle East
- 5.6.5.1.1 United Arab Emirates
- 5.6.5.1.2 Saudi Arabia
- 5.6.5.1.3 Rest of Middle East
- 5.6.5.2 Africa
- 5.6.5.2.1 South Africa
- 5.6.5.2.2 Egypt
- 5.6.5.2.3 Rest of Africa
- 5.6.5.1 Middle East
- 5.6.1 North America
6 COMPETITIVE LANDSCAPE
- 6.1 Market Concentration
- 6.2 Strategic Moves
- 6.3 Market Share Analysis
- 6.4 Company Profiles (includes Global Level Overview, Market Level Overview, Core Segments, Financials as available, Strategic Information, Market Rank/Share, Products and Services, Recent Developments)
- 6.4.1 Red Hat, Inc.
- 6.4.2 Mirantis, Inc.
- 6.4.3 VMware, Inc.
- 6.4.4 SUSE SE
- 6.4.5 Canonical Ltd.
- 6.4.6 Docker, Inc.
- 6.4.7 Amazon Web Services, Inc.
- 6.4.8 Google LLC
- 6.4.9 Microsoft Corporation
- 6.4.10 Oracle Corporation
- 6.4.11 IBM Corporation
- 6.4.12 Rancher Labs, Inc.
- 6.4.13 Alibaba Cloud Computing Co., Ltd.
- 6.4.14 Hewlett Packard Enterprise Company
- 6.4.15 Cisco Systems, Inc.
- 6.4.16 Palo Alto Networks, Inc.
- 6.4.17 Portainer Ltd.
- 6.4.18 Heroku LLC
- 6.4.19 NetApp, Inc.
- 6.4.20 HashiCorp, Inc.
- 6.4.21 Sysdig, Inc.
- 6.4.22 Pure Storage, Inc.
7 MARKET OPPORTUNITIES AND FUTURE OUTLOOK
- 7.1 White-space and Unmet-Need Assessment

 2026-2030年全球應用容器市場
 2026年全球應用容器市場報告
 應用容器市場:2026-2032年全球市場預測(依容器類型、部署模式、應用程式類型、作業系統和最終用戶分類)
 應用容器市場分析及預測(至 2035 年):按類型、產品類型、服務、技術、組件、應用、部署類型、最終用戶和解決方案分類
 應用容器市場 - 全球產業規模、佔有率、趨勢、機會、預測:按服務、平台、組織規模、地區和競爭對手分類,2021-2031 年PP圓形容器市場依產品類型、產能、製造流程、終端用戶產業及通路分類,全球預測(2026-2032年)
 應用容器市場規模、佔有率和成長分析(按服務、部署模式、應用領域和地區分類)-產業預測(2026-2033 年)
 應用容器市場規模、佔有率、趨勢分析報告:按服務、部署、公司規模、最終用途、地區、細分市場預測,2025 年至 2030 年