


 |
市場調查報告書
商品編碼
2123253
印度電動三輪車:市場佔有率分析、產業趨勢與統計及成長預測(2026-2031)India Electric Rickshaw - Market Share Analysis, Industry Trends & Statistics, Growth Forecasts (2026 - 2031) |
||||||

※ 本網頁內容可能與最新版本有所差異。詳細情況請與我們聯繫。
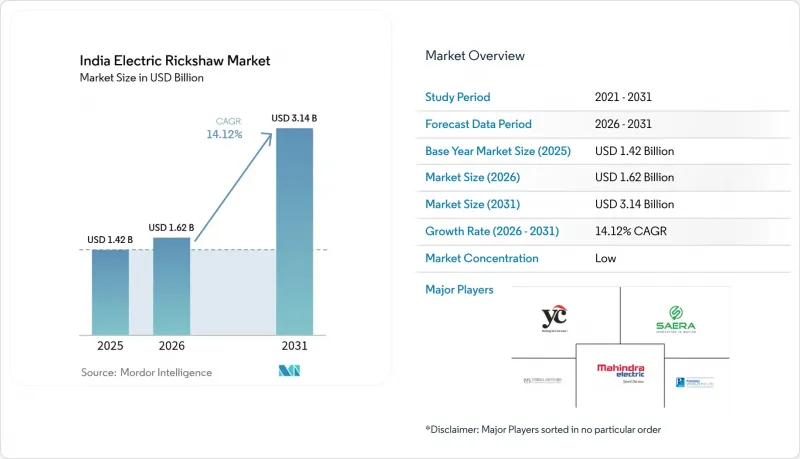
2025 年印度電動三輪車市場價值 14.2 億美元,預計到 2031 年將從 2026 年的 16.2 億美元成長到 31.4 億美元,預測期(2026-2031 年)複合年成長率為 14.12%。
本報告按車輛類型(例如,客運車輛)、功率輸出(例如,1千瓦或以下)、電池類型(例如,鉛酸電池)、電池容量(3千瓦時或以下及以上)、充電方式(插電式充電及其他)、所有權類型(私人所有、司機駕駛及其他)以及所在邦/州(北方邦、德里及其他)進行細分。市場預測以貨幣價值(美元)和銷售(輛)兩種形式呈現。
印度電動三輪車市場趨勢與洞察
FAME-II補貼和州級獎勵的延長將加速二線城市的推廣應用。
FAME-II計畫的延期以及聯邦層級與「2024年電動出行促進計畫」的延續,維持了每輛車的補貼,降低了主要大都會圈以外地區駕駛員的購車門檻。此外,各邦政府也採取了一系列措施,例如馬哈拉斯特拉邦、卡納塔克邦和德里邦的購車補貼和道路稅減免,進一步降低了購車成本,使電動三輪車在銷售時能夠與內燃機(ICE)車型在價格上競爭。補貼力道與註冊量之間有顯著的相關性,分析顯示,邦政府每增加一輛車的補貼力度,銷售量就會增加46.16%。當地金融機構報告稱,貸款回收期縮短,鼓勵了更多人參與貸款。這些金融措施共同推動印度電動三輪車市場進一步滲透到對成本敏感的二線都會區,這些地區正經歷非正規交通需求的激增。
快速都市化城鎮對最後一公里共享出行的需求日益成長。
在印度不斷擴張的中型城市網路中,自動三輪車在連接公共交通的「最後一公里」和「第一公里」方面發揮著至關重要的作用。與汽油或壓縮天然氣三輪車每公里3-4盧比的營運成本相比,電動三輪車的營運成本降至每公里0.50-0.70盧比,為車主和駕駛帶來了即時的收入成長。優步(Uber)和Rapido等共享出行平台正在引入電動三輪車,以滿足市政空氣污染防治法規的要求並滿足用戶對價格的敏感度。高日運轉率擴大了燃料成本邊際收益,儘管初始購買成本較高,但投資回報速度很快。便利的數位化預訂系統提高了資產利用率,進一步增強了營運商的盈利,並推動了電動三輪車在印度的整體普及。
分散且非正式的資金籌措管道限制了司機的購買力。
由於缺乏大規模的貸款管道,實際利率居高不下,貸款價值比(LTV)偏低,這抑制了依賴每日車費收入維持生計的個體駕駛人購買電動車的意願。出於對技術風險的擔憂,許多貸款機構將電動車視為非標準資產,儘管其運作成本低廉,但貸款額度仍受到限制。雖然非正規貸款機構填補了這一空白,但他們收取的利率過高,削弱了電動車的總擁有成本(TCO)優勢。發展金融機構正在倡導混合融資池以降低零售貸款的風險,但這種模式在主要城市以外的地區推廣緩慢。除非大型銀行對電動三輪車的信貸評估規範化,否則對前期成本負擔最敏感的細分市場的成長可能仍將低於其應有的水平。
細分市場分析
在印度,電動三輪車市場佔有率目前主要由客運領域佔據,預計2025年將佔總銷售量的83.45%,鞏固其作為共用城市交通基石的地位。密集的都市區路線和24小時運作使駕駛人能夠最大限度地降低每公里的能源成本(僅需幾分錢),從而增強了該領域的韌性。同時,貨運領域正以28.10%的複合年成長率(CAGR)保持成長,主要得益於線上零售對高流動性和零排放氣體「最後一公里」配送的需求。亞馬遜印度、Flipkart和電商平台已與主要原始設備製造商(OEM)正式建立了採購管道,確保了可預測的銷售成長。針對特定領域的設計,例如冷藏車廂,正在拓展食品配送和醫藥行業的市場。憑藉高載重能力和整合的遠端資訊處理功能,貨運電動三輪車正成為未來城市物流理念的重要組成部分。
從絕對數量來看,搭乘用車型預計仍將在印度電動三輪車市場佔據主導地位,但貨運車型的價值貢獻將透過高階配置組合穩步提升。針對商用車的稅收優惠以及在二線城市建造專用微型倉配中心,預計將進一步提高貨運車型的累積滲透率。隨著都市區堵塞費的上漲,貨運公司將越來越傾向於選擇電動三輪車而非輕型卡車,從而鞏固該細分市場的長期成長基礎。
以功率輸出計算,印度電動三輪車市場佔有率中,1-1.5千瓦電機組佔據主導地位,預計2025年將佔總需求的53.90%。此輸出範圍非常適合一般客運,能夠提供足夠的扭矩,滿足都市區頻繁啟停的需求,同時又能節省電池電量。營運商對其均衡的性能讚賞有加,包括經濟實惠的初始成本和實用的續航里程,使其在高頻次的都市區運營循環中特別實用。
相較之下,在印度電動三輪車市場,動力傳動系統總成成長最為迅猛,年複合成長率高達30.95%,這主要得益於對負載容量和更陡坡度行駛需求的成長。該細分市場受益於電橋技術的進步,例如整合馬達控制器和符合IP標準的機殼,這些技術提高了車輛在印度惡劣季風氣候條件下的耐用性,並增強了營運商對這些車輛的信心。
高功率三輪車主要面向冷藏貨物運輸、陡峭山路行駛以及對出行速度要求更高的高階叫車服務。零件供應商正在提高磁鐵和定子的本地化產量,降低進口零件的比例,從而穩定價格水準。隨著單位經濟效益的提升,預計功率超過1.5千瓦的電動三輪車在印度的市佔率將進一步擴大,開啟競爭的新階段,這場競爭不僅關注成本,更關注性能。
其他好處:
- Excel格式的市場預測(ME)表
- 3個月的分析師支持
目錄
第1章:引言
- 研究假設和市場定義
- 調查範圍
第2章:調查方法
第3章執行摘要
第4章 市場狀況
- 市場概覽
- 市場促進因素
- FAME-II 補貼的延長和各州的優惠待遇正在加速二級市場的普及。
- 快速都市化城鎮對最後一公里共享出行的需求日益成長。
- 電子商務物流:引進電動貨運三輪車進行本地配送。
- 鉛酸電池回收生態系統降低了整體擁有成本
- 一種「電池即服務」的訂閱模式,可降低初始資本支出(Capex)。
- 德里-NCR地區將被要求在2030年前逐步淘汰內燃機(ICE)三輪車。
- 市場限制因素
- 分散且非正式的資金籌措管道限制了司機購買車輛的能力。
- 本地道路上底盤堅固性的安全隱患
- 非正規鉛酸蓄電池供應鏈的品質差異
- 可互換電池標準的延遲採用阻礙了互通性。
- 價值供應鏈分析
- 監管和技術展望
- 波特五力分析
第5章 市場規模與成長預測
- 車輛類型
- 客運營運商
- 貨物運輸車輛
- 依輸出類型
- 1千瓦或以下
- 1~1.5 kW
- 1.5千瓦或以上
- 依電池類型
- 鉛酸
- 鋰離子(NMC/NCA)
- 鋰離子電池(LFP)
- 其他化學系統(鋰聚合物、鎳氫化物)
- 按電池容量
- 3千瓦時或更少
- 3~6 kWh
- 6度或以上
- 透過充電方法
- 插電式充電
- 電池更換
- 自有車型
- 私人擁有和駕駛
- 車隊營運商
- 聚合器/出行即服務平台
- 按州
- 北方邦
- 德里
- 馬哈拉斯特拉邦
- 比哈爾邦
- 拉賈斯坦邦
- 卡納塔克邦
- 泰米爾納德邦
- 旁遮普邦
- 特倫甘納邦
- 印度其他地區
第6章 競爭情勢
- 市場集中度
- 策略趨勢
- 市佔率分析
- 公司簡介
- Terra Motors India Corp.
- Piaggio Vehicles Pvt. Ltd.
- Mahindra Electric Mobility Ltd.
- Kinetic Green Energy & Power Solutions Ltd.
- ATUL Auto Ltd.
- Saera Electric Auto Pvt. Ltd.
- YC Electric Vehicle
- Goenka Electric Motor Vehicles Pvt. Ltd.
- Udaan E-Rickshaw
- Thukral Electric Bikes
- Mini Metro EV LLP
- E-Ashwa Automotive Pvt. Ltd.
- CityLife EV
- Adapt Motors Pvt. Ltd.
- Vani Electric Vehicles Pvt. Ltd.(Jezza Motors)
- Omega Seiki Mobility
- Euler Motors
- Lohia Auto Industries
- Bajaj Auto Ltd.(Electric 3W Division)
- Altigreen Propulsion Labs
- Gayam Motor Works
- Lectrix EV
- Saarthi E-Rickshaw
第7章 市場機會與未來展望
According to Mordor Intelligence, the indian electric rickshaw market size was valued at USD 1.42 billion in 2025 and estimated to grow from USD 1.62 billion in 2026 to reach USD 3.14 billion by 2031, at a CAGR of 14.12% during the forecast period (2026-2031).
This report is Segmented by Vehicle Type (Passenger Carriers and More), Power Output ( Up To 1 KW and More), Battery Type (Lead-Acid and More), Battery Capacity (Up To 3 KWh and More), Charging Mode (Plug-In Charging and More), Ownership Model (Individual Owner-Drivers and More), and States (Uttar Pradesh, Delhi, and More). The Market Forecasts are Provided in Terms of Value (USD) and Volume (Units).
India Electric Rickshaw Market Trends and Insights
FAME-II Subsidy Extension and State Incentives Accelerating Tier-II Adoption
Federal continuity between the extended FAME-II program and the Electric Mobility Promotion Scheme 2024 keeps per-vehicle subsidies intact, lowering acquisition cost barriers for drivers outside major metros. State top-ups-ranging from purchase rebates to road-tax waivers in Maharashtra, Karnataka, and Delhi-stack further savings, making electric three-wheelers price-competitive with ICE models at the point of sale. Subsidy density correlates strongly with registrations; assessments reveal a 46.16% sales uplift for each standard-deviation rise in state support intensity. Local financiers report shorter payback periods, encouraging broader credit participation. Combined, these fiscal levers push the Indian electric three-wheeler market deeper into cost-sensitive Tier-II clusters where informal transit demand is surging.
Rising Demand for Last-Mile Shared Mobility in Rapidly Urbanising Towns
India's expanding network of mid-sized cities relies heavily on auto-rickshaws to bridge first- and last-mile gaps in public transit. Electric variants cut running expenses to INR 0.50-0.70/km against INR 3-4/km for petrol or CNG, creating immediate earnings upside for owner-drivers. Shared-mobility aggregators such as Uber and Rapido are onboarding e-rickshaws to meet municipal clean-air mandates and rider price sensitivity. High daily utilization amplifies fuel-cost arbitrage, accelerating payback on the higher upfront purchase. Seamless digital booking elevates asset productivity, further reinforcing operator economics and boosting adoption across the Indian electric three-wheeler market.
Fragmented & Informal Financing Channels Constraining Driver Purchases
The lack of scale credit pipelines keeps effective interest rates high and loan-to-value ratios low, dampening uptake among independent drivers whose livelihood depends on daily fare receipts. Technology-risk perceptions lead many lenders to treat electric variants as non-standard assets, constricting credit lines despite lower running costs. Informal money-lenders bridge the gap but charge punitive rates, eroding total cost of ownership benefits. Development-finance institutions advocate blended-finance pools to de-risk retail lending, yet implementation remains slow outside major cities. Until mainstream banks normalize underwriting for electric three-wheelers, growth will undershoot potential in segments most sensitive to up-front affordability.
Other drivers and restraints analyzed in the detailed report include:
- E-Commerce Logistics Embracing Cargo E-Rickshaws for Intra-City Delivery
- Lead-Acid Battery Recycling Ecosystem Lowering Total Cost of Ownership
- Safety Concerns Over Chassis Integrity on Rural Roads
For complete list of drivers and restraints, kindly check the Table Of Contents.
Segment Analysis
India electric rickshaw market share is currently dominated by the passenger carrier segment, which accounted for 83.45% of unit sales in 2025, cementing its role as the backbone of intra-city shared mobility. Dense urban routes and all-day utilization let drivers exploit penny-per-kilometer energy costs, reinforcing segment resilience. Goods carriers, however, are registering the fastest 28.10% CAGR as online retail pushes demand for nimble, emissions-free last-mile delivery. Amazon India, Flipkart, and quick-commerce players are formalizing procurement pipelines with established OEMs, ensuring predictable volume growth. Segment-specific designs such as refrigerated bodies widen addressable markets in food distribution and pharmaceuticals. Higher payload ratings and telematics integration make cargo e-rickshaws an essential piece of future city-logistics blueprints.
In absolute volume terms, passenger variants will continue to dominate the Indian electric three-wheeler market, yet the value contribution from cargo units will rise steadily through premium specification mixes. Tax breaks for commercial vehicles and dedicated micro-fulfillment hubs in Tier-II cities will push cumulative cargo penetration higher. As urban congestion charges tighten, freight operators will prefer electric three-wheelers over light trucks, cementing the segment's long-term upside.
India electric rickshaw market share by power output was led by the 1-1.5 kW motor segment, which accounted for 53.90% of total demand in 2025. This power band delivers sufficient torque for frequent stop-start city driving while conserving battery life, making it ideal for typical passenger operations. Operators value its balanced offering-affordable upfront cost with practical range-especially in high-usage urban duty cycles.
In contrast, powertrains rated above 1.5 kW are witnessing the fastest growth in the India electric rickshaw market, expanding at a 30.95% CAGR as payload demands and gradient-handling requirements rise. The segment is benefiting from advancements in e-axle technologies, including integrated motor controllers and IP-rated enclosures, which enhance durability during India's heavy monsoon conditions and boost fleet confidence.
The higher-powered bracket supports refrigerated cargo, steep-gradient hill-stations, and premium ride-hailing tiers that demand faster trip times. Component suppliers are localizing magnets and stators, cutting imported content and stabilizing price points. As unit economics improve, the Indian electric three-wheeler market size for the above-1.5 kW class is projected to widen its revenue share, ushering in a new competitiveness layer focused on performance rather than solely cost.
Complete Report Scope:
- By Vehicle Type
- Passenger Carriers
- Goods Carriers
- By Power Output
- Up to 1 kW
- 1 - 1.5 kW
- Above 1.5 kW
- By Battery Type
- Lead-Acid
- Lithium-ion (NMC/NCA)
- Lithium-ion (LFP)
- Other Chemistries (Li-Polymer, Ni-MH)
- By Battery Capacity
- Up to 3 kWh
- 3 - 6 kWh
- Above 6 kWh
- By Charging Mode
- Plug-in Charging
- Battery Swapping
- By Ownership Model
- Individual Owner-Drivers
- Fleet Operators
- Aggregators / MaaS Platforms
- By State
- Uttar Pradesh
- Delhi
- Maharashtra
- Bihar
- Rajasthan
- Karnataka
- Tamil Nadu
- Punjab
- Telangana
- Rest of India
List of Companies Covered in this Report:
- Terra Motors India Corp.
- Piaggio Vehicles Pvt. Ltd.
- Mahindra Electric Mobility Ltd.
- Kinetic Green Energy & Power Solutions Ltd.
- ATUL Auto Ltd.
- Saera Electric Auto Pvt. Ltd.
- YC Electric Vehicle
- Goenka Electric Motor Vehicles Pvt. Ltd.
- Udaan E-Rickshaw
- Thukral Electric Bikes
- Mini Metro EV LLP
- E-Ashwa Automotive Pvt. Ltd.
- CityLife EV
- Adapt Motors Pvt. Ltd.
- Vani Electric Vehicles Pvt. Ltd. (Jezza Motors)
- Omega Seiki Mobility
- Euler Motors
- Lohia Auto Industries
- Bajaj Auto Ltd. (Electric 3W Division)
- Altigreen Propulsion Labs
- Gayam Motor Works
- Lectrix EV
- Saarthi E-Rickshaw
Additional Benefits:
- The market estimate (ME) sheet in Excel format
- 3 months of analyst support
TABLE OF CONTENTS
1 Introduction
- 1.1 Study Assumptions & Market Definition
- 1.2 Scope of the Study
2 Research Methodology
3 Executive Summary
4 Market Landscape
- 4.1 Market Overview
- 4.2 Market Drivers
- 4.2.1 FAME-II Subsidy Extension and State Incentives Accelerating Tier-II Adoption
- 4.2.2 Rising Demand for Last-Mile Shared Mobility in Rapidly Urbanising Towns
- 4.2.3 E-Commerce Logistics Embracing Cargo E-Rickshaws for Intra-City Delivery
- 4.2.4 Lead-Acid Battery Recycling Ecosystem Lowering Total Cost of Ownership
- 4.2.5 Battery-as-a-Service Subscription Models Reducing Up-front Capex
- 4.2.6 Mandatory Phase-Out of ICE Three-Wheelers in Delhi-NCR by 2030
- 4.3 Market Restraints
- 4.3.1 Fragmented & Informal Financing Channels Constraining Driver Purchases
- 4.3.2 Safety Concerns Over Chassis Integrity on Rural Roads
- 4.3.3 Quality Variability in Unorganised Lead-Acid Battery Supply Chain
- 4.3.4 Slow Roll-Out of Swappable Battery Standards Hindering Interoperability
- 4.4 Value / Supply-Chain Analysis
- 4.5 Regulatory & Technological Outlook
- 4.6 Porter's Five Forces Analysis
- 4.6.1 Bargaining Power of Buyers
- 4.6.2 Bargaining Power of Suppliers
- 4.6.3 Threat of New Entrants
- 4.6.4 Threat of Substitutes
- 4.6.5 Intensity of Competitive Rivalry
5 Market Size & Growth Forecasts (Value (USD) and Volume (Units))
- 5.1 By Vehicle Type
- 5.1.1 Passenger Carriers
- 5.1.2 Goods Carriers
- 5.2 By Power Output
- 5.2.1 Up to 1 kW
- 5.2.2 1 - 1.5 kW
- 5.2.3 Above 1.5 kW
- 5.3 By Battery Type
- 5.3.1 Lead-Acid
- 5.3.2 Lithium-ion (NMC/NCA)
- 5.3.3 Lithium-ion (LFP)
- 5.3.4 Other Chemistries (Li-Polymer, Ni-MH)
- 5.4 By Battery Capacity
- 5.4.1 Up to 3 kWh
- 5.4.2 3 - 6 kWh
- 5.4.3 Above 6 kWh
- 5.5 By Charging Mode
- 5.5.1 Plug-in Charging
- 5.5.2 Battery Swapping
- 5.6 By Ownership Model
- 5.6.1 Individual Owner-Drivers
- 5.6.2 Fleet Operators
- 5.6.3 Aggregators / MaaS Platforms
- 5.7 By State
- 5.7.1 Uttar Pradesh
- 5.7.2 Delhi
- 5.7.3 Maharashtra
- 5.7.4 Bihar
- 5.7.5 Rajasthan
- 5.7.6 Karnataka
- 5.7.7 Tamil Nadu
- 5.7.8 Punjab
- 5.7.9 Telangana
- 5.7.10 Rest of India
6 Competitive Landscape
- 6.1 Market Concentration
- 6.2 Strategic Moves
- 6.3 Market Share Analysis
- 6.4 Company Profiles
- 6.4.1 Terra Motors India Corp.
- 6.4.2 Piaggio Vehicles Pvt. Ltd.
- 6.4.3 Mahindra Electric Mobility Ltd.
- 6.4.4 Kinetic Green Energy & Power Solutions Ltd.
- 6.4.5 ATUL Auto Ltd.
- 6.4.6 Saera Electric Auto Pvt. Ltd.
- 6.4.7 YC Electric Vehicle
- 6.4.8 Goenka Electric Motor Vehicles Pvt. Ltd.
- 6.4.9 Udaan E-Rickshaw
- 6.4.10 Thukral Electric Bikes
- 6.4.11 Mini Metro EV LLP
- 6.4.12 E-Ashwa Automotive Pvt. Ltd.
- 6.4.13 CityLife EV
- 6.4.14 Adapt Motors Pvt. Ltd.
- 6.4.15 Vani Electric Vehicles Pvt. Ltd. (Jezza Motors)
- 6.4.16 Omega Seiki Mobility
- 6.4.17 Euler Motors
- 6.4.18 Lohia Auto Industries
- 6.4.19 Bajaj Auto Ltd. (Electric 3W Division)
- 6.4.20 Altigreen Propulsion Labs
- 6.4.21 Gayam Motor Works
- 6.4.22 Lectrix EV
- 6.4.23 Saarthi E-Rickshaw
7 Market Opportunities & Future Outlook
- 7.1 White-Space & Unmet-Need Assessment

 2026 年至 2034 年電動三輪車動力傳動系統的市場規模、佔有率、成長、全球產業分析、區域趨勢與預測。
 電動三輪車市場:以三輪車類型、電池類型、應用、國家和地區分類-全球產業分析、市場規模、市場佔有率及2026年至2033年預測
 電動三輪車市場-2026-2032年全球市場預測電動三輪車市場:按推進系統、電池類型、充電基礎設施、應用和銷售管道分類-全球市場預測(2026-2032 年)
 電動三輪車市場分析及預測(至2035年):類型、產品類型、技術、組件、應用、最終用戶、功能、安裝方式、設備、模式電動自行車市場分析及預測(至2035年):類型、產品類型、技術、組件、應用、材料類型、部署模式、最終用戶、功能、安裝模式彈弓/三輪摩托車市場分析及預測(至2035年):類型、產品、技術、應用、最終用戶、功能、安裝類型
 改裝電動三輪車市場-全球產業規模、佔有率、趨勢、機會、預測:按車型、電池容量、電池類型、地區和競爭格局分類,2021-2031年
 電動自行車市場規模、佔有率和趨勢分析報告:按電池、功率輸出、最終用途、地區和細分市場預測(2026-2033 年)
 2026年全球電動三輪車市場報告