


 |
市場調查報告書
商品編碼
2123130
無伺服器計算:市場佔有率分析、產業趨勢與統計及成長預測(2026-2031 年)Serverless Computing - Market Share Analysis, Industry Trends & Statistics, Growth Forecasts (2026 - 2031) |
||||||

※ 本網頁內容可能與最新版本有所差異。詳細情況請與我們聯繫。
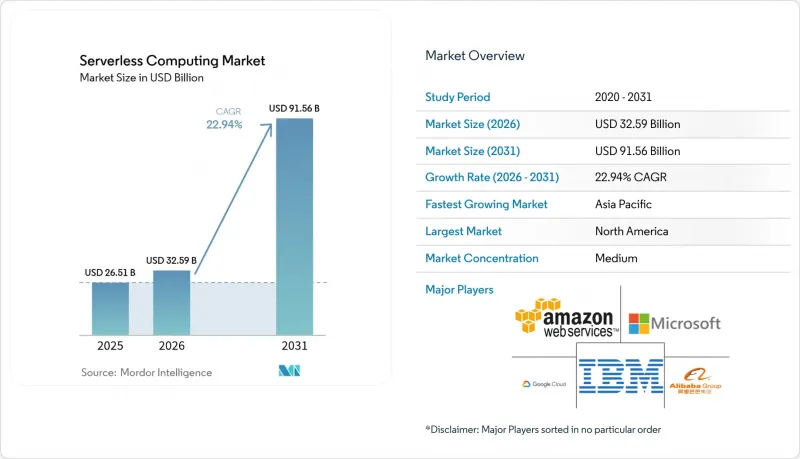
根據 Mordor Intelligence 估計,到 2026 年,無伺服器運算市場價值將達到 325.9 億美元,高於 2025 年的 265.1 億美元,預計到 2031 年將達到 915.6 億美元。
預計 2026 年至 2031 年的複合年成長率為 22.94%。
本報告按服務模式(專業服務和託管服務)、服務類型(功能即服務 (FaaS)、後端即服務 (BaaS) 等)、部署模式(公共雲端、私有雲端等)、最終用戶行業(IT 和電信、BFSI 等)和地區進行分類。
全球無伺服器運算市場趨勢及洞察
隨著北美 BFSI 產業的現代化進程,向事件驅動型微服務的轉變正在加速。
銀行和保險公司正在用精細化的服務取代單一的系統,這些服務能夠近乎即時地回應刷卡、貸款報價和詐欺徵兆。透過利用無伺服器功能,北美主要金融機構已成功將開發週期縮短了35-40%,並將基礎設施成本降低了28.3%,從而騰出預算用於開發新的數位化功能。這種「收費付費」模式非常適合支付和資產管理平台中常見的不規則交易量。此外,API優先的設計簡化了監管審計,因為每個功能都可以獨立地進行日誌記錄、加密和版本控制。隨著零信任規則日益嚴格,銀行、金融服務和保險(BFSI)團隊更傾向於使用臨時運算環境,這種環境既能減少攻擊面,又能滿足嚴格的審計追蹤要求。
歐洲零售和電子商務產業對支援 DevSecOps 的多重雲端管道的需求正在激增。
歐洲零售商正競相遵守 GDPR,同時也要支援即時結帳和個人化優惠。目前,89% 的企業正在至少兩個雲端平台上部署其無伺服器工作負載,以避免供應商鎖定並滿足區域資料居住要求。內建策略引擎會在每次提交程式碼時進行掃描,安全測試已整合到 CI/CD 流程中,金鑰也會自動加密,從而縮短漏洞暴露的時間。透過將安全措施提前到「左側」(開發階段),團隊可以縮短修復時間,更快地發布功能,即使在雙十一和黑色星期五等銷售高峰期也能如此。
高度分散式微函數中的調試和可觀測性挑戰
傳統的應用效能管理 (APM) 代理程式無法追蹤毫秒級的瞬態函數,導致根本原因分析出現盲點。企業報告稱,排查無伺服器應用程式的故障所需時間是排查單體應用程式的 2.4 倍。這是因為日誌分散在整個服務中,而冷啟動會掩蓋延遲異常。雖然新的解決方案可以注入輕量級的跨區 ID,並能匯出到開放標準的後端,但它們的成熟度仍不如主流工具。在追蹤、指標和日誌實現無縫整合之前,規避風險的行業仍會對遷移關鍵業務系統猶豫不決。
細分市場分析
隨著企業優先考慮承包工程,託管服務在2025年佔總收入的61.20%。然而,隨著企業著手進行複雜的現代化項目,專業服務正以17.65%的複合年成長率持續成長,直到2031年。許多受監管的企業正在聘請諮詢合作夥伴,在運作前重新設計事件模式、重構單體應用並檢驗合規性。諮詢團隊整合無伺服器安全模式、策略即代碼和FinOps儀表板,以最大化業務價值。專業服務也支持文化轉型,為產品團隊提供非同步設計和可觀測性最佳實踐的培訓。隨著無伺服器技術的應用範圍擴展到分析、人工智慧和邊緣運算領域,持續管治和平台工程正作為綜合服務與開發支援相結合的方式提供。這種發展趨勢使整合商能夠在維持高利潤成長的同時,加快企業價值的實現速度。
預計到 2025 年,函數即服務 (FaaS) 將佔總支出的 57.30%,並將繼續作為無伺服器運算市場的基礎,直至 2031 年。然而,隨著團隊對整合式身分驗證、儲存和即時同步等更高配置層級的 API 呼叫的需求日益成長,後端即服務 (BaaS) 正以 24.32% 的複合年成長率快速成長。尤其是行動開發人員,他們非常重視登入和推播通知的一鍵整合,這可以將發布週期從數週縮短到數小時。 BaaS 透過卸載例行任務來補充 FaaS,使函數能夠專注於差異化邏輯。整合的 API 閘道可在兩種範式之間統一路由流量,而無伺服器容器則可彌補需要更長時間運行的進程的效能差距。這種廣泛的抽象選項使架構師能夠根據成本、延遲和合規性需求靈活調整組合。
區域分析
預計到2025年,北美將佔無伺服器收入的37.60%,這主要得益於豐富的雲端人才、積極的數位化銀行發展藍圖以及美國聯邦政府的「零信任」指令(該指令鼓勵使用瞬態計算以減少攻擊面)。企業正在利用無伺服器技術實現傳統架構的現代化,透過事件流實現客戶個人化,並運行符合合規要求的日誌記錄管道。加拿大也出現了類似的趨勢,尤其是在整合5G邊緣運算能力的電信業者中。同時,墨西哥的金融科技新創公司正在採用無伺服器技術來安全地擴展支付API。
亞太地區是成長最快的區域,預計到2031年將以19.05%的複合年成長率成長。中國領先的網路公司正在投資原生無伺服器人工智慧服務;印度快速發展的SaaS產業正在採用計量收費模式,以滿足難以預測的全球需求。日本和韓國的製造商正在整合邊緣運算能力以進行預測性維護,而東協的金融科技和電子商務企業正在部署多重雲端無伺服器架構,以低延遲的方式服務本地客戶。 5G MEC、價格合理的雲端資源以及不斷提升的開發人員技能都在加速全部區域的普及應用。
在歐洲,多重雲端仍是一股強勁的趨勢,各組織紛紛採用多雲以滿足GDPR和國家主權法規的要求。英國、德國和法國處於主導,在零售、銀行和公共部門的先導計畫中,共用通用通用的加密、稽核和資料居住藍圖。北歐國家在整合環保資料中心和部署事件驅動電網方面取得了突破性進展。供應商也積極回應,提供區域最佳化的可用區域和高度可移植的運行時環境,在日益嚴格的合規環境下推動業務成長。
其他好處:
- Excel格式的市場預測(ME)表
- 3個月的分析師支持
目錄
第1章:引言
- 研究假設和市場定義
- 調查範圍
第2章:調查方法
第3章執行摘要
第4章 市場狀況
- 市場概覽
- 市場促進因素
- 在北美 BFSI 產業的現代化進程中,向事件驅動型微服務的轉變正在加速。
- 在整個歐洲零售和電子商務領域,對支援 DevSecOps 的多重雲端管道的需求激增。
- 亞洲電信業者正在透過部署邊緣原生 5G MEC 來推動無伺服器技術的應用。
- 即時人工智慧/機器學習推理工作負載推動了醫療領域功能即服務(FaaS)的普及
- 在美國聯邦政府的 IT 領域,政府的零信任政策正在推動無伺服器安全工具鏈的採用。
- 拉丁美洲金融科技生態系中API貨幣化平台的快速擴張
- 市場限制因素
- 高度分散式微函數中的調試和可觀測性挑戰
- 我們專有的事件編配引擎會加劇供應商鎖定風險。
- 多區域無伺服器資料儲存中資料居住要求合規性面臨的挑戰
- 高頻交易和遊戲工作負載中的冷啟動延遲限制
- 價值鏈分析
- 監理展望
- 技術展望
- 波特五力分析
- 投資分析
- 技術概述
- API 閘道器
- Function-as-a-Service(FaaS)
- Backend-as-a-Service(BaaS)
- Database-as-a-Service(DBaaS)
第5章 市場規模與成長預測
- 按服務模式
- 專業服務
- 託管服務
- 按服務類型
- Function-as-a-Service(FaaS)
- Backend-as-a-Service(BaaS)
- API 閘道器
- Container-as-a-Service(CaaS)
- 按部署模式
- 公共雲端
- 私有雲端
- 混合雲端
- 多重雲端
- 按最終用戶行業分類
- 資訊科技/通訊
- BFSI
- 零售與電子商務
- 政府/公共部門
- 醫療保健和生命科學
- 工業和製造業
- 媒體與娛樂
- 其他
- 按地區
- 北美洲
- 美國
- 加拿大
- 墨西哥
- 南美洲
- 巴西
- 阿根廷
- 其他南美國家
- 歐洲
- 英國
- 德國
- 法國
- 義大利
- 西班牙
- 其他歐洲國家
- 北歐的
- 瑞典
- 挪威
- 丹麥
- 芬蘭
- 中東
- 沙烏地阿拉伯
- 阿拉伯聯合大公國
- 土耳其
- 其他中東國家
- 非洲
- 南非
- 奈及利亞
- 埃及
- 其他非洲國家
- 亞太地區
- 中國
- 印度
- 日本
- 韓國
- ASEAN
- 其他亞太國家
- 北美洲
第6章 競爭情勢
- 市場集中度
- 策略趨勢
- 市佔率分析
- 公司簡介
- Amazon Web Services Inc.
- Microsoft Corp.
- Google LLC
- Alibaba Group Holding Ltd.
- IBM Corp.
- Oracle Corp.
- SAP SE
- VMware Inc.
- Red Hat Inc.
- Cloudflare Inc.
- Fastly Inc.
- Tencent Cloud
- Huawei Cloud
- Netlify Inc.
- Vercel Inc.
- DigitalOcean Inc.
- Iron.io
- TriggerMesh Inc.
- Serverless Inc.
- Stackery Inc.
第7章 市場機會與未來展望
According to Mordor Intelligence, serverless computing market size in 2026 is estimated at USD 32.59 billion, growing from 2025 value of USD 26.51 billion with 2031 projections showing USD 91.56 billion, growing at 22.94% CAGR over 2026-2031.
This report is Segmented by Service Model (Professional Services and Managed Services), Service Type (Function-As-A-Service (FaaS), Backend-As-A-Service (BaaS), and More), Deployment Model (Public Cloud, Private Cloud, and More), End-User Industry (IT and Telecommunications, BFSI, and More), and Geography
Global Serverless Computing Market Trends and Insights
Accelerating Shift to Event-Driven Microservices in North American BFSI Modernization
Banks and insurers are replacing monoliths with granular services that react to card swipes, loan quotes and fraud signals in near real time. Using serverless functions, leading North American institutions trimmed development cycles by 35-40% and shaved 28.3% off infrastructure spend, freeing budget for new digital features. The model's pay-per-execute billing fits irregular transaction volumes common in payments and wealth platforms. API-first designs also simplify regulatory audits because each function can log, encrypt and version individually. As zero-trust rules tighten, BFSI teams prefer ephemeral compute that reduces attack surface while meeting stringent audit trails.
Surging Demand for DevSecOps-Ready Multi-Cloud Pipelines Across European Retail and E-commerce
European retailers race to match instant checkout and personalized offers while obeying GDPR. Eighty-nine percent now distribute serverless workloads across at least two clouds to avoid lock-in and maintain regional data residency. Built-in policy engines scan code on every commit, integrate security tests into CI/CD and auto-encrypt secrets, shrinking vulnerability windows. By shifting security left, teams cut remediation time and push features faster during seasonal peaks such as Singles' Day and Black Friday.
Debugging and Observability Gaps in Highly Distributed Micro-Functions
Traditional APM agents cannot trace ephemeral functions that live for milliseconds, leaving blind spots during root-cause analysis. Enterprises report troubleshooting serverless apps takes 2.4 times longer than monoliths because logs scatter across services and cold-starts mask latency outliers. Emerging solutions now inject lightweight span IDs and export them to open-standard back ends, yet maturity lags mainstream tooling. Until traces, metrics and logs consolidate seamlessly, risk-averse sectors will hesitate to migrate mission-critical systems.
Other drivers and restraints analyzed in the detailed report include:
- Roll-out of Edge-Native 5G MEC Driving Serverless Adoption Among Asia Telecom Operators
- Real-Time AI/ML Inference Workloads Propelling Function-as-a-Service Uptake in Healthcare
- Vendor Lock-In Risk Amplified by Proprietary Event Orchestration Engines
For complete list of drivers and restraints, kindly check the Table Of Contents.
Segment Analysis
Managed Services held 61.20% of 2025 revenue as organizations prioritized turnkey operations, but Professional Services is expanding at an 17.65% CAGR to 2031 as firms tackle complex modernization programs. Many regulated enterprises hire consulting partners to redesign event schemas, refactor monoliths and validate compliance before going live. Advisory teams integrate serverless security patterns, policy-as-code and FinOps dashboards to maximize business value.Professional Services also support culture change, training product squads on asynchronous design and observability best practices. As serverless footprints widen to analytics, AI and edge, continuous governance and platform engineering join development assistance in bundled engagements. This evolution sustains high-margin growth for integrators while improving enterprise time-to-value.
Function-as-a-Service captured 57.30% of spending in 2025 and will keep anchoring the serverless computing market through 2031. Yet Backend-as-a-Service is the star growth segment at 24.32% CAGR as teams seek higher-level constructs that collapse authentication, storage and real-time sync into API calls. Mobile developers in particular appreciate one-line integration for login and push notifications, cutting launch cycles from weeks to hours.BaaS complements FaaS by offloading boilerplate tasks, letting functions focus on differentiated logic. Unified API gateways route traffic uniformly across both paradigms, while serverless containers fill performance gaps that demand longer-lived processes. The spectrum of abstractions allows architects to mix and match for cost, latency and compliance needs.
Complete Report Scope:
- By Service Model
- Professional Services
- Managed Services
- By Service Type
- Function-as-a-Service (FaaS)
- Backend-as-a-Service (BaaS)
- API Gateway
- Container-as-a-Service (CaaS)
- By Deployment Model
- Public Cloud
- Private Cloud
- Hybrid Cloud
- Multi-Cloud
- By End-user Industry
- IT and Telecommunications
- BFSI
- Retail and E-commerce
- Government and Public Sector
- Healthcare and Life Sciences
- Industrial and Manufacturing
- Media and Entertainment
- Others
- By Geography
- North America
- United States
- Canada
- Mexico
- South America
- Brazil
- Argentina
- Rest of South America
- Europe
- United Kingdom
- Germany
- France
- Italy
- Spain
- Rest of Europe
- Nordics
- Sweden
- Norway
- Denmark
- Finland
- Middle East
- Saudi Arabia
- United Arab Emirates
- Turkey
- Rest of Middle East
- Africa
- South Africa
- Nigeria
- Egypt
- Rest of Africa
- Asia Pacific
- China
- India
- Japan
- South Korea
- ASEAN
- Rest of Asia Pacific
- North America
Geography Analysis
North America drove 37.60% of 2025 serverless revenue, supported by abundant cloud talent, aggressive digital banking roadmaps, and U.S. federal zero-trust directives that favor ephemeral compute for reduced attack surface. Enterprises leverage serverless to modernize legacy stacks, employ event streams for customer personalization, and run compliance-ready logging pipelines. Canada mirrors these patterns, especially among telcos integrating 5G edge functions, while Mexico's fintech startups adopt serverless to scale payment APIs securely.
Asia Pacific is the fastest-growing region, projected at 19.05% CAGR to 2031. China's internet majors invest in native serverless AI services, and India's booming SaaS sector embraces the pay-as-you-go model to manage unpredictable global demand. Japanese and South Korean manufacturers integrate edge functions for predictive maintenance, whereas ASEAN fintech and e-commerce players deploy multi-cloud serverless stacks to reach regional customers with low latency. The confluence of 5G MEC, affordable cloud spots and developer upskilling accelerates uptake across the region.
Europe maintains a strong position as organizations adopt multi-cloud to satisfy GDPR and state sovereignty rules. The United Kingdom, Germany and France lead with retail, banking and public-sector pilots that share common blueprints for encryption, audit and residency. Nordic countries push boundaries with green data-center integrations and event-driven energy grids. Vendors respond with localized zones and portable runtimes, reinforcing growth despite stricter compliance landscapes.
- Amazon Web Services Inc.
- Microsoft Corp.
- Google LLC
- Alibaba Group Holding Ltd.
- IBM Corp.
- Oracle Corp.
- SAP SE
- VMware Inc.
- Red Hat Inc.
- Cloudflare Inc.
- Fastly Inc.
- Tencent Cloud
- Huawei Cloud
- Netlify Inc.
- Vercel Inc.
- DigitalOcean Inc.
- Iron.io
- TriggerMesh Inc.
- Serverless Inc.
- Stackery Inc.
Additional Benefits:
- The market estimate (ME) sheet in Excel format
- 3 months of analyst support
TABLE OF CONTENTS
1 INTRODUCTION
- 1.1 Study Assumptions and Market Definition
- 1.2 Scope of the Study
2 RESEARCH METHODOLOGY
3 EXECUTIVE SUMMARY
4 MARKET LANDSCAPE
- 4.1 Market Overview
- 4.2 Market Drivers
- 4.2.1 Accelerating shift to event-driven microservices in North American BFSI modernisation
- 4.2.2 Surging demand for DevSecOps-ready multi-cloud pipelines across European retail and e-commerce
- 4.2.3 Roll-out of edge-native 5G MEC driving serverless adoption among Asia telecom operators
- 4.2.4 Real-time AI/ML inference workloads propelling Function-as-a-Service uptake in healthcare
- 4.2.5 Government Zero-Trust mandates boosting serverless security toolchains in US federal IT
- 4.2.6 Rapid expansion of API monetisation platforms in LATAM fintech ecosystems
- 4.3 Market Restraints
- 4.3.1 Debugging and observability gaps in highly distributed micro-functions
- 4.3.2 Vendor lock-in risk amplified by proprietary event orchestration engines
- 4.3.3 Data residency compliance hurdles for multi-region serverless data stores
- 4.3.4 Cold-start latency constraints in high-frequency trading and gaming workloads
- 4.4 Value Chain Analysis
- 4.5 Regulatory Outlook
- 4.6 Technological Outlook
- 4.7 Porter's Five Forces Analysis
- 4.7.1 Bargaining Power of Suppliers
- 4.7.2 Bargaining Power of Buyers
- 4.7.3 Threat of New Entrants
- 4.7.4 Threat of Substitutes
- 4.7.5 Intensity of Competitive Rivalry
- 4.8 Investment Analysis
- 4.9 Technology Snapshot
- 4.9.1 API Gateway
- 4.9.2 Function-as-a-Service (FaaS)
- 4.9.3 Backend-as-a-Service (BaaS)
- 4.9.4 Database-as-a-Service (DBaaS)
5 MARKET SIZE AND GROWTH FORECASTS (VALUE)
- 5.1 By Service Model
- 5.1.1 Professional Services
- 5.1.2 Managed Services
- 5.2 By Service Type
- 5.2.1 Function-as-a-Service (FaaS)
- 5.2.2 Backend-as-a-Service (BaaS)
- 5.2.3 API Gateway
- 5.2.4 Container-as-a-Service (CaaS)
- 5.3 By Deployment Model
- 5.3.1 Public Cloud
- 5.3.2 Private Cloud
- 5.3.3 Hybrid Cloud
- 5.3.4 Multi-Cloud
- 5.4 By End-user Industry
- 5.4.1 IT and Telecommunications
- 5.4.2 BFSI
- 5.4.3 Retail and E-commerce
- 5.4.4 Government and Public Sector
- 5.4.5 Healthcare and Life Sciences
- 5.4.6 Industrial and Manufacturing
- 5.4.7 Media and Entertainment
- 5.4.8 Others
- 5.5 By Geography
- 5.5.1 North America
- 5.5.1.1 United States
- 5.5.1.2 Canada
- 5.5.1.3 Mexico
- 5.5.2 South America
- 5.5.2.1 Brazil
- 5.5.2.2 Argentina
- 5.5.2.3 Rest of South America
- 5.5.3 Europe
- 5.5.3.1 United Kingdom
- 5.5.3.2 Germany
- 5.5.3.3 France
- 5.5.3.4 Italy
- 5.5.3.5 Spain
- 5.5.3.6 Rest of Europe
- 5.5.4 Nordics
- 5.5.4.1 Sweden
- 5.5.4.2 Norway
- 5.5.4.3 Denmark
- 5.5.4.4 Finland
- 5.5.5 Middle East
- 5.5.5.1 Saudi Arabia
- 5.5.5.2 United Arab Emirates
- 5.5.5.3 Turkey
- 5.5.5.4 Rest of Middle East
- 5.5.6 Africa
- 5.5.6.1 South Africa
- 5.5.6.2 Nigeria
- 5.5.6.3 Egypt
- 5.5.6.4 Rest of Africa
- 5.5.7 Asia Pacific
- 5.5.7.1 China
- 5.5.7.2 India
- 5.5.7.3 Japan
- 5.5.7.4 South Korea
- 5.5.7.5 ASEAN
- 5.5.7.6 Rest of Asia Pacific
- 5.5.1 North America
6 COMPETITIVE LANDSCAPE
- 6.1 Market Concentration
- 6.2 Strategic Moves
- 6.3 Market Share Analysis
- 6.4 Company Profiles (includes Global level Overview, Market level overview, Core Segments, Financials as available, Strategic Information, Market Rank/Share for key companies, Products and Services, and Recent Developments)
- 6.4.1 Amazon Web Services Inc.
- 6.4.2 Microsoft Corp.
- 6.4.3 Google LLC
- 6.4.4 Alibaba Group Holding Ltd.
- 6.4.5 IBM Corp.
- 6.4.6 Oracle Corp.
- 6.4.7 SAP SE
- 6.4.8 VMware Inc.
- 6.4.9 Red Hat Inc.
- 6.4.10 Cloudflare Inc.
- 6.4.11 Fastly Inc.
- 6.4.12 Tencent Cloud
- 6.4.13 Huawei Cloud
- 6.4.14 Netlify Inc.
- 6.4.15 Vercel Inc.
- 6.4.16 DigitalOcean Inc.
- 6.4.17 Iron.io
- 6.4.18 TriggerMesh Inc.
- 6.4.19 Serverless Inc.
- 6.4.20 Stackery Inc.
7 MARKET OPPORTUNITIES AND FUTURE OUTLOOK
- 7.1 White-space and Unmet-need Assessment

 叢集運算市場規模、佔有率和成長分析:按叢集類型、部署模式、組件、最終用戶產業和地區分類-2026-2033年產業預測
 2026年全球叢集運算市場報告2026年全球無伺服器PostgreSQL市場報告
 無伺服器運算市場:依服務模式、部署模式、最終使用者和區域分類2026年全球無伺服器運算平台市場報告
 全球無伺服器運算市場規模、佔有率、趨勢和成長分析報告(2026-2034年)
 全球GPU加速AI伺服器市場(按伺服器類型、散熱技術、部署方式、應用領域和最終用戶產業分類)預測(2026-2032年)無伺服器運算市場:按元件、部署模型、組織規模和最終用戶產業分類,全球預測,2026-2032 年無伺服器運算市場 - 2026-2031 年預測
 無伺服器運算市場預測至 2032 年:按服務類型、部署模式、企業規模、最終用戶和地區分類的全球分析