


 |
市場調查報告書
商品編碼
2123065
基礎設施即服務 (IaaS):市場佔有率分析、產業趨勢與統計資料、成長預測(2026-2031 年)Infrastructure As A Service - Market Share Analysis, Industry Trends & Statistics, Growth Forecasts (2026 - 2031) |
||||||

※ 本網頁內容可能與最新版本有所差異。詳細情況請與我們聯繫。
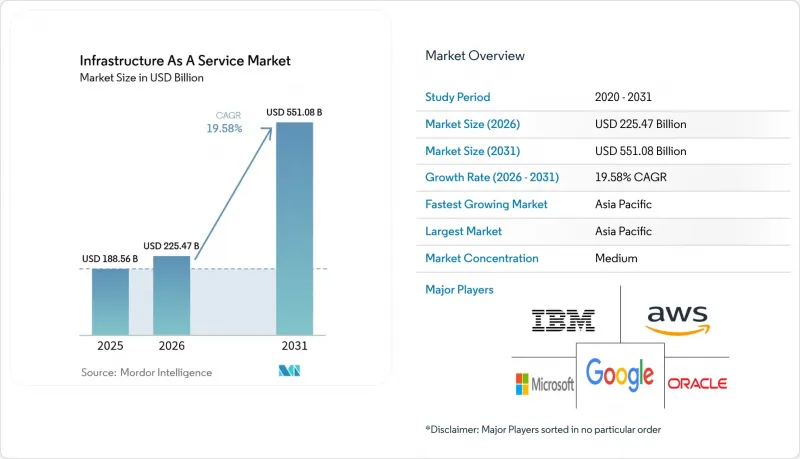
根據 Mordor Intelligence 預測,IaaS(基礎設施即服務)市場規模將從 2025 年的 1,885.6 億美元成長到 2026 年的 2,254.7 億美元,然後在 2031 年達到 5,510.8 億美元,2026 年至 2031 年的複合年成長率為 19.58%。
本報告按部署模式(公共雲端、私有雲端、混合雲端)、服務類型(運算即服務 (CaaS)、儲存即服務 (STaaS)、資料庫/分析即服務 (DBaaS) 等)、最終用戶產業(銀行、金融服務和保險 (BFSI)、IT 和電信、醫療保健和生命科學)以及地區進行分類。
全球基礎設施即服務 (IaaS) 市場趨勢與洞察
對生成式人工智慧基礎設施的需求正在加速成長。
生成式人工智慧訓練叢集需要GPU機架,每個晶片的功耗高達700瓦,預計將推動液冷技術的採用率從2024年資料中心的10%上升到2025年的約20%。超大規模資料中心業者營運商正在圍繞1兆瓦液冷機架重新設計其園區,並採用標準化的400伏直流配電來降低轉換損耗(DataCenterFrontier)。企業也正在效仿,近40%的資料中心營運商計劃在2026年採用液冷技術來託管人工智慧工作負載。這些技術變革正在重塑資料中心的設計藍圖,而人工智慧賦能的設計正成為雲端基礎設施市場的標準要求。
企業正在快速遷移到混合雲和多重雲端。
為了平衡成本和合規性,各組織目前正在將工作負載分散到多個雲端平台。 IBM 於 2024 年以 64 億美元收購 HashiCorp,進一步加速了多重雲端編配的自動化進程。 Oracle 和 Google 的多重雲端合作關係使得 Oracle 資料庫在 Google 區域內的出站流量免費,從而消除了工作負載可攜性的長期障礙。金融業的採用率尤其高,70% 的金融機構已完成試點階段,主要得益於資料居住法規和營運彈性測試的推動。隨著混合模式的擴展,專業服務供應商在管治和安全諮詢服務領域找到了新的收入來源,從而推動了雲端基礎設施市場的良性循環。
電網面臨的限制日益惡化
截至2023年,資料中心已占美國電力消耗量的4.4%,預計到2028年這一比例將達到12%,對現有電網帶來巨大壓力。在曾經的資料中心樞紐——維吉尼亞北部和德克薩斯州,兆瓦級配額如今受到限制,迫使營運商遷往印第安納州和密西西比州以尋求新的電力容量。在愛爾蘭,預計到2030年,該國高達70%的電力將用於數位負載,部分郡縣已凍結新建設。營運商正在透過引入浸沒式冷卻技術來應對這項挑戰,該技術可將設施的電力消耗降低95%,但此類設備升級需要新的資金投入和更長的建設週期。因此,電力供應限制正在減緩雲端基礎設施市場的短期成長。
細分市場分析
預計到2025年,公共雲端將佔總收入的70.34%,這反映了過去十年來企業從本地部署環境遷移到雲端的趨勢。然而,隨著受監管產業將本地控制與外部部署擴充性結合,預計到2031年,混合雲領域將以23.68%的最高複合年成長率成長。領先的金融服務公司認為,混合雲環境是實現客戶體驗目標並順利通過監管審計的關鍵因素。預計到2031年,混合雲部署的雲端基礎設施市場規模將達到1,634億美元,凸顯了混合雲環境在平衡對延遲敏感的工作負載和對合規性要求極高的工作負載方面的重要作用。
AWS Outposts 和 Azure Stack 等私有連接選項的激增正在推動這波混合雲浪潮。芝加哥商品交易所集團 (CME Group) 在 Aurora 中建構的私人 Google Cloud 區域就是一個典型的例子,它既利用了公共雲端工具,又將關鍵業務交易保留在本地。 IBM 收購 HashiCorp 後,強大的編配軟體進一步降低了複雜性門檻。隨著產業的成熟,雲端基礎設施產業正逐漸形成一種趨勢,即不再將採用決策視為非此即彼的選擇,而是將其視為投資組合管理的一部分。
區域分析
到2025年,亞太地區將佔全球整體收入的42.86%,並維持21.02%的最高複合年成長率,這主要得益於中國、日本和印度政府主導的人工智慧計畫對國內雲端服務的補貼。光是中國的「東數據西」舉措每年就將投資4,000億元建立八個超級叢集,將運算資源重新分配到內陸地區,以緩解沿海地區的擁擠。在日本,受AWS 150億美元和Oracle 80億美元投資承諾的推動,預計到2030年,資料中心市場規模將接近2兆日圓(134億美元)。印度則受益於NTT 15億美元的擴張投資以及當地有利於數位基礎建設的稅收優惠政策。
北美仍然是第二大雲中心,但由於現有雲端中心的飽和,其相對成長速度正在放緩。能源限制正促使計畫轉向先前被忽視的州。 AWS 已向印第安納州撥款 110 億美元, 指南針已在密西西比州啟動了一個價值 100 億美元的園區建設,STACK 也承諾在維吉尼亞北部部署超過 1 吉瓦的容量。由加拿大共享服務部推動的加拿大「數位雄心」計畫正在加速聯邦政府對雲端運算的採用。
在歐洲,需求正與碳中和目標相平衡。諸如資料中心監管條例(DORA)之類的法規迫使金融公司實現供應商多元化,而國家能源上限則限制了都柏林和阿姆斯特丹等傳統位置的容量。可再生能源網路和授權支援體係正在幫助柏林、華沙、奧斯陸、蘇黎世、米蘭、維也納和馬賽等新興城市崛起。歐盟在2030年實現資料中心碳中和的目標正在推動對熱能再利用方案和離岸風力發電整合的投資,從而塑造雲端基礎設施市場的下一階段。
其他好處:
- Excel格式的市場預測(ME)表
- 3個月的分析師支持
目錄
第1章:引言
- 研究假設和市場定義
- 調查範圍
第2章:調查方法
第3章執行摘要
第4章 市場狀況
- 市場概覽
- 市場促進因素
- 對生成式人工智慧基礎設施的需求正在加速成長
- 企業向混合雲端和多重雲端的遷移正在激增。
- 超大規模資料中心業者之間的資本投資競爭(到2025年將超過2,500億美元)
- 5G時代邊緣到核心的延遲要求
- 長期綠色能源購電協議正在推動新建資料中心的發展。
- 政府主導的主權人工智慧沙盒要求在每個地區安裝 IaaS 節點。
- 市場限制因素
- 電網面臨的限制日益加劇
- 關於資料主權和域外應用的衝突
- 水冷系統供應鏈中的瓶頸
- 超過 100 兆瓦的超大規模園區,其保險費正在飆升。
- 價值供應鏈分析
- 監理情勢
- 科技趨勢(人工智慧加速器、水冷、零信任架構)
- 波特五力模型
第5章 市場規模與成長預測
- 部署模式
- 公共雲端
- 私有雲端
- 混合雲端
- 按服務類型
- Compute as a Service(CaaS)
- Storage as a Service(STaaS)
- 網路和 CDN
- 資料庫/分析即服務 (DBaaS)
- 災難復原即服務 (DRaaS)
- 託管主機/專用雲
- 按最終用戶行業分類
- BFSI
- 資訊科技/通訊
- 醫療保健和生命科學
- 媒體與娛樂
- 零售與電子商務
- 政府/公共部門
- 製造業/汽車
- 按地區
- 北美洲
- 美國
- 加拿大
- 墨西哥
- 南美洲
- 巴西
- 阿根廷
- 其他南美國家
- 歐洲
- 英國
- 德國
- 法國
- 俄羅斯
- 其他歐洲國家
- 亞太地區
- 中國
- 日本
- 印度
- 韓國
- 澳洲
- 其他亞太國家
- 中東和非洲
- 中東
- UAE
- 沙烏地阿拉伯
- 土耳其
- 其他中東國家
- 非洲
- 南非
- 奈及利亞
- 其他非洲國家
- 中東
- 北美洲
第6章 競爭情勢
- 市場集中度
- 策略趨勢
- 市佔率分析
- 公司簡介
- Amazon Web Services(AWS)
- Microsoft Azure
- Google Cloud Platform(GCP)
- Alibaba Cloud
- IBM Cloud
- Oracle Cloud Infrastructure(OCI)
- Tencent Cloud
- Huawei Cloud
- OVHcloud
- DigitalOcean
- Rackspace Technology
- Hetzner
- Equinix Metal
- Cloudflare Workers/R2
- Linode/Akamai
- Oracle Cloud(Japan)
- Liquid Sky(Africa)
- Wasabi Technologies
- Scaleway
- SAP Business Technology Platform(BTP-IaaS portion)
第7章 市場機會與未來展望
According to Mordor Intelligence, the infrastructure as a service market size is expected to grow from USD 188.56 billion in 2025 to USD 225.47 billion in 2026 and is forecast to reach USD 551.08 billion by 2031 at 19.58% CAGR over 2026-2031.
This report is Segmented by Deployment Mode (Public Cloud, Private Cloud and Hybrid Cloud), Service Type(Compute As A Service (CaaS), Storage As A Service (STaaS), Database / Analytics As A Service (DBaaS) and More), End-User Industry(BFSI, IT and Telecom, Healthcare and Life Sciences) and Geography.
Global Infrastructure As A Service Market Trends and Insights
Accelerating Gen-AI Infrastructure Demand
Generative-AI training clusters require GPU racks drawing 700 W per chip, pushing liquid cooling adoption from 10% of data halls in 2024 to an estimated 20% in 2025. Hyperscalers now redesign campuses around 1 MW liquid-cooled racks, standardizing 400 V DC power distribution to curtail conversion losses, DataCenterFrontier. Enterprises echo the trend: nearly 40% of data-center operators plan to use liquid cooling by 2026 to host AI workloads. These technical shifts reshape facility blueprints, making AI-ready designs a default requirement across the cloud infrastructure market.
Enterprise Hybrid and Multi-Cloud Migration Spike
Organizations now spread workloads across multiple clouds to balance cost and compliance. IBM's USD 6.4 billion HashiCorp acquisition in 2024 deepens automation for multi-cloud orchestration. Oracle's and Google's multicloud tie-up eliminates egress fees for Oracle Database inside Google regions, removing a long-standing barrier to workload portability. Banking adoption is especially strong: 70% of institutions have moved beyond pilots, spurred by data-residency rules and operational-resilience tests. As hybrid patterns scale, specialized service providers find new revenue in governance and security advisory, reinforcing a virtuous cycle for the cloud infrastructure market.
Escalating Energy-Grid Constraints
Data centers already drew 4.4% of US electricity in 2023; the share may hit 12% by 2028, stressing legacy grids. Northern Virginia and Texas, once prime hubs, now ration megawatt allocations, sending operators to Indiana or Mississippi for fresh capacity. Ireland anticipates up to 70% of national power heading to digital loads by 2030, prompting moratoriums in some counties. Operators respond with immersion cooling that cuts facility power use by 95%, yet those retrofits demand fresh capital and extended build timelines. Limited electricity, therefore, slows the near-term expansion of the cloud infrastructure market.
Other drivers and restraints analyzed in the detailed report include:
- Hyperscaler CAPEX Race Exceeding USD 250 Billion
- Edge-to-Core Latency Requirements in the 5G Era
- Data-Sovereignty and Extraterritoriality Conflicts
For complete list of drivers and restraints, kindly check the Table Of Contents.
Segment Analysis
Public cloud held 70.34% of revenue in 2025, a reflection of a decade-long migration away from on-premises stacks. The hybrid tier, however, records the fastest 23.68% CAGR through 2031 as regulated industries mesh on-prem control with off-prem scale. Financial-services leaders credit hybrid setups for meeting customer-experience targets while passing regulatory audits. The cloud infrastructure market size for hybrid deployments is projected to reach USD 163.4 billion by 2031, underscoring its role in balancing latency-sensitive and compliance-critical workloads.
A sharp increase in private connectivity options such as AWS Outposts and Azure Stack supports this hybrid wave. CME Group's private Google Cloud region in Aurora illustrates how mission-critical trading stays local yet leverages public-cloud tooling. Multifaceted orchestration software-boosted by IBM's HashiCorp deal-lowers complexity barriers. As maturity rises, the cloud infrastructure industry increasingly views deployment decisions as a portfolio exercise rather than a binary choice.
Complete Report Scope:
- By Deployment Mode
- Public Cloud
- Private Cloud
- Hybrid Cloud
- By Service Type
- Compute as a Service (CaaS)
- Storage as a Service (STaaS)
- Networking & CDN
- Database / Analytics as a Service (DBaaS)
- Disaster-Recovery as a Service (DRaaS)
- Managed Hosting / Dedicated Cloud
- By End-user Industry
- BFSI
- IT & Telecom
- Healthcare & Life Sciences
- Media & Entertainment
- Retail & e-Commerce
- Government & Public Sector
- Manufacturing & Automotive
- By Geography
- North America
- United States
- Canada
- Mexico
- South America
- Brazil
- Argentina
- Rest of South America
- Europe
- United Kingdom
- Germany
- France
- Russia
- Rest of Europe
- Asia-Pacific
- China
- Japan
- India
- South Korea
- Australia
- Rest of Asia-Pacific
- Middle East and Africa
- Middle East
- UAE
- Saudi Arabia
- Turkey
- Rest of the Middle East
- Africa
- South Africa
- Nigeria
- Rest of Africa
- Middle East
- North America
Geography Analysis
Asia Pacific owns 42.86% of global revenue in 2025 and sustains the fastest 21.02% CAGR as sovereign AI programs in China, Japan, and India funnel subsidies into domestic clouds. China's East Data-West initiative alone channels CNY 400 billion annually toward eight megaclusters, redistributing computing inland and lowering coastal congestion. Japan approaches JPY 2 trillion (USD 13.4 billion) in data-center value by 2030, buoyed by AWS's USD 15 billion and Oracle's USD 8 billion pledges. India gains from NTT's USD 1.5 billion expansion and local tax incentives favoring digital infrastructure.
North America remains the second-largest base but sees relative growth slow as legacy hubs saturate. Energy limitations redirect projects to overlooked states: AWS earmarks USD 11 billion for Indiana, Compass breaks ground on a USD 10 billion Mississippi campus, and STACK commits over 1 GW in Northern Virginia. Canada's Digital Ambition program accelerates federal cloud adoption, propelled by Shared Services Canada's brokerage role.
Europe balances demand with carbon-neutral targets. Regulations such as DORA compel financial firms to diversify providers while national energy caps limit capacity in traditional locations like Dublin and Amsterdam. Alternative metros-Berlin, Warsaw, Oslo, Zurich, Milan, Vienna, and Marseille-rise thanks to renewable grids and supportive permitting regimes. The EU's aim for zero-carbon data centers by 2030 spurs investment in heat-reuse schemes and offshore wind tie-ins, shaping the next phase of the cloud infrastructure market.
- Amazon Web Services (AWS)
- Microsoft Azure
- Google Cloud Platform (GCP)
- Alibaba Cloud
- IBM Cloud
- Oracle Cloud Infrastructure (OCI)
- Tencent Cloud
- Huawei Cloud
- OVHcloud
- DigitalOcean
- Rackspace Technology
- Hetzner
- Equinix Metal
- Cloudflare Workers / R2
- Linode / Akamai
- Oracle Cloud (Japan)
- Liquid Sky (Africa)
- Wasabi Technologies
- Scaleway
- SAP Business Technology Platform (BTP-IaaS portion)
Additional Benefits:
- The market estimate (ME) sheet in Excel format
- 3 months of analyst support
TABLE OF CONTENTS
1 INTRODUCTION
- 1.1 Study Assumptions & Market Definition
- 1.2 Scope of the Study
2 RESEARCH METHODOLOGY
3 EXECUTIVE SUMMARY
4 MARKET LANDSCAPE
- 4.1 Market Overview
- 4.2 Market Drivers
- 4.2.1 Accelerating Gen-AI infrastructure demand
- 4.2.2 Enterprise hybrid & multi-cloud migration spike
- 4.2.3 Hyperscaler CAPEX race (more than USD 250 billion in 2025)
- 4.2.4 Edge-to-core latency requirements in 5G era
- 4.2.5 Long-duration green-energy PPAs unlocking new DC sites
- 4.2.6 Government sovereign-AI sandboxes mandating local IaaS nodes
- 4.3 Market Restraints
- 4.3.1 Escalating energy-grid constraints
- 4.3.2 Data-sovereignty & extraterritoriality conflicts
- 4.3.3 Liquid-cooling supply-chain bottlenecks
- 4.3.4 Surging insurance premiums for more than 100 MW hyperscale campuses
- 4.4 Value/Supply-Chain Analysis
- 4.5 Regulatory Landscape
- 4.6 Technological Outlook (AI accelerators, liquid cooling, Zero-Trust fabrics)
- 4.7 Porter's Five Forces
- 4.7.1 Bargaining Power of Suppliers
- 4.7.2 Bargaining Power of Buyers
- 4.7.3 Threat of New Entrants
- 4.7.4 Threat of Substitutes
- 4.7.5 Intensity of Competitive Rivalry
5 MARKET SIZE AND GROWTH FORECASTS (VALUE)
- 5.1 By Deployment Mode
- 5.1.1 Public Cloud
- 5.1.2 Private Cloud
- 5.1.3 Hybrid Cloud
- 5.2 By Service Type
- 5.2.1 Compute as a Service (CaaS)
- 5.2.2 Storage as a Service (STaaS)
- 5.2.3 Networking & CDN
- 5.2.4 Database / Analytics as a Service (DBaaS)
- 5.2.5 Disaster-Recovery as a Service (DRaaS)
- 5.2.6 Managed Hosting / Dedicated Cloud
- 5.3 By End-user Industry
- 5.3.1 BFSI
- 5.3.2 IT & Telecom
- 5.3.3 Healthcare & Life Sciences
- 5.3.4 Media & Entertainment
- 5.3.5 Retail & e-Commerce
- 5.3.6 Government & Public Sector
- 5.3.7 Manufacturing & Automotive
- 5.4 By Geography
- 5.4.1 North America
- 5.4.1.1 United States
- 5.4.1.2 Canada
- 5.4.1.3 Mexico
- 5.4.2 South America
- 5.4.2.1 Brazil
- 5.4.2.2 Argentina
- 5.4.2.3 Rest of South America
- 5.4.3 Europe
- 5.4.3.1 United Kingdom
- 5.4.3.2 Germany
- 5.4.3.3 France
- 5.4.3.4 Russia
- 5.4.3.5 Rest of Europe
- 5.4.4 Asia-Pacific
- 5.4.4.1 China
- 5.4.4.2 Japan
- 5.4.4.3 India
- 5.4.4.4 South Korea
- 5.4.4.5 Australia
- 5.4.4.6 Rest of Asia-Pacific
- 5.4.5 Middle East and Africa
- 5.4.5.1 Middle East
- 5.4.5.1.1 UAE
- 5.4.5.1.2 Saudi Arabia
- 5.4.5.1.3 Turkey
- 5.4.5.1.4 Rest of the Middle East
- 5.4.5.2 Africa
- 5.4.5.2.1 South Africa
- 5.4.5.2.2 Nigeria
- 5.4.5.2.3 Rest of Africa
- 5.4.5.1 Middle East
- 5.4.1 North America
6 COMPETITIVE LANDSCAPE
- 6.1 Market Concentration
- 6.2 Strategic Moves
- 6.3 Market Share Analysis
- 6.4 Company Profiles (includes Global level Overview, Market level overview, Core Segments, Financials as available, Strategic Information, Market Rank/Share, Products & Services, Recent Developments)
- 6.4.1 Amazon Web Services (AWS)
- 6.4.2 Microsoft Azure
- 6.4.3 Google Cloud Platform (GCP)
- 6.4.4 Alibaba Cloud
- 6.4.5 IBM Cloud
- 6.4.6 Oracle Cloud Infrastructure (OCI)
- 6.4.7 Tencent Cloud
- 6.4.8 Huawei Cloud
- 6.4.9 OVHcloud
- 6.4.10 DigitalOcean
- 6.4.11 Rackspace Technology
- 6.4.12 Hetzner
- 6.4.13 Equinix Metal
- 6.4.14 Cloudflare Workers / R2
- 6.4.15 Linode / Akamai
- 6.4.16 Oracle Cloud (Japan)
- 6.4.17 Liquid Sky (Africa)
- 6.4.18 Wasabi Technologies
- 6.4.19 Scaleway
- 6.4.20 SAP Business Technology Platform (BTP-IaaS portion)
7 MARKET OPPORTUNITIES AND FUTURE OUTLOOK
- 7.1 White-space & Unmet-Need Assessment

 基礎設施即服務 (IaaS) 全球市場規模、佔有率、趨勢和成長分析報告(2026-2034 年)
 基礎設施即服務 (IaaS) 市場:全球市場預測,2026-2032 年
 基礎設施即服務 (IaaS) 市場預測 2034 年-按部署類型、服務類型、企業規模、工作負載類型、產業和地區分類的全球分析硬體即服務 (HaaS) 市場:2026-2032 年全球市場預測(按組件、外形規格、連接方式、經營模式、最終用戶產業、部署類型和組織規模分類)
 2026-2030年全球基礎設施即服務(IaaS)市場
 基礎設施即服務 (IaaS) 市場報告:按部署類型、解決方案、最終用戶、產業和地區分類 (2026–2034)
 一體化基礎設施市場:按產業、技術組件、部署模式、組織規模和地區分類基礎設施即服務 (IaaS) 市場:按元件、部署類型、使用者類型、產業和地區分類
 2026年全球硬體即服務市場報告2026年全球基礎設施即服務(IaaS)市場報告