


 |
市場調查報告書
商品編碼
2123053
自助式商業智慧:市場佔有率分析、產業趨勢與統計、成長預測(2026-2031 年)Self-service BI - Market Share Analysis, Industry Trends & Statistics, Growth Forecasts (2026 - 2031) |
||||||

※ 本網頁內容可能與最新版本有所差異。詳細情況請與我們聯繫。
根據 Mordor Intelligence 預測,自助式 BI 市場規模將從 2025 年的 71 億美元成長到 2026 年的 79.1 億美元,然後在 2031 年達到 135.9 億美元,2026 年至 2031 年的複合年成長率為 11.41%。
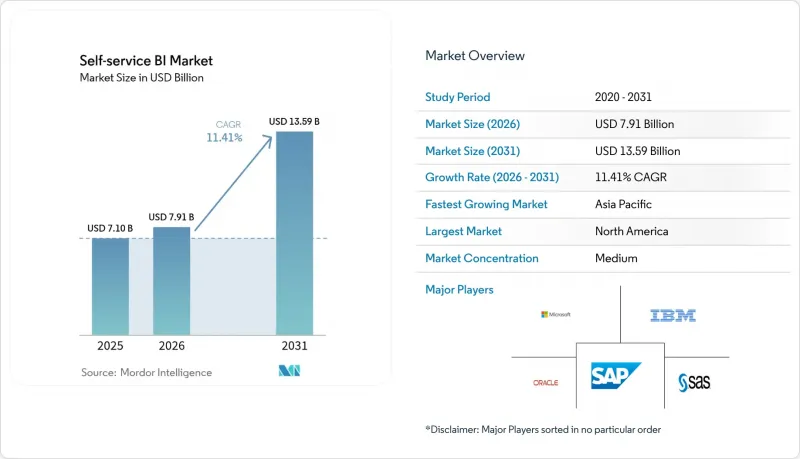
本報告按組件(軟體和服務)、部署模式(雲端/按需部署和本地部署)、應用程式(銷售和行銷管理、客戶參與和分析、詐欺和安全管理等)、最終用戶行業(銀行、金融服務和保險、醫療保健、製造業等)、組織規模(大型企業和中小企業)以及地區進行細分。市場預測以美元計價。
全球自助式商業智慧市場趨勢與洞察
利用低程式碼/無程式碼工具實現分析民主化
低程式碼介面使業務人員無需依賴開發人員即可建立儀表板。這種轉變在北美最為顯著,80% 的主管認為,決策速度的提升得益於資料存取量的增加。公民資料科學家將自身專業知識與簡化的工具結合,挖掘出傳統 BI 團隊常常忽略的模式,使分析效率提高了 74%。那些將民主化與強大的語義層結合的公司,減少了積壓工作的交接,並在關鍵的營運窗口期內交付了洞察,從而確保了行動的有效性。這種文化轉變擴展了平台評估標準,從功能深度轉向了對非技術專業人員的易用性,最終促成了以直覺的拖放式創作和應用內指導為核心的平台整合。
雲端資料倉儲的激增正在加速自助服務的普及。
亞太地區的企業正透過將資料存儲在雲端,跨越傳統架構,消除曾經限制並發 BI 執行的瓶頸。隨著雲端資料倉儲市場以 27.64% 的複合年成長率 (CAGR) 成長,分析團隊現在無需排隊即可查詢最新數據,從而將報告產生時間縮短高達 40%。將自助式部署與資料倉儲現代化結合的企業,與孤立的部署方式相比,獲取洞察的時間縮短了三分之一。此外,這些資料倉儲內建的集中式管治提高了資料質量,並確保了跨部門指標使用的一致性。
由於視覺化工具管理不善而導致的影子 IT 風險
未經適當審查就實施工具會導致關鍵績效指標 (KPI) 不一致,並造成高度違規資料集洩露,每次違規平均給公司造成 103 萬美元的損失。行銷和財務部門經常犯下此類違規行為,因為他們在快速迭代的工作中往往會繞過 IT 部門。業內領導者正在實施目錄主導管治、自動化資料處理歷程和基於角色的存取控制,以在降低風險的同時保持敏捷性。因此,工具採用率比完全封閉式方法高出 45%。
細分市場分析
軟體部門仍然是公司收入的支柱,但業務收益的成長速度更快,複合年成長率高達 14.92%。將平台購買與培訓項目結合的企業,其採用率比僅購買工具的企業高出 45%。市場需求正轉向持續賦能訂閱服務,涵蓋資料素養技能提升與管治審計。因此,實施專家正在打包特定產業的操作手冊,將儀錶板與行業特定的關鍵績效指標 (KPI) 相匹配,並加快價值實現速度。預計到 2031 年,自助式商業智慧 (BI) 服務市場規模將達到 58.3 億美元,反映出市場對人工專業知識和自動化技術的持續需求。
同時,軟體供應商優先考慮人工智慧功能的功能相容性,透過添加自然語言查詢(NLQ)、自動化洞察和嵌入式模式來維持其競爭優勢。持續的更新周期促使企業傾向於模組化架構,以便在不移除語意層的情況下更換分析引擎。這種方法可以緩解對供應商鎖定的擔憂,並支援隨著人工智慧功能成熟而不斷發展的多工具環境。
雲端採用在應用和發展動能方面均呈現上升趨勢,目前已佔營收的 72.40%,用戶數量年複合成長率 (CAGR) 為 13.24%。規模經濟使中型企業無需資本投入即可部署企業級分析,進而與大型企業處於同等地位。此外,分散式團隊可以在共用工作空間上即時協作,加快回饋循環。安全措施也得到了改進,靜態資料加密、私人連結和區域資料中心等措施現已滿足大多數監管審計要求,緩解了人們先前對公共雲端的擔憂。
在資料儲存位置受到嚴格監管的行業中,本地部署解決方案仍然佔據主導地位。然而,即使在這些產業中,混合架構也正變得越來越普遍。敏感資料表保留在本地,而聚合模型則同步到雲端,實現廣泛的分析。隨著超大規模資料中心業者在預測期內將商業智慧 (BI) 與其儲存和人工智慧 (AI) 服務緊密整合,基於雲端的自助式 BI 預計將佔據略高於 80.85% 的市場佔有率。
區域分析
北美地區持續佔據自助式商業智慧市場41.50%的佔有率,這得益於低程式碼平台的早期應用以及領先供應商的存在。該地區的金融服務和醫療保健機構正在將自然語言查詢整合到日常營運中,透過成熟的管治方案保持較高的用戶滿意度並有效控制影子IT。研發投資的重點在於提升高階人工智慧的可解釋性,開發能夠在高度監管的環境下解釋推薦邏輯的系統。儘管跨境資料共用的監管仍是關注的焦點,但該地區先進的雲端基礎設施持續吸引許多創新分析新創公司,這些公司正在不斷拓展平台生態系統。
亞太地區是成長最快的地區,年複合成長率高達13.50%。中國、印度、日本和澳洲的需求強勁,國內主要雲端公司和超大規模資料中心業者都在大力投資資料中心。該地區的中小型企業正在利用行動優先分析來克服桌面設備短缺的問題,智慧型手機儀錶板已成為許多第一線員工的主要介面。資料管治領域的人才短缺問題依然存在,促使各國政府和學術機構推出認證項目,預計這些限制將在2027年後得到緩解。在日本和韓國,預測性維護在製造業領域日益普及,因為它與「工業4.0」藍圖相契合。同時,在新加坡等金融中心,客戶分析對於打造區域銀行服務的差異化優勢變得越來越重要。
在歐洲,受嚴格的隱私法規推動,雲端技術的普及正在穩步推進。各組織機構透過採用支援精細化授權管理和本地資料處理的平台,在資料民主化和GDPR合規性之間尋求平衡。多語言自然語言介面尤其受到重視,先導計畫顯示,非技術人員的參與度提高了50%。在西歐,隨著監管機構明確加密和本地容錯移轉符合主權要求,雲端遷移正在加速進行。在東歐,波蘭、羅馬尼亞和捷克共和國正憑藉大量數位轉型資金迅速追趕。雖然零售和客製化製造業佔據了大部分需求,但開放原始碼替代方案也正獲得那些擔心被專有供應商鎖定的機構的支援。
在南美洲、中東和非洲,商業智慧的應用仍處於起步階段,但潛力巨大。在拉丁美洲,巴西和墨西哥在應用方面處於領先地位,電信公司和銀行都在尋求即時洞察客戶趨勢。在中東,波灣合作理事會(GCC)成員國政府走在投資前沿,利用商業智慧(BI)促進經濟多元化並支持智慧城市建設。在非洲,不同地區的應用情況不盡相同,南非在企業應用方面處於領先地位,而奈及利亞和肯亞則憑藉其金融科技生態系統正在迅速發展。在全部區域,由於舊有系統的應用有限,雲端解決方案更受青睞;在桌上型電腦普及率低的地區,行動儀錶板正在彌補基礎設施的不足。
其他好處:
- Excel格式的市場預測(ME)表
- 3個月的分析師支持
目錄
第1章:引言
- 研究假設和市場定義
- 調查範圍
第2章:調查方法
第3章執行摘要
第4章 市場狀況
- 市場概覽
- 市場促進因素
- 北美地區使用低程式碼/無程式碼工具進行分析的普及
- 雲端資料倉儲的激增正在加速亞太地區自助服務的普及。
- 歐洲自然語言查詢中生成式人工智慧的整合
- 銀行、金融服務和零售業對 SaaS 供應商提供的嵌入式分析功能的需求日益成長。
- 中型企業數據素養提升計畫的增加
- 為確保符合資料居住要求而製定的法規正在推動以本地為中心的 BI 平台(MEA)的發展。
- 市場限制因素
- 影子IT風險源自於未管理的資料視覺化工具
- 新興經濟體資料管治人才短缺
- 從傳統 BI 遷移到自助式堆疊的成本相對較高。
- 由於專有語義層而導致的供應商鎖定問題令人擔憂
- 價值供應鏈分析
- 技術展望
- 監理展望
- 波特五力分析
第5章 市場規模與成長預測
- 按組件
- 軟體
- 服務
- 按部署模式
- 雲端/按需
- 現場
- 透過使用
- 銷售和行銷管理
- 客戶參與與分析
- 詐欺防制和安全管理
- 預測性保護
- 風險與合規管理
- 供應鍊和採購
- 營運管理
- 按最終用戶行業分類
- BFSI
- 零售與電子商務
- 衛生保健
- 製造業
- 電訊
- 媒體與娛樂
- 運輸/物流
- 能源公用事業
- 政府/國防
- 按組織規模
- 大公司
- 中小企業
- 按地區
- 北美洲
- 美國
- 加拿大
- 墨西哥
- 南美洲
- 巴西
- 阿根廷
- 其他南美國家
- 歐洲
- 德國
- 英國
- 法國
- 義大利
- 西班牙
- 其他歐洲國家
- 亞太地區
- 中國
- 日本
- 韓國
- 印度
- 其他亞太國家
- 中東和非洲
- 阿拉伯聯合大公國
- 沙烏地阿拉伯
- 南非
- 其他中東和非洲國家
- 北美洲
第6章 競爭情勢
- 市場集中度
- 策略趨勢
- 市佔率分析
- 公司簡介
- Microsoft Corporation
- SAP SE
- Salesforce(Tableau)
- Qlik Tech Intl.
- IBM Corporation
- Oracle Corporation
- SAS Institute
- MicroStrategy Inc.
- TIBCO Software
- Zoho Corporation(Analytics)
- Amazon Web Services(QuickSight)
- Google LLC(Looker)
- Domo Inc.
- Sisense Inc.
- ThoughtSpot Inc.
- Pyramid Analytics
- Yellowfin BI
- GoodData Corp.
- Board International
- Infor(Birst)
- Alibaba Cloud(Quick BI)
- Dundas Data Visualization
- SentryOne(BI Sentry)
- Phocas Software
第7章 市場機會與未來展望
According to Mordor Intelligence, the self-service BI market size is expected to grow from USD 7.10 billion in 2025 to USD 7.91 billion in 2026 and is forecast to reach USD 13.59 billion by 2031 at 11.41% CAGR over 2026-2031.
This report is Segmented by Component (Software and Services), Deployment Model (Cloud / On-Demand and On-Premises), Application (Sales and Marketing Management, Customer Engagement and Analysis, Fraud and Security Management and More), End-User Industry (BFSI, Healthcare, Manufacturing and More), Organization Size ( Large Enterprises and SMEs), Geography. The Market Forecasts are Provided in Terms of Value (USD).
Global Self-service BI Market Trends and Insights
Democratization of analytics via low-code/no-code tools
Low-code interfaces let business professionals create dashboards without relying on developers, a shift most visible in North America where 80% of executives credit wider data access for faster decisions. Productivity for analytical tasks has risen 74% as citizen data scientists pair domain knowledge with simplified tooling, unearthing patterns traditional BI teams often overlook. Companies that married democratization with robust semantic layers cut backlog hand-offs and delivered insight within the operational window where actions still matter. This cultural change is expanding platform evaluation criteria from feature depth to the ease of onboarding non-technical staff, driving platform consolidation around intuitive drag-and-drop authoring and in-app guidance.
Surge in cloud-based data warehouses accelerating self-service adoption
Asia-Pacific organizations are leapfrogging legacy stacks by landing data in the cloud, eliminating bottlenecks that once restricted BI concurrency. With the cloud warehouse segment itself climbing at 27.64% CAGR, analytics teams now query fresh data without queuing jobs, shrinking report time by as much as 40%. Firms that align self-service rollouts with warehouse modernization gain triple-speed time-to-insight compared with siloed deployments. Centralized governance baked into these warehouses also raises data quality, enabling consistent metrics across departments.
Shadow-IT risks from uncontrolled visualization tools
Unvetted tool adoption has generated conflicting KPIs and exposed sensitive datasets, costing non-compliant firms USD 1.03 million on average per incident. Marketing and finance units are frequent offenders because rapid iterations tempt them to sidestep IT. Best-in-class enterprises deploy catalog-driven governance, automated lineage, and role-based access that preserve agility yet curb risk, yielding 45% higher adoption than blanket lockdown approaches.
Other drivers and restraints analyzed in the detailed report include:
- Integration of generative AI for natural-language querying
- Embedded analytics demand from SaaS vendors
- Shortage of data-governance talent in emerging economies
For complete list of drivers and restraints, kindly check the Table Of Contents.
Segment Analysis
The software segment continues to anchor revenue, yet services revenue is compounding faster at 14.92% CAGR. Organizations that pair platform purchases with training programs report adoption rates 45% higher than tool-only buyers. Demand is shifting toward continuous enablement subscriptions that cover data-literacy upskilling and governance audits. As a result, implementation specialists are packaging industry-specific playbooks, aligning dashboards with vertical KPIs, and expediting time-to-value. The self-service BI market size for services is projected to reach USD 5.83 billion by 2031, reflecting sustained appetite for human expertise alongside automation.
Software vendors, meanwhile, prioritize AI feature parity, adding NLQ, automated insights, and embedded modes to remain competitive. The relentless update cadence pushes enterprises to favor modular architectures that let them swap analytic engines without ripping out semantic layers. This posture mitigates vendor lock-in concerns and supports mixed-tool environments that evolve as AI capabilities mature.
Cloud deployments own both usage and momentum, commanding 72.40% of current revenue and adding users at a 13.24% CAGR. Economies of scale let mid-market firms implement enterprise-grade analytics without capital outlay, leveling the playing field with larger peers. Moreover, distributed teams can collaborate on shared workspaces in real time, accelerating feedback loops. Security postures have evolved; encryption-at-rest, private links, and regional data centers now satisfy most regulatory audits, tempering earlier reservations about public cloud.
On-premises solutions persist in heavily regulated verticals where data residency is mandatory. Yet even there, hybrid designs are common: sensitive tables stay onsite while aggregated models sync to the cloud for broad exploration. Over the forecast period, the self-service BI market share for cloud is expected to edge past 80.85% as hyperscalers integrate BI tightly with their storage and AI services.
Complete Report Scope:
- By Component
- Software
- Services
- By Deployment Model
- Cloud / On-Demand
- On-Premises
- By Application
- Sales and Marketing Management
- Customer Engagement and Analysis
- Fraud and Security Management
- Predictive Asset Maintenance
- Risk and Compliance Management
- Supply Chain and Procurement
- Operations Management
- By End-user Industry
- BFSI
- Retail and E-commerce
- Healthcare
- Manufacturing
- Telecommunications
- Media and Entertainment
- Transportation and Logistics
- Energy and Utilities
- Government and Defense
- By Organization Size
- Large Enterprises
- Small and Medium-sized Enterprises (SMEs)
- By Geography
- North America
- United States
- Canada
- Mexico
- South America
- Brazil
- Argentina
- Rest of South America
- Europe
- Germany
- United Kingdom
- France
- Italy
- Spain
- Rest of Europe
- Asia-Pacific
- China
- Japan
- South Korea
- India
- Rest of Asia-Pacific
- Middle East and Africa
- United Arab Emirates
- Saudi Arabia
- South Africa
- Rest of Middle East and Africa
- North America
Geography Analysis
North America retains 41.50% of self-service BI market revenue, buoyed by early adoption of low-code platforms and the presence of leading vendors. Financial services and healthcare providers there embed natural-language querying in day-to-day workflows, keeping user sentiment high and shadow-IT incidents under control through mature governance programs. R&D investments focus on advanced AI explainability, preparing systems to justify recommendations in regulated settings. Cross-border data-sharing rules remain a watchpoint, yet the region's sophisticated cloud infrastructure continues to attract innovative analytics startups that expand platform ecosystems.
Asia-Pacific is the fastest growing territory, advancing at a 13.50% CAGR. China, India, Japan, and Australia demonstrate vigorous demand as domestic cloud giants and hyperscalers alike pour capital into data centers. SMEs in the region use mobile-first analytics to overcome desktop scarcity, with smartphone dashboards becoming the primary interface for many field employees. Talent shortages in data governance persist, prompting governments and academia to launch certification programs that should ease constraints after 2027. Manufacturing adoption is strong in Japan and South Korea, where predictive maintenance aligns with Industry 4.0 roadmaps, while financial hubs like Singapore emphasize customer analytics to differentiate regional banking services.
Europe shows steady uptake shaped by strict privacy statutes. Organizations balance democratization with GDPR compliance by opting for platforms that support fine-grained consent management and local data processing. Multilingual natural-language interfaces are especially valued, lifting engagement among non-technical staff by 50% in pilot projects. Western European cloud migration is accelerating after regulators clarified that encryption and local failover meet sovereignty requirements. Eastern Europe is catching up quickly as digital transformation funding flows into Poland, Romania, and the Czech Republic. Retail and discrete manufacturing dominate demand, though open-source alternatives gain traction in institutions wary of proprietary lock-in.
South America, the Middle East, and Africa remain early-stage yet promising. Brazil and Mexico head Latin American adoption, with telecom operators and banks seeking real-time customer views. Gulf Cooperation Council governments anchor investment in the Middle East, leveraging BI to support diversification agendas and smart-city initiatives. African uptake is fragmented; South Africa leads enterprise deployments, while Nigeria and Kenya show momentum through fintech ecosystems. Across these regions, cloud solutions enjoy preference owing to limited legacy estates, and mobile dashboards bridge infrastructure gaps in areas where desktop penetration is low.
- Microsoft Corporation
- SAP SE
- Salesforce (Tableau)
- Qlik Tech Intl.
- IBM Corporation
- Oracle Corporation
- SAS Institute
- MicroStrategy Inc.
- TIBCO Software
- Zoho Corporation (Analytics)
- Amazon Web Services (QuickSight)
- Google LLC (Looker)
- Domo Inc.
- Sisense Inc.
- ThoughtSpot Inc.
- Pyramid Analytics
- Yellowfin BI
- GoodData Corp.
- Board International
- Infor (Birst)
- Alibaba Cloud (Quick BI)
- Dundas Data Visualization
- SentryOne (BI Sentry)
- Phocas Software
Additional Benefits:
- The market estimate (ME) sheet in Excel format
- 3 months of analyst support
TABLE OF CONTENTS
1 INTRODUCTION
- 1.1 Study Assumptions and Market Definition
- 1.2 Scope of the Study
2 RESEARCH METHODOLOGY
3 EXECUTIVE SUMMARY
4 MARKET LANDSCAPE
- 4.1 Market Overview
- 4.2 Market Drivers
- 4.2.1 Democratization of Analytics via Low-code/No-code Tools in North America
- 4.2.2 Surge in Cloud-based Data Warehouses Accelerating Self-service Adoption in APAC
- 4.2.3 Integration of Generative AI for Natural-Language Querying in Europe
- 4.2.4 Embedded Analytics Demand from SaaS Vendors in BFSI & Retail
- 4.2.5 Rising Data-Literacy Programs Among Mid-Sized Enterprises
- 4.2.6 Regulatory Push for Data-Residency Compliance Driving Localized BI Platforms (MEA)
- 4.3 Market Restraints
- 4.3.1 Shadow-IT Risks from Uncontrolled Data Visualization Tools
- 4.3.2 Shortage of Data Governance Talent in Emerging Economies
- 4.3.3 High Migration Cost from Legacy BI to Self-service Stacks
- 4.3.4 Vendor Lock-in Concerns with Proprietary Semantic Layers
- 4.4 Value / Supply-Chain Analysis
- 4.5 Technological Outlook
- 4.6 Regulatory Outlook
- 4.7 Porter's Five Forces Analysis
- 4.7.1 Threat of New Entrants
- 4.7.2 Bargaining Power of Buyers
- 4.7.3 Bargaining Power of Suppliers
- 4.7.4 Threat of Substitutes
- 4.7.5 Competitive Rivalry
5 MARKET SIZE AND GROWTH FORECASTS (VALUE)
- 5.1 By Component
- 5.1.1 Software
- 5.1.2 Services
- 5.2 By Deployment Model
- 5.2.1 Cloud / On-Demand
- 5.2.2 On-Premises
- 5.3 By Application
- 5.3.1 Sales and Marketing Management
- 5.3.2 Customer Engagement and Analysis
- 5.3.3 Fraud and Security Management
- 5.3.4 Predictive Asset Maintenance
- 5.3.5 Risk and Compliance Management
- 5.3.6 Supply Chain and Procurement
- 5.3.7 Operations Management
- 5.4 By End-user Industry
- 5.4.1 BFSI
- 5.4.2 Retail and E-commerce
- 5.4.3 Healthcare
- 5.4.4 Manufacturing
- 5.4.5 Telecommunications
- 5.4.6 Media and Entertainment
- 5.4.7 Transportation and Logistics
- 5.4.8 Energy and Utilities
- 5.4.9 Government and Defense
- 5.5 By Organization Size
- 5.5.1 Large Enterprises
- 5.5.2 Small and Medium-sized Enterprises (SMEs)
- 5.6 By Geography
- 5.6.1 North America
- 5.6.1.1 United States
- 5.6.1.2 Canada
- 5.6.1.3 Mexico
- 5.6.2 South America
- 5.6.2.1 Brazil
- 5.6.2.2 Argentina
- 5.6.2.3 Rest of South America
- 5.6.3 Europe
- 5.6.3.1 Germany
- 5.6.3.2 United Kingdom
- 5.6.3.3 France
- 5.6.3.4 Italy
- 5.6.3.5 Spain
- 5.6.3.6 Rest of Europe
- 5.6.4 Asia-Pacific
- 5.6.4.1 China
- 5.6.4.2 Japan
- 5.6.4.3 South Korea
- 5.6.4.4 India
- 5.6.4.5 Rest of Asia-Pacific
- 5.6.5 Middle East and Africa
- 5.6.5.1 United Arab Emirates
- 5.6.5.2 Saudi Arabia
- 5.6.5.3 South Africa
- 5.6.5.4 Rest of Middle East and Africa
- 5.6.1 North America
6 COMPETITIVE LANDSCAPE
- 6.1 Market Concentration
- 6.2 Strategic Moves
- 6.3 Market Share Analysis
- 6.4 Company Profiles (includes Global Overview, Market-level Overview, Core Segments, Financials, Strategic Info, Market Rank/Share, Products & Services, Recent Developments)
- 6.4.1 Microsoft Corporation
- 6.4.2 SAP SE
- 6.4.3 Salesforce (Tableau)
- 6.4.4 Qlik Tech Intl.
- 6.4.5 IBM Corporation
- 6.4.6 Oracle Corporation
- 6.4.7 SAS Institute
- 6.4.8 MicroStrategy Inc.
- 6.4.9 TIBCO Software
- 6.4.10 Zoho Corporation (Analytics)
- 6.4.11 Amazon Web Services (QuickSight)
- 6.4.12 Google LLC (Looker)
- 6.4.13 Domo Inc.
- 6.4.14 Sisense Inc.
- 6.4.15 ThoughtSpot Inc.
- 6.4.16 Pyramid Analytics
- 6.4.17 Yellowfin BI
- 6.4.18 GoodData Corp.
- 6.4.19 Board International
- 6.4.20 Infor (Birst)
- 6.4.21 Alibaba Cloud (Quick BI)
- 6.4.22 Dundas Data Visualization
- 6.4.23 SentryOne (BI Sentry)
- 6.4.24 Phocas Software
7 MARKET OPPORTUNITIES AND FUTURE OUTLOOK
- 7.1 White-space and Unmet-need Assessment

 自助式 BI 市場報告:按組件、部署模式、應用、產業和地區分類(2026-2034 年)
 自助式 BI 市場規模、佔有率和成長分析:按組件、部署類型、企業規模、應用、最終用戶行業、用戶類型和地區分類——2026-2033 年行業預測
 2026年全球自助式商業智慧市場報告
 全球自助式商業智慧 (BI) 市場:市場規模、佔有率、成長率、產業分析、依類型、應用和地區劃分的分析及預測 (2026-2034)
 全球自助服務 BI 市場規模研究與預測(依部署、企業類型、產業和區域分類)2025 年至 2035 年預測2024 年至 2031 年自助式 BI 市場(按地區)