


 |
市場調查報告書
商品編碼
2123008
網路即服務:市場佔有率分析、產業趨勢與統計、成長預測(2026-2031 年)Network As A Service - Market Share Analysis, Industry Trends & Statistics, Growth Forecasts (2026 - 2031) |
||||||

※ 本網頁內容可能與最新版本有所差異。詳細情況請與我們聯繫。
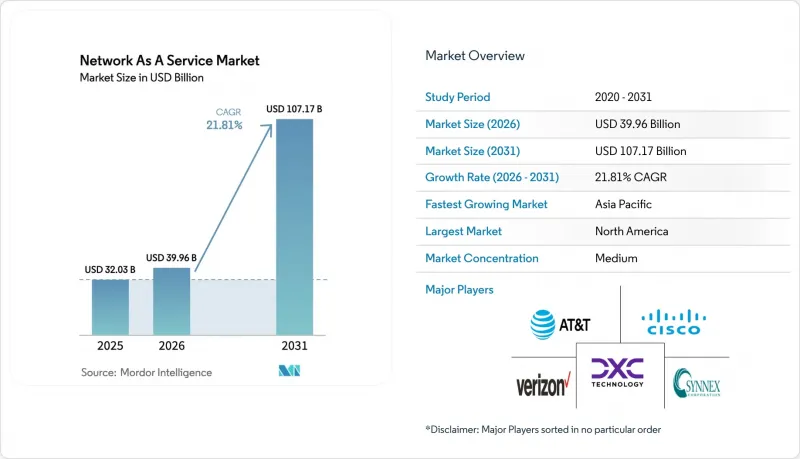
據 Mordor Intelligence 稱,網路即服務 (NAS) 市場在 2025 年的價值為 320.3 億美元,預計到 2031 年將達到 1071.7 億美元,而 2026 年為 399.6 億美元,預測期(2026-2031 年)的複合年成長率為 21.1%。
本報告按類型(例如,區域網路即服務)、應用(例如,虛擬客戶端設備、按需頻寬)、組織規模(例如,大型企業和中小企業)、行業(例如,IT 和電信)、部署模式(例如,基於公共雲端的網路即服務)和地區(例如,北美、南美)進行細分。市場預測以美元計價。
全球網路即服務市場趨勢與洞察
雲端優先網路轉型藍圖
混合工作負載如今已佔據IT支出的很大一部分,而與超大規模雲端的連接需求也呈現爆炸性成長。預計到2024年,Azure ExpressRoute和AWS Direct Connect的連線量將年增40%,這表明核心應用程式正逐漸從企業資料中心遷移出去。企業正在以可程式設計疊加網路取代靜態MPLS線路,從而將SaaS延遲降低30-50毫秒。無法容忍超過0.01%丟包率的金融機構正在推動這一趨勢,以保障即時交易的安全。精通API驅動配置的工程師短缺,促使企業對能夠透過使用者友善入口網站隱藏複雜性的全託管解決方案的需求激增。因此,服務供應商正在整合編配API,使企業能夠在DevOps管道中以「程式碼形式」編寫頻寬。
從資本支出轉向營運支出以及基於訂閱的預算壓力。
修訂後的 IFRS 16 和 ASC 842 準則將自有硬體重新定義為折舊免稅額的使用權資產,從而將資本與長期更新週期掛鉤。基於訂閱的網路即服務 (NaaS) 將固定投資轉化為可彈性支出,是私募股權投資組合中最佳化 EBITDA 的重要機制。製造企業正在利用這種模式在景氣衰退期間控制產能,而無需對設備進行折舊。零基預算迫使 IT 領導者每年都必須證明支出的合理性,但按需付費的網路服務比多年硬體折舊更容易克服這一障礙。這種轉變促使供應商之間的競爭更加重視服務品質而非計量收費規格,獎勵將安全性和可觀測性整合到一張發票中。
關於資料主權和資料居住的持續合規障礙。
GDPR、中國的《網路安全法》以及即將實施的印度《資料保護法》均要求服務提供者為每個司法管轄區建立獨立的控制平面。重複的基礎設施會造成全球部署的碎片化,增加單一站點成本,並削弱規模經濟效益。此外,Schrems II 裁決進一步限制了歐盟向美國傳輸個人數據,強制要求加入許多買家認為風險較高的合約條款。隨著巴塞爾協議 III 要求在所有託管區域進行彈性測試,金融機構面臨更複雜的挑戰。如果控制平面無法從中央主機集中管理分散式區域,企業將被迫採用混合模式,這將削弱網路即服務 (NaaS) 市場的價值提案。
細分市場分析
至2025年,廣域網路即服務(WAN-as-a-Service)將佔總收入的61.50%,凸顯其作為網路即服務(Network-as-a-Service)市場入口點的地位。擁有50多個分店的跨國公司可以透過SD-WAN疊加網路取代MPLS線路,立即實現成本節約,每兆位元成本降低60%。控制器內建的AI引擎可動態地將流量導向最近的雲端入口,從而縮短總部與公共雲端之間的檔案傳輸時間。服務供應商透過利用預先配置的零接觸邊緣設備來增加價值,將部署時間從數週縮短至數小時。
儘管目前規模較小,但鑑於Wi-Fi 7網路基地台需要802.3bt的功率預算,區域網路即服務(LANaaS)預計到2031年將以23.01%的複合年成長率成長。無力負擔交換器全面升級費用的大學和醫院正在轉向包含電源、分析和終端整合的「校園交換機即服務」套餐。服務供應商承諾為遠距臨場系統和電子健康記錄提供10Gbps上行鏈路,將區域網路現代化定位為營運成本而非資本門檻。透過將校園網路轉型為可預測的訂閱模式,供應商正在擴大潛在客戶群,從而推動「網路即服務」市場的整體成長勢頭。
到 2025 年,虛擬 CPE 將佔應用支出的 42.80%,這反映了路由器、防火牆和廣域網路最佳化器整合到 x86 設備中的趨勢。零接觸配置允許整個軟體堆疊在啟動時加載,使分支機構能夠減少 70% 的硬體安裝空間,並顯著減少現場服務呼叫。按需頻寬支援體育場館和會議中心的臨時擴展,展現了「網路即服務」市場的核心韌性。
網路即API(Network-as-API)雖然仍處於早期發展階段,但預計到2031年將以22.78%的複合年成長率成長。 GSMA CAMARA規範允許開發人員直接從其CI/CD管道中編程服務品質(QoS)和設備性能分析。電信業者正在透過開放5G網路功能(例如地理圍欄、動態SIM卡啟動和保證比特率)來創造傳統連接服務以外的新收入來源。隨著企業DevOps團隊將網路呼叫整合到應用程式程式碼中,價值正從實體連結轉移到API利用,從而在更廣泛的網路即服務市場中開闢新的商機。
區域分析
到2025年,北美將佔據網路即服務(NaaS)市場41.60%的佔有率。這主要得益於財富500強企業從MPLS遷移到SD-WAN,這將使網路支出減少40%。高密度雲端互連架構將使大多數美國企業能夠在距離最終用戶20毫秒以內存取至少三個可用區。聯邦採購計畫將業務集中在擁有高級別安全許可的供應商,這使得AT&T、Verizon和Lumen等老牌企業能夠在新參與企業的衝擊下保持市場佔有率。低延遲5G切片在華爾街交易中代表了一種高階應用場景,企業願意為微秒抖動控制付費。
預計到2031年,亞太地區的年複合成長率將達到22.95%。印度的「數位印度」舉措正在推動政府採用雲端運算,而國內數據在地化條款則確保了對區域控制平面的需求。中國移動和華為正在工業區部署私有5G網路,而在日本,地震後為增強網路韌性所做的努力正促使企業轉向多區域網路即服務(NaaS)架構。韓國的智慧城市感測器需要為緊急車輛分配優先網路切片,而澳洲的礦場正在使用私人5G網路,使自動駕駛卡車能夠在200公里的偏遠地區行駛。這些努力共同推動了全球成長最快經濟體—印度的網路即服務(NaaS)市場不斷擴大。
在歐洲, 《一般資料保護規則》(GDPR) 強制要求資料處理必須在區域內進行,導致部署分散。這推高了特定站點的成本,並阻礙了全球最佳化。德國和法國的主權雲端區域確保了合規性,但需要同時在人員配備和監控方面進行投資。英國脫歐後的監管差異進一步加劇了問題的複雜性,迫使供應商建構冗餘的基礎設施。同時,中東主權財富基金正在支持超大規模資料中心的互聯互通,以實現其「2030願景」目標,從而提振了沙烏地阿拉伯和阿拉伯聯合大公國的需求。在非洲,除南非和埃及以外,由於行動優先的基礎設施爭奪有限的頻段,進展緩慢。然而,Liquid Intelligent Technologies 的泛非光纖專案正開始挖掘潛在的企業需求。
其他好處:
- Excel格式的市場預測(ME)表
- 3個月的分析師支持
目錄
第1章:引言
- 研究假設和市場定義
- 調查範圍
第2章:調查方法
第3章執行摘要
第4章 市場狀況
- 市場概覽
- 市場促進因素
- 企業「雲端優先」網路轉型藍圖
- 從資本支出(CapEx)到營運支出(OpEx)的轉變給訂閱預算帶來了壓力。
- SD-WAN 和 SASE 的整合正在加速託管廣域網路的現代化進程。
- 為因應 Wi-Fi 7 帶來的電力消耗激增,校園 LAN NaaS 的需求日益成長。
- 人工智慧驅動的網路保障將平均修復時間縮短至 5 分鐘以內。
- 電信服務供應商 (CSP) 提供「服務型」私有 5G 網路切片。
- 市場限制因素
- 關於資料主權和居住方面的合規障礙仍然存在。
- 人們擔心專有生命週期平台會導致供應商鎖定。
- 根據 IFRS 16/ASC 842 制定的複雜租賃會計準則
- 邊緣站點電力成本波動對網路即服務 (NaaS) 總擁有成本 (TCO) 的影響
- 產業價值鏈分析
- 監理情勢
- 技術展望
- 波特五力分析
- 評估宏觀經濟趨勢對市場的影響
第5章 市場規模與成長預測
- 按類型
- LAN-as-a-Service
- WAN-as-a-Service
- Campus-Switch-as-a-Service
- Data-Centre-Interconnect-as-a-Service
- Private-5G-as-a-Service
- 透過使用
- 虛擬 CPE (vCPE)
- Bandwidth-on-Demand(BoD)
- 整合網路安全即服務
- 虛擬私人網路(VPN)
- 專用網路切片即服務
- Network-as-API
- 按組織規模
- 大公司
- 中小企業
- 按行業分類
- 資訊科技/通訊
- BFSI
- 衛生保健
- 製造業
- 零售與電子商務
- 政府/公共部門
- 其他工業部門
- 按部署模式
- 基於公共雲端即服務 (NaaS)
- 基於私有雲端即服務 (NaaS)
- 混合網路即服務 (Hybrid NaaS)
- 本地部署、訂閱、網路即服務 (NaaS)
- 按地區
- 北美洲
- 美國
- 加拿大
- 墨西哥
- 南美洲
- 巴西
- 阿根廷
- 其他南美國家
- 歐洲
- 德國
- 英國
- 法國
- 義大利
- 西班牙
- 其他歐洲國家
- 亞太地區
- 中國
- 日本
- 印度
- 韓國
- 澳洲
- 其他亞太國家
- 中東和非洲
- 中東
- 沙烏地阿拉伯
- 阿拉伯聯合大公國
- 土耳其
- 其他中東國家
- 非洲
- 南非
- 埃及
- 奈及利亞
- 其他非洲國家
- 中東
- 北美洲
第6章 競爭情勢
- 市場集中度
- 策略趨勢
- 市佔率分析
- 公司簡介
- Cisco Systems, Inc.
- Hewlett Packard Enterprise(Aruba/GreenLake)
- AT&T Inc.
- Verizon Communications Inc.
- IBM Corp.
- DXC Technology
- TD SYNNEX
- NEC Corp.
- Oracle Corp.
- GTT Communications
- VMware(Broadcom)
- Telstra Group
- Lumen Technologies
- Cato Networks
- Aryaka Networks
- Juniper Networks
- Nokia(Alcatel-Lucent Enterprise)
- Akamai Technologies
- Masergy(Comcast Business)
- Proofpoint/Meta Networks
- Extreme Networks
- Fortinet Inc.
第7章 市場機會與未來展望
According to Mordor Intelligence, the network as a service market size was valued at USD 32.03 billion in 2025 and is estimated to grow from USD 39.96 billion in 2026 to reach USD 107.17 billion by 2031, at a CAGR of 21.81% during the forecast period (2026-2031).
This report is Segmented by Type (LAN-As-A-Service, and More), Application (Virtual CPE, Bandwidth-On-Demand, and More), Organisation Size (Large Enterprises and Small and Medium Enterprises), Industry Vertical (IT and Telecom and More), Deployment Model (Public-Cloud-Based NaaS, and More), and Geography (North America, South America, and More). The Market Forecasts are Provided in Terms of Value (USD).
Global Network As A Service Market Trends and Insights
Cloud-First Network Transformation Roadmaps
Hybrid workloads dominate IT spend, and connections to hyperscale cloud on-ramps are climbing sharply. Azure ExpressRoute and AWS Direct Connect each experienced 40% year-over-year connection growth in 2024, indicating that core applications are now increasingly residing outside of enterprise data centers. Firms are replacing static MPLS circuits with programmable overlays that cut latency for SaaS by 30-50 milliseconds. Financial institutions, which cannot tolerate packet loss above 0.01%, are leading the adoption to protect real-time trading. The shortage of engineers trained in API-driven provisioning intensifies the demand for fully managed solutions that conceal complexity behind user-friendly portals. Consequently, providers embed orchestration APIs that allow enterprises to script bandwidth as code within DevOps pipelines.
Shift from CapEx to OpEx Subscription Budgeting Pressure
Revised IFRS 16 and ASC 842 rules recast owned hardware as a depreciating right-of-use asset, locking capital into long refresh cycles. Subscription NaaS converts fixed investments into elastic expenses, an arrangement prized by private equity portfolios that optimize EBITDA. Manufacturing groups leverage the model to throttle capacity during downturns without writing off equipment. Zero-based budgeting now forces IT leaders to justify spending annually, and pay-as-you-use circuits meet that hurdle more cleanly than multi-year hardware amortization. The shift accelerates vendor competition on service-level quality rather than box specifications, creating an incentive to bundle security and observability in a single invoice.
Persistent Data-Sovereignty and Residency Compliance Barriers
GDPR, China's Cybersecurity Law, and India's forthcoming Data Protection Bill require providers to establish separate control planes in each jurisdiction. Replicated infrastructure fragments the global footprint and raises per-site cost, eroding economies of scale. Schrems II further blocks personal-data transfers from the EU to the United States, requiring contractual clauses that many buyers deem risky. Financial institutions face compounded complexity because Basel III mandates resilience testing across all hosting regions. When control planes cannot orchestrate distributed zones from a central console, enterprises deploy hybrid models that temper the value proposition of the Network-as-a-Service market.
Other drivers and restraints analyzed in the detailed report include:
- SD-WAN and SASE Convergence Accelerating Managed WAN Refresh
- AI-Driven Network Assurance Reducing MTTR below 5 min
- Vendor Lock-In Fears around Proprietary Lifecycle Platforms
For complete list of drivers and restraints, kindly check the Table Of Contents.
Segment Analysis
In 2025, WAN-as-a-Service generated 61.50% of revenue, underscoring its role as the entry point for the Network As A Service market share. Multinationals with 50+ branches can capture immediate savings by replacing MPLS circuits with SD-WAN overlays, resulting in a 60% reduction in per-megabit costs. AI engines embedded in controllers dynamically steer traffic to the nearest cloud on-ramp, shrinking file transfer times between headquarters and public cloud. Service providers reinforce value through zero-touch edge devices that arrive pre-provisioned, thereby reducing deployment windows from weeks to hours.
LAN-as-a-Service, though smaller today, is growing at a 23.01% CAGR through 2031 as Wi-Fi 7 access points demand 802.3bt power budgets. Universities and hospitals that cannot fund wholesale switch upgrades pivot to campus-switch-as-a-service bundles that include power, analytics, and handset integration. Providers guarantee 10-gig uplinks for telepresence and electronic medical records, positioning LAN refresh as an operating expense rather than a capital hurdle. By converting campus networks into predictable subscriptions, suppliers expand the addressable pool of buyers, thereby increasing overall momentum in the Network As A Service market.
Virtual CPE captured 42.80% of application spend in 2025, reflecting the consolidation of routers, firewalls, and WAN optimizers onto x86 appliances. Branch offices reduce their hardware footprint by 70% and slash onsite service calls because zero-touch provisioning loads the full software stack at power-on. Bandwidth-on-demand supports temporary scale-ups at stadiums and conference centers, demonstrating the elasticity at the heart of the Network As A Service market.
Network-as-API, while nascent, is forecast to grow at a 22.78% CAGR to 2031. GSMA CAMARA specifications let developers program quality-of-service and device profiling directly from CI/CD pipelines. Telecommunications operators expose 5G network functions, such as geofencing, dynamic SIM activation, and guaranteed bit rates, creating new revenue paths beyond traditional connectivity. As enterprise DevOps teams integrate networking calls into application code, value shifts from physical links to API consumption, opening up greenfield opportunities within the broader Network As A Service market.
Complete Report Scope:
- By Type
- LAN-as-a-Service
- WAN-as-a-Service
- Campus-Switch-as-a-Service
- Data-Centre-Interconnect-as-a-Service
- Private-5G-as-a-Service
- By Application
- Virtual CPE (vCPE)
- Bandwidth-on-Demand (BoD)
- Integrated Network-Security-as-a-Service
- Virtual Private Network (VPN)
- Private Network Slice-as-a-Service
- Network-as-API
- By Organisation Size
- Large Enterprises
- Small and Medium Enterprises (SMEs)
- By Industry Vertical
- IT and Telecom
- BFSI
- Healthcare
- Manufacturing
- Retail and E-commerce
- Government and Public Sector
- Other Industry Verticals
- By Deployment Model
- Public-Cloud-Based NaaS
- Private-Cloud-Based NaaS
- Hybrid NaaS
- On-Prem Subscription NaaS
- By Geography
- North America
- United States
- Canada
- Mexico
- South America
- Brazil
- Argentina
- Rest of South America
- Europe
- Germany
- United Kingdom
- France
- Italy
- Spain
- Rest of Europe
- Asia-Pacific
- China
- Japan
- India
- South Korea
- Australia
- Rest of Asia-Pacific
- Middle East and Africa
- Middle East
- Saudi Arabia
- United Arab Emirates
- Turkey
- Rest of Middle East
- Africa
- South Africa
- Egypt
- Nigeria
- Rest of Africa
- Middle East
- North America
Geography Analysis
North America claimed 41.60% of the Network As A Service market in 2025, underpinned by Fortune 500 migrations from MPLS to SD-WAN, which lower network spend by 40%. Dense cloud interconnection fabrics mean most U.S. enterprises have access to at least three availability zones within 20 milliseconds of end users. Federal procurement funnels business toward providers holding impact-level clearances, so incumbents such as AT&T, Verizon, and Lumen defend share despite new entrants. Low-latency 5G slices for Wall Street trading demonstrate premium use cases that are willing to pay for microsecond-grade jitter control.
Asia-Pacific is on course for a 22.95% CAGR through 2031. India's Digital India initiative anchors government cloud adoption, and domestic data-localization clauses ensure demand for regional control planes. China Mobile and Huawei roll out private 5G at industrial hubs, while Japan's post-earthquake resilience push drives enterprises to multi-region NaaS architectures. South Korea's smart city sensors require priority slices for emergency vehicles, and Australia's mines rely on private 5G to guide autonomous trucks across 200 kilometers of outback terrain. Collectively, these programs expand the Network As A Service market across the world's fastest-growing economies.
Europe experiences fragmented deployment because the GDPR requires in-region data processing, which inflates per-site costs and prevents global optimization. Sovereign cloud zones in Germany and France ensure compliance, but they also demand parallel investments in staffing and monitoring. The United Kingdom's regulatory divergence post-Brexit further complicates matters, compelling vendors to duplicate infrastructure. Meanwhile, Middle East sovereign funds are backing hyperscale data-center interconnects to achieve Vision 2030 milestones, thereby reinforcing demand in Saudi Arabia and the UAE. Africa advances slowly outside of South Africa and Egypt, as mobile-first infrastructure competes for limited spectrum, although pan-African fiber projects by Liquid Intelligent Technologies are beginning to unlock latent enterprise demand.
- Cisco Systems, Inc.
- Hewlett Packard Enterprise (Aruba/GreenLake)
- AT&T Inc.
- Verizon Communications Inc.
- IBM Corp.
- DXC Technology
- TD SYNNEX
- NEC Corp.
- Oracle Corp.
- GTT Communications
- VMware (Broadcom)
- Telstra Group
- Lumen Technologies
- Cato Networks
- Aryaka Networks
- Juniper Networks
- Nokia (Alcatel-Lucent Enterprise)
- Akamai Technologies
- Masergy (Comcast Business)
- Proofpoint / Meta Networks
- Extreme Networks
- Fortinet Inc.
Additional Benefits:
- The market estimate (ME) sheet in Excel format
- 3 months of analyst support
TABLE OF CONTENTS
1 INTRODUCTION
- 1.1 Study Assumptions and Market Definition
- 1.2 Scope of the Study
2 RESEARCH METHODOLOGY
3 EXECUTIVE SUMMARY
4 MARKET LANDSCAPE
- 4.1 Market Overview
- 4.2 Market Drivers
- 4.2.1 Enterprises' "Cloud-First" Network Transformation Roadmaps
- 4.2.2 Shift from CapEx to OpEx Subscription Budgeting Pressure
- 4.2.3 SD-WAN and SASE Convergence Accelerating Managed WAN Refresh
- 4.2.4 Campus-LAN NaaS Demand to Counter Wi-Fi 7 Power Spikes
- 4.2.5 AI-Driven Network Assurance Reducing MTTR below 5 min
- 4.2.6 Private-5G Network Slicing Sold "As-a-Service" by CSPs
- 4.3 Market Restraints
- 4.3.1 Persistent Data-Sovereignty and Residency Compliance Barriers
- 4.3.2 Vendor Lock-In Fears around Proprietary Lifecycle Platforms
- 4.3.3 Complex Lease-Accounting Rules under IFRS 16/ASC 842
- 4.3.4 Edge-Site Power Cost Volatility Impacting NaaS TCO
- 4.4 Industry Value Chain Analysis
- 4.5 Regulatory Landscape
- 4.6 Technological Outlook
- 4.7 Porter's Five Forces Analysis
- 4.7.1 Bargaining Power of Suppliers
- 4.7.2 Bargaining Power of Buyers
- 4.7.3 Threat of New Entrants
- 4.7.4 Threat of Substitutes
- 4.7.5 Intensity of Competitive Rivalry
- 4.8 Assessment of the Impact of Macroeconomic Trends on the Market
5 MARKET SIZE AND GROWTH FORECASTS (VALUE)
- 5.1 By Type
- 5.1.1 LAN-as-a-Service
- 5.1.2 WAN-as-a-Service
- 5.1.3 Campus-Switch-as-a-Service
- 5.1.4 Data-Centre-Interconnect-as-a-Service
- 5.1.5 Private-5G-as-a-Service
- 5.2 By Application
- 5.2.1 Virtual CPE (vCPE)
- 5.2.2 Bandwidth-on-Demand (BoD)
- 5.2.3 Integrated Network-Security-as-a-Service
- 5.2.4 Virtual Private Network (VPN)
- 5.2.5 Private Network Slice-as-a-Service
- 5.2.6 Network-as-API
- 5.3 By Organisation Size
- 5.3.1 Large Enterprises
- 5.3.2 Small and Medium Enterprises (SMEs)
- 5.4 By Industry Vertical
- 5.4.1 IT and Telecom
- 5.4.2 BFSI
- 5.4.3 Healthcare
- 5.4.4 Manufacturing
- 5.4.5 Retail and E-commerce
- 5.4.6 Government and Public Sector
- 5.4.7 Other Industry Verticals
- 5.5 By Deployment Model
- 5.5.1 Public-Cloud-Based NaaS
- 5.5.2 Private-Cloud-Based NaaS
- 5.5.3 Hybrid NaaS
- 5.5.4 On-Prem Subscription NaaS
- 5.6 By Geography
- 5.6.1 North America
- 5.6.1.1 United States
- 5.6.1.2 Canada
- 5.6.1.3 Mexico
- 5.6.2 South America
- 5.6.2.1 Brazil
- 5.6.2.2 Argentina
- 5.6.2.3 Rest of South America
- 5.6.3 Europe
- 5.6.3.1 Germany
- 5.6.3.2 United Kingdom
- 5.6.3.3 France
- 5.6.3.4 Italy
- 5.6.3.5 Spain
- 5.6.3.6 Rest of Europe
- 5.6.4 Asia-Pacific
- 5.6.4.1 China
- 5.6.4.2 Japan
- 5.6.4.3 India
- 5.6.4.4 South Korea
- 5.6.4.5 Australia
- 5.6.4.6 Rest of Asia-Pacific
- 5.6.5 Middle East and Africa
- 5.6.5.1 Middle East
- 5.6.5.1.1 Saudi Arabia
- 5.6.5.1.2 United Arab Emirates
- 5.6.5.1.3 Turkey
- 5.6.5.1.4 Rest of Middle East
- 5.6.5.2 Africa
- 5.6.5.2.1 South Africa
- 5.6.5.2.2 Egypt
- 5.6.5.2.3 Nigeria
- 5.6.5.2.4 Rest of Africa
- 5.6.5.1 Middle East
- 5.6.1 North America
6 COMPETITIVE LANDSCAPE
- 6.1 Market Concentration
- 6.2 Strategic Moves
- 6.3 Market Share Analysis
- 6.4 Company Profiles (includes Global level Overview, Market Level Overview, Core Segments, Financials as Available, Strategic Information, Market Rank/Share for Key Companies, Products and Services, and Recent Developments)
- 6.4.1 Cisco Systems, Inc.
- 6.4.2 Hewlett Packard Enterprise (Aruba/GreenLake)
- 6.4.3 AT&T Inc.
- 6.4.4 Verizon Communications Inc.
- 6.4.5 IBM Corp.
- 6.4.6 DXC Technology
- 6.4.7 TD SYNNEX
- 6.4.8 NEC Corp.
- 6.4.9 Oracle Corp.
- 6.4.10 GTT Communications
- 6.4.11 VMware (Broadcom)
- 6.4.12 Telstra Group
- 6.4.13 Lumen Technologies
- 6.4.14 Cato Networks
- 6.4.15 Aryaka Networks
- 6.4.16 Juniper Networks
- 6.4.17 Nokia (Alcatel-Lucent Enterprise)
- 6.4.18 Akamai Technologies
- 6.4.19 Masergy (Comcast Business)
- 6.4.20 Proofpoint / Meta Networks
- 6.4.21 Extreme Networks
- 6.4.22 Fortinet Inc.
7 MARKET OPPORTUNITIES AND FUTURE OUTLOOK
- 7.1 White-space and Unmet-Need Assessment

 全球網路即服務 (GNaaS) 市場規模、佔有率、趨勢和成長分析報告(2026-2034 年)
 2026-2030年全球網路即服務(NAAS)市場網路即服務 (NaaS) 市場規模、佔有率、成長、全球產業分析、區域洞察與預測(2026-2034 年)
 網路即服務 (NaaS) 市場:2026-2032 年全球市場預測(按服務類型、技術、部署模式、定價模式和最終用戶產業分類)
 網路即服務市場 - 全球產業規模、佔有率、趨勢、機會、預測:按類型、服務、最終用戶、地區和競爭對手分類,2021-2031 年
 網路即服務 (NaaS) 市場規模、佔有率、趨勢和預測:按類型、應用、最終用戶產業和地區分類,2026-2034 年
 網路即服務 (NaaS) 市場預測至 2034 年:全球分析(按組件、部署類型、組織規模、最終用戶和地區分類)
 2026年全球網路即服務市場報告
 網路即服務市場分析及至 2035 年預測:按類型、產品類型、服務、技術、組件、應用、部署類型、最終用戶和解決方案分類日本網路即服務市場報告(按類型、應用、最終用戶產業和地區分類,2026-2034 年)