


 |
市場調查報告書
商品編碼
2122951
區塊鏈在能源領域的應用:市場佔有率分析、行業趨勢與統計數據以及成長預測(2026-2031 年)Blockchain In Energy - Market Share Analysis, Industry Trends & Statistics, Growth Forecasts (2026 - 2031) |
||||||

※ 本網頁內容可能與最新版本有所差異。詳細情況請與我們聯繫。
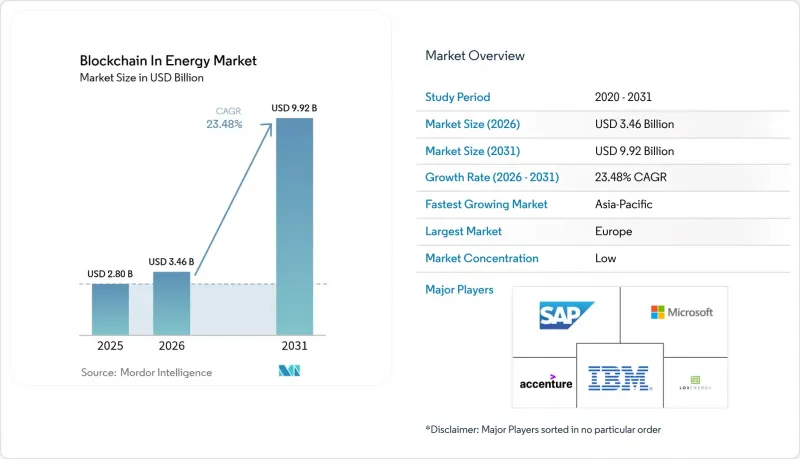
據 Mordor Intelligence 稱,2026 年能源領域的區塊鏈市場規模預計為 34.6 億美元,高於 2025 年的 28 億美元,預計到 2031 年將達到 99.2 億美元。
預計 2026 年至 2031 年的複合年成長率為 23.48%。
本報告按應用(支付、智慧合約、數位身分、管治、風險、合規 (GRC) 等)和地區進行分類。
全球能源區塊鏈市場趨勢與洞察
浮動定價和P2P交易的興起
浮動定價以即時定價取代固定費率,反映供需失衡,為產消者(生產者和消費者)創造套利機會。奧地利的「智慧社區」(smartCOMMUNITY)平台允許家庭用戶客製化購電契約,並以具有競爭力的價格交易剩餘太陽能電力,這與該國到2030年實現100%可再生能源的目標相一致。日本關西電力公司(KEPCO)的試點計畫預計透過取消上網電價補貼制度節省185億美元,這表明市場主導的定價如何改變一個國家的能源經濟。在本地微電網中實施的基於聯盟的區塊鏈技術,與傳統的淨計量相比,實現了更高的投資回報率,凸顯了去中心化市場的商業性可行性。隨著參與度的提高,網路效應增強了流動性,加速了區塊鏈在能源領域的應用。
由公共產業支援的區塊鏈認證項目
為了在遵守可再生能源普及要求的同時保持市場影響力,電力公司正在推出基於區塊鏈的認證系統。例如,與韓國電力公司(KEPCO)夥伴關係,正在基於區塊鏈建立全國性的可再生能源證書(REC)標準,以確保在監管監督下進行透明的頒發和交易。在加拿大,Alectra 的 GridExchange 展示了一種機制,可以在電力公司營運的市場中,向分散式能源資源(DER)所有者支付電網支援費用,而無需放棄控制權。德克薩斯州的 ERCOT REC 專案提供了一種成熟的交易機制,區塊鏈可以增強而非取代該機制,其最具可擴展性的實施方案表明,與現有營運商合作而非造成干擾是可行的。
可擴充性和交易成本限制
傳統的PoW(工作量證明)鏈無法處理即時電網平衡所需的微交易。 SNARK的平行執行研究表明,吞吐量可提升10,000倍,這為實際應用提供了一條可行的途徑。 Solana的PoS(權益證明)網路每筆交易僅消耗0.00412瓦時(Wh)的能源,到2024年的總消耗量相當於833個美國家庭的平均用電量。這表明,節能共識機制可以同時降低排放和成本。該混合區塊鏈已針對電動車能源交易進行了測試,它結合了PoW的安全性和PoS的效率,展示了一種實用的能源區塊鏈解決方案。
細分市場分析
利用去中心化能源資源(DER)柔軟性的智慧合約預計將在2025年達到6.5億美元的市場規模,並在2031年之前以28.74%的複合年成長率成長。此細分市場可實現電動車隊和家用電池系統的自動化運行,最大限度地減少人為干預,同時在用電尖峰時段保障電網穩定。到2025年,支付和P2P能源交易將佔據區塊鏈能源市場37.30%的最大佔有率,這表明自動化計費和支付具有即時的商業性可行性。隨著企業採購中可再生能源的按小時匹配逐漸成為標準,管治、風險和合規(GRC)解決方案正在蓬勃發展,凸顯了區塊鏈能源市場目前涵蓋的廣泛應用情境。
將人工智慧與區塊鏈智慧合約結合,正在提升營運效率。微軟和Flexidao合作推出的按小時匹配離岸風力發電輸出與資料中心用電量的計劃,展示了防篡改帳本如何防止重複累計,以及先進演算法如何最大化同步得分。採用零知識證明的數位身分框架可在電動車與智慧電網互動時保護用戶隱私,而能源效率獎勵計畫則為參與需量反應的用戶提供代幣獎勵。這些不斷發展的應用,共同拓展了區塊鏈在能源領域的應用範圍,並為整個電網的長期價值創造奠定了基礎。
區域分析
預計到2025年,歐洲將佔全球收入的31.60%,憑藉持續的政策措施和大規模的公共支出,鞏固其主導地位。歐盟委員會斥資2,250萬歐元在漢堡啟動的供熱改造項目,利用區塊鏈技術檢驗熱源來源,凸顯了歐盟致力於建構透明能源體系的國家層級承諾。監管沙盒,例如對Enoda的ENSEMBLE平台進行審查的歐洲區塊鏈沙盒,降低了創新者的合規成本,並加速了商業化進程。奧地利引進P2P交易,也印證了持續的政策支援能夠促進商業性應用,並鞏固區塊鏈在能源領域的市場基礎。
亞太地區是成長最快的地區,預計複合年成長率將達到27.10%。日本修訂後的基金法規允許有限夥伴關係持有加密資產,國內資本正流入Web3能源企業。由韓國電力公司組成的聯盟正在政府監管下建立一個基於區塊鏈的可再生能源認證(REC)市場,其合法性正吸引更多投資(tokenpost.kr)。澳洲一項關於V2G(車輛到電網)定價的研究強調了自適應定價設計如何最大限度地節省客戶成本並支持電網運行,為未來的區塊鏈平台提供了一個可複製的藍圖。
在北美市場,大規模整合正在推進。美國能源局製定的十年V2G藍圖優先考慮網路安全和智慧充電,這兩項是區塊鏈互通性的基礎。加州的一個快速充電試點計畫表明,透過分散式帳本最佳化可再生能源併網和電網服務可以實現成本節約。加拿大的Alectra GridExchange是一個概念驗證項目,它由公用事業公司經營,在保持其現有功能的同時,引入了新的交易架構。
其他好處
- Excel格式的市場預測(ME)表
- 3個月的分析師支持
目錄
第1章:引言
- 研究假設和市場定義
- 調查範圍
第2章:調查方法
第3章執行摘要
第4章 市場狀況
- 市場概覽
- 市場促進因素
- 浮動定價和P2P交易的興起
- 由公共產業支援的區塊鏈認證項目
- 創業投資正湧入基於能源代幣的新創公司。
- 憑證式的去中心化能源資源(DER)引入資金籌措(報告不足)
- 全天候運作的無碳能源需求趨勢(報告不足)
- 電動汽車車隊對電網服務的貨幣化利用(報告不足)
- 市場限制因素
- 可擴充性和交易成本限制
- 能源數據標準的變化
- 代幣價格波動影響經營模式(報告不足)
- 能源代幣證券監管方面的不確定性(資訊揭露不足)
- 價值供應鏈分析
- 監理情勢
- 技術展望(分散式帳本技術棧、PoS、PoA)
- 波特五力模型
第5章 市場規模與成長預測
- 透過使用
- 沉澱
- 智慧合約
- 數位身分
- 管治、風險和合規 (GRC)
- 其他
- 按地區
- 北美洲
- 美國
- 加拿大
- 歐洲
- 英國
- 德國
- 荷蘭
- 其他歐洲國家
- 亞太地區
- 日本
- 澳洲
- 紐西蘭
- 其他亞太國家
- 南美洲
- 巴西
- 墨西哥
- 其他南美國家
- 中東和非洲
- 阿拉伯聯合大公國
- 以色列
- 其他中東和非洲國家
- 北美洲
第6章 競爭情勢
- 市場集中度
- 策略趨勢
- 市佔率分析
- 公司簡介
- SAP SE
- Electron
- Accenture
- IBM
- LO3 Energy
- GREENEUM
- Drift Marketplace
- IOTA Foundation
- BTL Group
- Power Ledger
- ImpactPPA
第7章 市場機會與未來展望
According to Mordor Intelligence, blockchain in energy market size market size in 2026 is estimated at USD 3.46 billion, growing from 2025 value of USD 2.80 billion with 2031 projections showing USD 9.92 billion, growing at 23.48% CAGR over 2026-2031.
This report is Segmented by Application (Payments, Smart Contracts, Digital Identities, Governance, Risk and Compliance (GRC), Other Applications) and Geography
Global Blockchain In Energy Market Trends and Insights
Emergence of Variable Tariffs & P2P Trading
Variable tariffs are replacing flat rates with real-time pricing that reflects supply-demand imbalances, creating arbitrage opportunities for prosumers. Austria's smartCOMMUNITY platform lets households customize power-purchase agreements and trade surplus solar at competitive rates, aligning with the nation's 100% renewable goal by 2030. Japan's KEPCO trial projected USD 18.5 billion in savings from abandoning fixed feed-in tariffs, showing how market-driven pricing can reshape national energy economics. Consortium blockchains deployed in rural microgrids deliver superior paybacks versus traditional net-metering, highlighting the commercial viability of distributed marketplaces. As participation rises, network effects deepen liquidity, accelerating adoption across the blockchain in the energy sector market.
Utility-Backed Blockchain Certificate Programs
Utilities are launching blockchain certificate schemes to comply with renewable mandates while retaining market influence. South Korea's KEPCO partnership is building a national renewable-energy certificate (REC) standard on blockchain, ensuring transparent issuance and trade under regulatory supervision. In Canada, Alectra's GridExchange demonstrates how a utility-operated marketplace pays DER owners for grid support without ceding control. Texas's ERCOT REC program offers a proven trading mechanism that blockchain can enhance rather than replace, signaling that the most scalable deployments will collaborate with, not disrupt, incumbent operators
Scalability & Transaction-Cost Constraints
Legacy proof-of-work chains cannot process the micro-transactions needed for real-time grid balancing. Research on SNARK-based parallel execution shows 10,000-fold throughput gains, hinting at a viable path to utility scale. Solana's proof-of-stake network consumes only 0.00412 Wh per transaction, with total 2024 usage equal to 833 US homes, proving that energy-efficient consensus can cut both emissions and fees. Hybrid blockchains tested for EV energy trading blend proof-of-work security with proof-of-stake efficiency, demonstrating practical solutions for the blockchain in the energy sector market.
Other drivers and restraints analyzed in the detailed report include:
- VC Funding Surge into Energy-Token Start-ups
- Token-Based Financing for DER Roll-Outs
- Fragmented Energy-Data Standards
For complete list of drivers and restraints, kindly check the Table Of Contents.
Segment Analysis
Smart contracts for DER flexibility accounted for USD 0.65 billion in 2025 and are poised to grow at a 28.74% CAGR to 2031. This sub-segment automates the dispatch of EV fleets and household batteries, minimizing human intervention and supporting grid stability during peak demand. Payments and P2P energy trading maintained the largest 37.30% share of the blockchain in the energy sector market size in 2025, proving immediate commercial viability for automated billing and settlement. Governance, risk, and compliance solutions are gaining momentum as hourly renewable-energy matching becomes standard in corporate procurement, underscoring the breadth of use cases now captured by the blockchain in the energy sector market.
Integrating AI with blockchain smart contracts is elevating operational efficiency. Microsoft and Flexidao's hourly matching of offshore wind output with data center consumption shows how immutable ledgers prevent double-counting while advanced algorithms maximize synchronicity scores. Digital-identity frameworks relying on zero-knowledge proofs safeguard user privacy as EVs interact with smart grids, and energy-efficiency incentive schemes deliver token rewards for demand-response participation. Together, these evolving applications expand the blockchain in the energy sector industry toolkit and anchor long-term value creation across the grid.
Complete Report Scope:
- By Application
- Payments
- Smart Contracts
- Digital Identities
- Governance, Risk and Compliance (GRC)
- Other Applications
- By Geography
- North America
- United States
- Canada
- Europe
- United Kingdom
- Germany
- Netherlands
- Rest of Europe
- Asia-Pacific
- Japan
- Australia
- New Zealand
- Rest of APAC
- South America
- Brazil
- Mexico
- Rest of South America
- Middle East and Africa
- United Arab Emirates
- Israel
- Rest of Middle East and Africa
- North America
Geography Analysis
Europe contributed 31.60% of 2025 revenue, cementing its lead through cohesive policy instruments and sizable public outlays. The European Commission's EUR 22.5 million Hamburg heating transition leverages blockchain to verify heat-source provenance, emphasizing state-level commitment to transparent energy systems. Regulatory sandboxes, such as the European Blockchain Sandbox that vetted Enoda's ENSEMBLE platform, lower the compliance cost for innovators and accelerate commercialization. Austria's P2P trading roll-out confirms that consistent policy support translates to commercial adoption and underpins the blockchain in the energy sector market.
Asia-Pacific is the fastest-growing geography, projected at 27.10% CAGR. Japan's revised fund rules allow limited partnerships to hold crypto, channeling domestic capital toward Web3 energy ventures. South Korea's utility consortium is establishing blockchain-based REC markets under ministerial oversight, granting legitimacy that draws additional investment, tokenpost.kr. Australia's vehicle-to-grid tariff research highlights how adaptive rate design maximizes both customer savings and grid support, offering a replicable blueprint for future blockchain platforms.
North America's market advances on large-scale integration. The US Department of Energy's 10-year vehicle-to-grid roadmap prioritizes cybersecurity and smart charging-the foundational layers for blockchain interoperability. California's fast-charging pilots demonstrate cost reductions when renewable integration and grid services are optimized through distributed ledgers. Canada's Alectra GridExchange provides a proof point for utility-operated marketplaces, preserving incumbent roles while embracing new transactional architectures.
- SAP SE
- Electron
- Accenture
- IBM
- LO3 Energy
- GREENEUM
- Drift Marketplace
- IOTA Foundation
- BTL Group
- Power Ledger
- ImpactPPA
Additional Benefits:
- The market estimate (ME) sheet in Excel format
- 3 months of analyst support
TABLE OF CONTENTS
1 INTRODUCTION
- 1.1 Study Assumptions and Market Definition
- 1.2 Scope of the Study
2 RESEARCH METHODOLOGY
3 EXECUTIVE SUMMARY
4 MARKET LANDSCAPE
- 4.1 Market Overview
- 4.2 Market Drivers
- 4.2.1 Emergence of variable tariffs and P2P trading
- 4.2.2 Utility-backed blockchain certificate programs
- 4.2.3 VC funding surge into energy-token start-ups
- 4.2.4 Token-based financing for DER roll-outs (under-reported)
- 4.2.5 24/7 carbon-free energy tracking demand (under-reported)
- 4.2.6 Grid-service monetisation for EV fleets (under-reported)
- 4.3 Market Restraints
- 4.3.1 Scalability and transaction-cost constraints
- 4.3.2 Fragmented energy-data standards
- 4.3.3 Token-price volatility impacting business models (under-reported)
- 4.3.4 Regulatory uncertainty on energy-token securities (under-reported)
- 4.4 Value / Supply-Chain Analysis
- 4.5 Regulatory Landscape
- 4.6 Technological Outlook (DLT stacks, PoS, PoA)
- 4.7 Porter's Five Forces
- 4.7.1 Bargaining Power of Suppliers
- 4.7.2 Bargaining Power of Consumers
- 4.7.3 Threat of New Entrants
- 4.7.4 Intensity of Competitive Rivalry
- 4.7.5 Threat of Substitutes
5 MARKET SIZE AND GROWTH FORECASTS (VALUE)
- 5.1 By Application
- 5.1.1 Payments
- 5.1.2 Smart Contracts
- 5.1.3 Digital Identities
- 5.1.4 Governance, Risk and Compliance (GRC)
- 5.1.5 Other Applications
- 5.2 By Geography
- 5.2.1 North America
- 5.2.1.1 United States
- 5.2.1.2 Canada
- 5.2.2 Europe
- 5.2.2.1 United Kingdom
- 5.2.2.2 Germany
- 5.2.2.3 Netherlands
- 5.2.2.4 Rest of Europe
- 5.2.3 Asia-Pacific
- 5.2.3.1 Japan
- 5.2.3.2 Australia
- 5.2.3.3 New Zealand
- 5.2.3.4 Rest of APAC
- 5.2.4 South America
- 5.2.4.1 Brazil
- 5.2.4.2 Mexico
- 5.2.4.3 Rest of South America
- 5.2.5 Middle East and Africa
- 5.2.5.1 United Arab Emirates
- 5.2.5.2 Israel
- 5.2.5.3 Rest of Middle East and Africa
- 5.2.1 North America
6 COMPETITIVE LANDSCAPE
- 6.1 Market Concentration
- 6.2 Strategic Moves
- 6.3 Market Share Analysis
- 6.4 Company Profiles {(includes Global level Overview)}
- 6.4.1 SAP SE
- 6.4.2 Electron
- 6.4.3 Accenture
- 6.4.4 IBM
- 6.4.5 LO3 Energy
- 6.4.6 GREENEUM
- 6.4.7 Drift Marketplace
- 6.4.8 IOTA Foundation
- 6.4.9 BTL Group
- 6.4.10 Power Ledger
- 6.4.11 ImpactPPA
7 MARKET OPPORTUNITIES AND FUTURE OUTLOOK
- 7.1 White-space and Unmet-need Assessment

 2026-2034年全球區塊鏈市場規模、佔有率、趨勢和成長分析報告(能源領域)
 能源領域區塊鏈市場:按組件、應用、部署模式、最終用戶、國家和地區分類-全球產業分析、市場規模、市場佔有率及2026年至2033年預測
 能源領域區塊鏈市場:按組件、部署狀態、應用和最終用戶分類-2026-2032年全球市場預測
 區塊鏈能源交易市場預測至2034年:全球分析(按組成部分、交易平台類型、能源來源、區塊鏈技術、應用、最終用戶和地區分類)
 能源領域區塊鏈市場報告:按組件、類型、應用、最終用戶和地區分類(2026-2034 年)
 2026年全球能源交易區塊鏈市場報告2026年全球能源公共區塊鏈市場報告
 區塊鏈在能源市場的應用:機會、成長要素、產業趨勢分析及2026-2035年預測
 區塊鏈技術在能源領域的應用:全球市場佔有率和排名、總收入和需求預測(2025-2031 年)
 2025-2029年能源領域區塊鏈技術全球市場