


 |
市場調查報告書
商品編碼
2122930
冶金焦:市場佔有率分析、產業趨勢與統計、成長預測(2026-2031)Metallurgical Coke - Market Share Analysis, Industry Trends & Statistics, Growth Forecasts (2026 - 2031) |
||||||

※ 本網頁內容可能與最新版本有所差異。詳細情況請與我們聯繫。
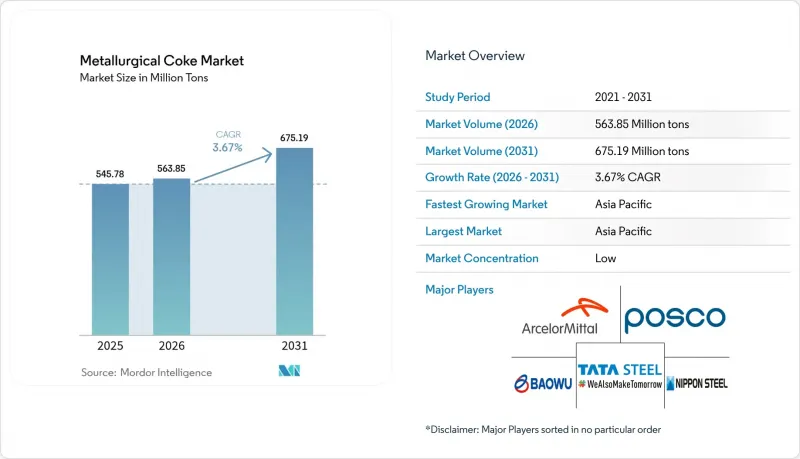
根據 Mordor Intelligence 預測,冶金焦的市場規模預計將從 2025 年的 5.4578 億噸擴大到 2026 年的 5.6385 億噸,並將從 2026 年到 2031 年以 3.67% 的複合年成長,到 2031 年達到 6.95 億噸年成長率。
本報告按焦炭類型(高爐焦及其他)、等級(低灰分(8-12%)、高灰分(15%及以上))、應用領域(鋼鐵製造及其他)、終端用戶行業(綜合鋼鐵企業、鑄造廠及其他)和地區(亞太地區、北美地區、歐洲地區、南美地區、中東和非洲地區)進行細分。市場預測以噸為單位。
全球冶金焦市場趨勢及洞察
公共基礎設施對鋼鐵的需求增加
亞太和中東各國政府正以前所未有的預算投入高速公路、地鐵和可再生能源電網建設,這些項目都需要鋼筋和鋼板,而所有這些都依賴於使用冶金焦的高爐煉鋼路線。在印度1.4兆美元的「國家基礎設施計畫」中,近四分之一用於交通運輸項目,相當於每生產一噸粗鋼需要約0.8噸焦炭。沙烏地阿拉伯的NEOM新城及其相關大型企劃預計,到2028年,該國的鋼鐵需求將達到1,200萬噸,這將促使區域鋼鐵廠簽訂多年期焦炭採購合約。越南的南北高速公路也正在推動焦炭需求的成長,而和發集團正在推進新高爐的建設,預計到2027年焦炭需求將增加150萬噸。綜上所述,這些計劃共同支撐了冶金焦市場需求的成長趨勢。
汽車產能擴張
2025年,中國、印度和泰國的輕型汽車產量均有所回升,但由於汽車製造商採用更薄的高抗張強度鋼和鋁材,每輛車的鋼材用量有所下降。在中國,2025年汽車組裝為3,020萬輛,比2024年成長4%,但每輛車的平均鋼材用量降至820公斤。在印度,考慮到高爐煉焦的佔有率,預計每新增100萬輛汽車仍需要18萬噸焦炭,這支撐了冶金焦炭產業的需求,儘管電弧爐煉焦正在逐步普及。泰國電動車的普及導致當地供應商對電弧爐煉鋼的需求增加,這表明汽車電氣化最終將限制東南亞焦炭的成長速度。
冶金焦價格波動
2024年至2025年間,颶風賈斯珀擾亂了昆士蘭州的鐵路運輸,導致硬焦煤現貨價格在每噸210美元至340美元之間波動,給通常EBITDA利潤率在6%至8%的商業焦炭生產商的利潤率帶來壓力。印度尤其脆弱,因為其2025年進口的焦煤中有85%來自澳洲。儘管在大連商品交易所進行期貨避險可以降低部分風險,但由於實體等級的差異,基礎風險依然存在。
細分市場分析
到2025年,高爐焦將佔全球總量的64.27%,鞏固其作為現代1500 度C高爐還原劑和結構支撐的關鍵作用。鑄造焦的成長速度最快,複合年成長率達4.25%,因為鑄造廠需要粒徑為10-25毫米的焦炭來提高沖天爐的透氣性。鑄造焦透過向灰鑄鐵和球墨鑄鐵廠供應焦炭,維持其獨特的市場地位,這些廠需要焦炭還原率(CSR)超過60%且硫含量低於0.6%。隨著鋼鐵廠從燒結礦轉向含熔劑球團礦,焦粉的使用量停滯不前,導致冶金焦市場中低價值終端用戶部分的佔有率萎縮。
中國主要綜合性鋼鐵廠繼續指定使用高煤粉含量(CSR 65% 以上)的高爐焦,以承受其 5000 立方米高爐中超過 15 巴的爐膛壓力。採用 CDQ 技術可使焦炭強度提高 3-5 個百分點,使生產商即使在煤炭價格波動的情況下也能獲得溢價。預計在預測期內,塊狀焦的需求成長將超過高爐焦的需求成長,但高爐焦的絕對處理量將更高,這將鞏固高爐焦作為冶金焦市場主力產品的地位。
預計到2025年,低灰焦(8-12%)將佔70.80%的市場佔有率,年成長率達4.59%,顯著優於高灰焦。灰分含量每降低1個百分點,每噸鐵水的爐渣量即可減少15公斤,進而降低石灰石和耐火材料的成本。因此,印度和中國運作4500立方米以上高爐的鋼鐵廠正在簽訂多年期優質煤配供應契約,以確保低灰焦的生產,從而在冶金焦市場中形成一個以質量為導向的細分市場。同時,灰分通常超過15%的高灰焦仍僅限於老舊高爐和非鐵金屬冶煉廠使用。
2025年,由於中國嚴厲打擊高排放蜂窩爐,導致邊際供應承壓,價格差異擴大至每噸35-40美元。 ISO 18894:2024標準現已納入鹼含量測量,新增的一項因素有利於能夠保證鈉鉀含量低於0.3%的低灰分生產商。這些品質標準進一步鞏固了冶金焦市場的結構性溢價。
區域分析
預計到2025年,亞太地區焦炭產量將佔全球總產量的69.70%,並在2031年之前保持4.16%的複合年成長率,這主要得益於中國4.8億噸的焦炭產量和印度鋼鐵產能的快速擴張。 2025年,中國生態環境部關閉了1,500萬噸不符合監管標準的焦炭產能,並將供應轉移到配備低排放焦炭品管(CDQ)設施的大規模國有企業。印度已將其焦爐產能擴大至4,500萬噸,但仍依賴進口5,400萬噸焦結煤,且冶金焦炭市場的跨境貿易已相當成熟。
2025年北美焦炭產量主要由SunCoke的通用焦爐和綜合鋼鐵廠承擔,但隨著美國鋼鐵公司優先發展電弧爐(EAF)生產並關閉老舊高爐,焦炭需求正在逐步放緩。加拿大唯一的焦爐Dofasco正面臨碳排放稅上調,這可能會加速其電氣化進程,並導致其在2031年前在區域冶金焦市場的需求佔有率下降。
在歐洲,由於苯排放法規更加嚴格,預計2025年歐洲鋼鐵產量將下降。隨著安賽樂米塔爾將其克拉科夫工廠改造為電弧爐(EAF),以及蒂森克虜伯測試氫氣噴射技術,到2035年,歐洲的需求可能會進一步下降。南美洲的需求保持穩定,但隨著沙烏地阿拉伯和埃及的鋼鐵廠擴大產能,中東和非洲的需求可能會增加。然而,這些地區對冶金焦進口的依賴程度仍然很高。
其他好處
- Excel格式的市場預測(ME)表
- 3個月的分析師支持
目錄
第1章:引言
- 研究假設和市場定義
- 調查範圍
第2章:調查方法
第3章執行摘要
第4章 市場狀況
- 市場促進因素
- 公共基礎設施對鋼鐵的需求增加
- 汽車產能擴張
- 提高綜合鋼鐵廠的生產能力
- 新興國家的都市建設熱潮
- 採用乾式淬火技術可實現高價銷售。
- 市場限制因素
- 冶金焦價格波動
- 焦化廠需遵守嚴格的環境法規
- 澳洲冶金煤物流中斷帶來的供應風險
- 價值鏈分析
- 波特五力模型
第5章 市場規模及成長預測(數量)
- 可樂型
- 高爐焦炭
- 用於鑄造的可樂
- 堅果
- 可口可樂微風
- 按年級
- 灰分含量低(灰分含量8-12%)
- 高灰分含量(灰分含量15%或以上)
- 透過使用
- 鋼鐵製造
- 鑄件
- 糖加工
- 玻璃製造
- 其他
- 按最終用戶行業分類
- 綜合鋼鐵製造商
- 小型磨機和電爐(EAF)營運商
- 鑄造廠
- 有色冶金
- 其他
- 按地區
- 亞太地區
- 中國
- 印度
- 日本
- 韓國
- ASEAN
- 其他亞太國家
- 北美洲
- 美國
- 加拿大
- 墨西哥
- 歐洲
- 德國
- 英國
- 義大利
- 法國
- 俄羅斯
- 其他歐洲國家
- 南美洲
- 巴西
- 阿根廷
- 其他南美國家
- 中東和非洲
- 沙烏地阿拉伯
- 阿拉伯聯合大公國
- 南非
- 埃及
- 其他中東和非洲國家
- 亞太地區
第6章 競爭情勢
- 市場集中度
- 策略趨勢
- 市佔率和排名分析
- 公司簡介
- ArcelorMittal
- BlueScope Steel Ltd.
- China Baowu Steel Group
- China Shenhua Energy Co. Ltd.
- Drummond Company Inc.
- Gujarat NRE Coke Ltd.(GNCL)
- Hickman-Williams & Company
- Jiangsu Surung High-Carbon Co. Ltd.
- JSW Steel Ltd.
- Mahalaxmi Ennore Coke Pvt Ltd
- Mechel PAO
- Nippon Steel Corporation
- OKK Koksovny as
- POSCO
- Shanxi Coking Coal Group
- SunCoke Energy Inc.
- Tata Steel Ltd.
- United States Steel Corporation
第7章 市場機會與未來展望
According to Mordor Intelligence, the metallurgical coke market size is expected to grow from 545.78 Million tons in 2025 to 563.85 Million tons in 2026 and is forecast to reach 675.19 Million tons by 2031 at a 3.67% CAGR over 2026-2031.
This report is Segmented by Coke Type (Blast-Furnace Coke and More), Grade (Low Ash (8 To 12% Ash) and High Ash (More Than 15% Ash)), Application (Iron and Steel Making, and More), End-User Industry (Integrated Steel Producers, Foundries, and More), and Geography (Asia-Pacific, North America, Europe, South America, and Middle-East and Africa). The Market Forecasts are Provided in Terms of Volume (tons).
Global Metallurgical Coke Market Trends and Insights
Rising Demand for Steel in Public Infrastructure
Governments in Asia-Pacific and the Middle East are allocating unprecedented budgets to highways, metro rail, and renewable-energy grids that require rebar and plate, both of which depend on blast-furnace routes using metallurgical coke. India's USD 1.4 trillion National Infrastructure Pipeline earmarks nearly one-quarter for transport projects, translating into steady coke offtake of roughly 0.8 tons per ton of crude steel. Saudi Arabia's NEOM and related megaprojects are projected to lift the kingdom's steel demand to 12 million tons by 2028, keeping regional mills on multi-year coke procurement contracts. Vietnam's North-South Expressway adds further pull, prompting Hoa Phat Group to install new blast furnaces with an extra 1.5 million tons of coke demand by 2027. Taken together, these programs underpin the positive demand trajectory of the metallurgical coke market.
Expanding Automotive Production Capacity
Light-vehicle output rebounded in China, India, and Thailand in 2025, yet steel intensity per vehicle eased as automakers adopted thinner high-strength steels and aluminum. China assembled 30.2 million vehicles in 2025, 4% above 2024, while average steel content slipped to 820 kg per car. Each incremental million vehicles in India still implies 180,000 tons of coke when blast-furnace share is considered, anchoring demand for the metallurgical coke industry despite gradual EAF inroads. Thailand's EV expansion sources more EAF steel from regional suppliers, hinting that vehicle electrification will eventually cap coke growth rates in Southeast Asia.
Metallurgical Coke Price Volatility
Spot hard-coking-coal prices swung between USD 210 and USD 340 per ton during 2024-2025 after Cyclone Jasper disrupted Queensland rail, compressing merchant-coke producer margins that average 6-8% EBITDA. India, which imported 54 million tons of coking coal in 2025, remains especially exposed, as 85% arrives from Australia. Futures hedging on the Dalian Commodity Exchange offers partial relief, yet physical-grade differentials leave basis risk.
Other drivers and restraints analyzed in the detailed report include:
- Capacity Additions in Integrated Steel Mills
- Urban Construction Boom in Emerging Economies
- Stringent Environmental Regulations on Coking Plants
For complete list of drivers and restraints, kindly check the Table Of Contents.
Segment Analysis
Blast-furnace coke accounted for 64.27% of global volume in 2025, underscoring its indispensable function as both reductant and structural support inside modern 1,500 °C furnaces. Nut coke is rising fastest at 4.25% CAGR because foundries crave 10-25 mm particles that enhance cupola permeability. Foundry coke retains its niche by supplying gray- and ductile-iron plants that demand CSR above 60% and sulfur below 0.6%. Coke breeze use is stagnating as mills shift from sinter to fluxed pellets, trimming the low-value tail of the metallurgical coke market.
Big Chinese integrated mills continue to specify high-CSR (greater than 65%) blast-furnace coke to withstand shaft pressures exceeding 15 bar in 5,000 m3 furnaces. Adoption of CDQ improves strength by 3-5 percentage points, allowing producers to fetch premiums even amid coal-price volatility. Over the forecast period, nut-coke demand will outpace blast-furnace growth, yet absolute tonnages favor the latter, cementing its status as the mainstay of the metallurgical coke market.
Low-ash (8-12%) coke captured 70.80% share in 2025 and is set to grow 4.59% annually, well ahead of high-ash alternatives. Each 1 percentage-point drop in ash trims slag by 15 kg per ton of hot metal, saving limestone and refractory costs. Consequently, mills commissioning furnaces above 4,500 m3 in India and China contract multi-year supplies of premium coal blends to secure low-ash output, locking in a quality-driven tier within the metallurgical coke market. High-ash coke, typically above 15%, retreats to legacy furnaces and non-ferrous smelters.
The price spread widened to USD 35-40 per ton in 2025 as China's crackdown on high-emission beehive ovens squeezed marginal supply. ISO 18894:2024 now measures alkali content, adding another lever that favors low-ash producers able to guarantee sodium and potassium below 0.3%. These quality screens reinforce the structural premium in the metallurgical coke market.
Complete Report Scope:
- By Coke Type
- Blast-Furnace Coke
- Foundry Coke
- Nut Coke
- Coke Breeze
- By Grade
- Low Ash (8 to 12% Ash)
- High Ash (more than 15% Ash)
- By Application
- Iron and Steel Making
- Foundry Castings
- Sugar Processing
- Glass Manufacturing
- Other Applications
- By End-User Industry
- Integrated Steel Producers
- Mini-mills / EAF Operators
- Foundries
- Non-ferrous Metallurgy
- Other End-user Industries
- By Geography
- Asia-Pacific
- China
- India
- Japan
- South Korea
- ASEAN Countries
- Rest of Asia-Pacific
- North America
- United States
- Canada
- Mexico
- Europe
- Germany
- United Kingdom
- Italy
- France
- Russia
- Rest of Europe
- South America
- Brazil
- Argentina
- Rest of South America
- Middle East and Africa
- Saudi Arabia
- United Arab Emirates
- South Africa
- Egypt
- Rest of Middle East and Africa
- Asia-Pacific
Geography Analysis
Asia-Pacific commanded 69.70% of volume in 2025 and will maintain a 4.16% CAGR to 2031, thanks to China's 480 million tons of coke production and India's rapid steel-capacity build-out. China's Ministry of Ecology and Environment shuttered 15 million tons of non-compliant capacity in 2025, shifting supply toward large, CDQ-equipped state enterprises with lower emission footprints. India expanded captive coke-oven capacity to 45 million tons, yet still relies on 54 million tons of coking-coal imports, cementing cross-border trade in the metallurgical coke market.
North America's production in 2025 was split between SunCoke merchant plants and integrated mills, but coke demand is gradually easing as US Steel idles older blast furnaces in favor of EAF routes. Canada's lone Dofasco oven faces rising carbon taxes that may accelerate electrification, potentially trimming regional metallurgical coke market demand share by 2031.
Europe's output fell in 2025 amid stricter benzene limits. With ArcelorMittal converting Krakow to an EAF and thyssenkrupp trialing hydrogen injection, European demand could drop further by 2035. South America remains stable, whereas the Middle East and Africa together may rise as Saudi and Egyptian mills add capacity, albeit with heavy dependence on imports via the metallurgical coke market.
- ArcelorMittal
- BlueScope Steel Ltd.
- China Baowu Steel Group
- China Shenhua Energy Co. Ltd.
- Drummond Company Inc.
- Gujarat NRE Coke Ltd. (GNCL)
- Hickman-Williams & Company
- Jiangsu Surung High-Carbon Co. Ltd.
- JSW Steel Ltd.
- Mahalaxmi Ennore Coke Pvt Ltd
- Mechel PAO
- Nippon Steel Corporation
- OKK Koksovny a.s.
- POSCO
- Shanxi Coking Coal Group
- SunCoke Energy Inc.
- Tata Steel Ltd.
- United States Steel Corporation
Additional Benefits:
- The market estimate (ME) sheet in Excel format
- 3 months of analyst support
TABLE OF CONTENTS
1 Introduction
- 1.1 Study Assumptions & Market Definition
- 1.2 Scope of the Study
2 Research Methodology
3 Executive Summary
4 Market Landscape
- 4.1 Market Drivers
- 4.1.1 Rising demand for steel in public infrastructure
- 4.1.2 Expanding automotive production capacity
- 4.1.3 Capacity additions in integrated steel mills
- 4.1.4 Urban construction boom in emerging economies
- 4.1.5 Adoption of dry-quenching technology enabling premium pricing
- 4.2 Market Restraints
- 4.2.1 Metallurgical coke price volatility
- 4.2.2 Stringent environmental regulations on coking plants
- 4.2.3 Supply risk from Australian met-coal logistics disruptions
- 4.3 Value Chain Analysis
- 4.4 Porter's Five Forces
- 4.4.1 Bargaining Power of Suppliers
- 4.4.2 Bargaining Power of Buyers
- 4.4.3 Threat of New Entrants
- 4.4.4 Threat of Substitutes
- 4.4.5 Degree of Competition
5 Market Size and Growth Forecasts ( Volume)
- 5.1 By Coke Type
- 5.1.1 Blast-Furnace Coke
- 5.1.2 Foundry Coke
- 5.1.3 Nut Coke
- 5.1.4 Coke Breeze
- 5.2 By Grade
- 5.2.1 Low Ash (8 to 12% Ash)
- 5.2.2 High Ash (more than 15% Ash)
- 5.3 By Application
- 5.3.1 Iron and Steel Making
- 5.3.2 Foundry Castings
- 5.3.3 Sugar Processing
- 5.3.4 Glass Manufacturing
- 5.3.5 Other Applications
- 5.4 By End-User Industry
- 5.4.1 Integrated Steel Producers
- 5.4.2 Mini-mills / EAF Operators
- 5.4.3 Foundries
- 5.4.4 Non-ferrous Metallurgy
- 5.4.5 Other End-user Industries
- 5.5 By Geography
- 5.5.1 Asia-Pacific
- 5.5.1.1 China
- 5.5.1.2 India
- 5.5.1.3 Japan
- 5.5.1.4 South Korea
- 5.5.1.5 ASEAN Countries
- 5.5.1.6 Rest of Asia-Pacific
- 5.5.2 North America
- 5.5.2.1 United States
- 5.5.2.2 Canada
- 5.5.2.3 Mexico
- 5.5.3 Europe
- 5.5.3.1 Germany
- 5.5.3.2 United Kingdom
- 5.5.3.3 Italy
- 5.5.3.4 France
- 5.5.3.5 Russia
- 5.5.3.6 Rest of Europe
- 5.5.4 South America
- 5.5.4.1 Brazil
- 5.5.4.2 Argentina
- 5.5.4.3 Rest of South America
- 5.5.5 Middle East and Africa
- 5.5.5.1 Saudi Arabia
- 5.5.5.2 United Arab Emirates
- 5.5.5.3 South Africa
- 5.5.5.4 Egypt
- 5.5.5.5 Rest of Middle East and Africa
- 5.5.1 Asia-Pacific
6 Competitive Landscape
- 6.1 Market Concentration
- 6.2 Strategic Moves
- 6.3 Market Share(%)/Ranking Analysis
- 6.4 Company Profiles (includes Global level Overview, Market level overview, Core Segments, Financials as available, Strategic Information, Products and Services, and Recent Developments)
- 6.4.1 ArcelorMittal
- 6.4.2 BlueScope Steel Ltd.
- 6.4.3 China Baowu Steel Group
- 6.4.4 China Shenhua Energy Co. Ltd.
- 6.4.5 Drummond Company Inc.
- 6.4.6 Gujarat NRE Coke Ltd. (GNCL)
- 6.4.7 Hickman-Williams & Company
- 6.4.8 Jiangsu Surung High-Carbon Co. Ltd.
- 6.4.9 JSW Steel Ltd.
- 6.4.10 Mahalaxmi Ennore Coke Pvt Ltd
- 6.4.11 Mechel PAO
- 6.4.12 Nippon Steel Corporation
- 6.4.13 OKK Koksovny a.s.
- 6.4.14 POSCO
- 6.4.15 Shanxi Coking Coal Group
- 6.4.16 SunCoke Energy Inc.
- 6.4.17 Tata Steel Ltd.
- 6.4.18 United States Steel Corporation
7 Market Opportunities and Future Outlook
- 7.1 White-space and Unmet-need Assessment


