


 |
市場調查報告書
商品編碼
2122905
雲端微服務:市場佔有率分析、產業趨勢與統計、成長預測(2026-2031)Cloud Microservices - Market Share Analysis, Industry Trends & Statistics, Growth Forecasts (2026 - 2031) |
||||||

※ 本網頁內容可能與最新版本有所差異。詳細情況請與我們聯繫。
根據 Mordor Intelligence 預測,雲端微服務市場預計將在 2026 年達到 23.1 億美元,並在 2031 年擴展到 53.8 億美元,複合年成長率為 18.42%。
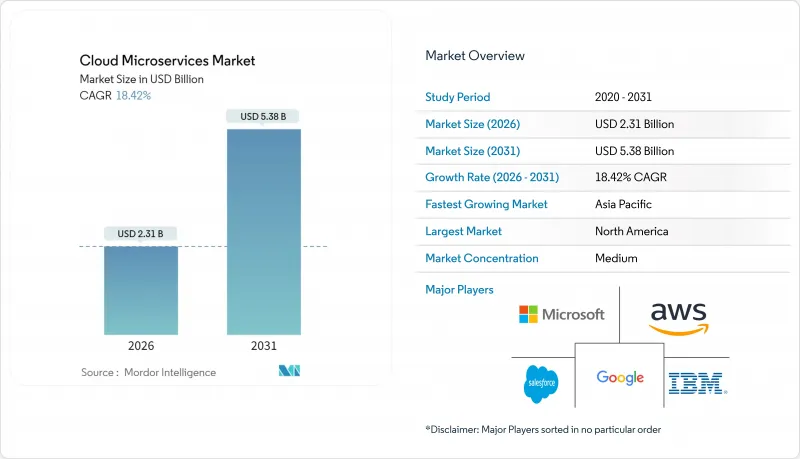
本報告按組件(平台和服務)、企業規模(中小企業和大型企業)、最終用戶行業(銀行、金融服務和保險、零售和電子商務、製造業、IT和電信、醫療保健和生命科學等)、雲端類型(公共雲端、私有雲端、混合雲和多重雲端)以及地區進行細分。市場預測以價值(美元)表示。
全球雲端微服務市場趨勢與洞察
為了縮短發布週期,從單體架構轉變為領域驅動設計的趨勢日益明顯。
大型企業正在將單體程式碼庫拆分成反映業務功能的“綁定上下文”,從而降低協調成本並實現獨立發布。一家歐洲零售銀行透露,遷移到微服務架構後,配置前置作業時間從六週縮短至三天,使其能夠根據利率波動快速發布產品。製造企業正在將類似的模式應用於生產調度,從而無需跨部門協調工廠車間的變更。根據紅帽公司2025年的一項調查,68%的IT領導者認為微服務對於持續交付至關重要,高於2024年的54%。然而,這些成果也伴隨著前期成本,因為團隊需要就服務邊界達成一致並執行一致的API契約。
Kubernetes 服務網格加速器的主流化
服務網格現在將 mTLS、流量整形和追蹤功能整合到一個可重複使用的控制平面中,從而減輕了開發人員的維運負擔。 2025 年 3 月,Google Cloud 為 Traffic Director 新增了自動 Sidecar 注入功能,消除了先前阻礙其普及的手動 YAML 編輯步驟。金融機構正依靠服務網格來滿足《數位營運彈性法案》(Digital Operational Resilience Act) 中規定的零信任要求。根據 Linux 基金會的一項調查,到 2025 年,在營運 50 項或以上服務的公司中,將有 58% 在生產環境中部署服務網格,高於前一年的 41%。集中式策略執行可以減少配置偏差並改善事件回應,這將進一步推動雲端微服務市場的成長。
跨服務安全性、可觀測性和資料蔓延的複雜性
每個微服務都會建立一條新的東西向流量路徑,需要進行身份驗證、授權和加密。根據雲端安全聯盟 (Cloud Security Alliance) 的一項調查,到 2025 年,64% 的組織將至少經歷一次因跨服務身分驗證配置錯誤而導致的事件。工具的激增加劇了可見性的下降,因為不同的平台收集日誌、指標和追蹤信息,阻礙了根本原因分析。 OpenTelemetry 2025 年的一項調查顯示,只有 38% 的組織能夠實現所有服務的統一可觀測性。快取資料副本作為一種延遲衡量指標,進一步增加了資料儲存合規性的複雜性,尤其對於服務於醫療保健和金融等受監管行業的雲端微服務供應商而言更是如此。
細分市場分析
平台產品預計在2025年將佔總營收的55.46%,凸顯了其在雲端微服務市場中作為容器編排管理、API管理和無伺服器執行控制平面的重要角色。 Red Hat、VMware和Rancher的Kubernetes發行版負責管理工作負載調度和資源配額,而Kong、MuleSoft和Apigee的閘道則負責管理路由和限流。雲端微服務平台市場的規模得益於訂閱模式,這種模式能夠帶來高額的經常性收入和較高的轉換成本。服務領域涵蓋諮詢、部署和維運,預計到2031年將以18.88%的複合年成長率成長,因為企業需要協助來打破單體系統並管理新的服務邊界。
服務業正受益於基於績效的定價模式以及負責日常站點可靠性管理任務的供應商的崛起。塔塔諮詢服務公司(Tata Consultancy Services)報告稱,2025會計年度與雲端原生應用相關的合約年增34%。平台供應商正在將諮詢和支援服務捆綁銷售,模糊了授權收入和服務收入之間的界線。儘管服務業成長迅速,但週期性仍強於平台產業。然而,與運轉率和SLA目標掛鉤的長期合約正在提高收入的可預測性。這兩個領域透過將軟體功能與實務經驗相結合,共同推動了雲端微服務市場的結構性擴張。
到 2025 年,大型企業將佔據 61.73% 的市場。這反映了它們雄厚的預算以及運營跨多個雲端平台數百項服務所需的專業工程人才。這些公司也正在實施先進的可觀測性和策略主導的安全措施,從而進一步推動雲端微服務市場的擴張。預計到 2031 年,中小企業 (SME) 的複合年成長率將達到 20.53%,因為託管式 Kubernetes 和無伺服器服務消除了對本地叢集運維的需求。
AWS Elastic Container Service 和 Google Cloud Run 等服務可自動執行擴充和修補,讓中小企業 (SME) 能夠以與大規模競爭對手相同的頻率進行部署。美國小型企業管理局 (SBA) 的一項研究發現,採用雲端原生解決方案的中小企業發布新功能的速度比使用傳統託管的競爭對手快 40%。然而,仍存在一些障礙,例如可觀測性預算有限以及不斷增加的出站費用負擔(在多區域配置中,出站費用可能高達雲端總支出的 15%)。像 K3s 這樣的輕量級開放原始碼發行版對注重成本的公司很有吸引力,但它們需要更高級的實踐技能,這凸顯了雲端微服務市場中持續影響採用模式的各種權衡取捨。
區域分析
預計到2025年,北美將佔全球營收的41.33%,這主要得益於該地區高密度的超大規模超大規模資料中心業者和經驗豐富的DevOps人才儲備。聯邦政府撥款82億美元用於雲端現代化建設,並強制要求在新數位專案中採用微服務架構,進一步推動了該地區的需求。在加拿大,數位銀行的升級正在推動這一趨勢;而在墨西哥,微服務正被用於近岸外包,以提高供應鏈的透明度。過去,接近性供應商總部能夠讓企業提前體驗新功能,但隨著全球市場的成熟,這種優勢逐漸減弱。
預計到2031年,亞太地區將以22.12%的複合年成長率成長,成為雲端微服務市場成長最快的地區。印度的統一支付介面(UPI)每月在微服務平台上處理超過100億筆交易,而中國正在推廣採用自主開發的Kubernetes發行版,以符合資料本地化法規的要求。印尼和越南的新創企業從一開始就採用微服務架構,以避免舊有系統的束縛。儘管人才短缺和監管不一致構成了一些阻力,但強制性的主權雲和5G的部署正在推動其長期成長。
在歐洲,微服務正受到《一般資料保護規則》(GDPR) 和《數位營運彈性法案》(DORA) 嚴格要求的約束,企業對基於 Gaia-X 框架的私有雲端雲和混合雲端的興趣日益濃厚。德國、英國和法國在投資方面處於領先地位,尤其是在汽車和銀行業。南美洲雖然發展落後,但隨著巴西銀行為遵守開放銀行要求而分離其核心系統,以及阿根廷在數位錢包中試點微服務,南美洲的發展勢頭正在增強。在中東和非洲,沙烏地阿拉伯和阿拉伯聯合大公國正在推行「雲端優先」政策以實現經濟多元化,而奈及利亞的金融科技公司則在頻寬受限的情況下,利用微服務擴大行動支付的覆蓋範圍。每個地區都有其自身的監管環境和基礎設施,從而推動了全球雲端運算和微服務市場的整體發展。
其他好處:
- Excel格式的市場預測(ME)表
- 3個月的分析師支持
目錄
第1章:引言
- 研究假設和市場定義
- 調查範圍
第2章:調查方法
第3章執行摘要
第4章 市場狀況
- 市場概覽
- 市場促進因素
- 數位原生企業迅速採用「微服務優先」應用程式設計。
- 為了縮短發布週期,越來越多的公司正在從單體架構轉向領域驅動設計。
- Kubernetes 服務網格加速器的主流化
- 雲端供應商提供的託管微服務平台正在降低整體擁有成本 (TCO)。
- 面向低延遲物聯網工作負載的邊緣原生微服務
- 特定產業的微服務藍圖(例如銀行核心系統)正在推動行業特定的採用。
- 市場限制因素
- 跨服務安全、可觀測性以及與資料擴散相關的複雜性。
- 分散式系統工程技能差距
- 多重雲端服務網格中不斷上升的出口成本
- 跨國微交易API監理方面的不確定性
- 產業價值鏈分析
- 監理情勢
- 技術展望
- 波特五力分析
第5章 市場規模與成長預測
- 按組件
- 平台
- 服務
- 按公司規模
- 中小企業
- 大公司
- 按最終用戶行業分類
- 銀行、金融服務和保險(BFSI)
- 零售與電子商務
- 製造業
- 資訊科技/通訊
- 醫療保健和生命科學
- 政府/公共部門
- 其他終端用戶產業
- 按雲類型
- 公共雲端
- 私有雲端
- 混合雲端和多重雲端
- 按地區
- 北美洲
- 美國
- 加拿大
- 墨西哥
- 南美洲
- 巴西
- 阿根廷
- 其他南美國家
- 歐洲
- 德國
- 英國
- 法國
- 義大利
- 西班牙
- 其他歐洲國家
- 亞太地區
- 中國
- 日本
- 印度
- 韓國
- ASEAN
- 其他亞太國家
- 中東
- 沙烏地阿拉伯
- 阿拉伯聯合大公國
- 其他中東國家
- 非洲
- 南非
- 奈及利亞
- 其他非洲國家
- 北美洲
第6章 競爭情勢
- 市場集中度
- 策略趨勢
- 市佔率分析
- 公司簡介
- Amazon Web Services, Inc.
- Microsoft Corporation
- International Business Machines Corporation
- Google LLC
- Salesforce, Inc.
- Oracle Corporation
- Broadcom Inc.(incl. CA Technologies)
- VMware, Inc.
- Red Hat, Inc.
- Tata Consultancy Services Limited
- Infosys Limited
- NGINX, Inc.(F5 Networks)
- Docker, Inc.
- Kong Inc.
- MuleSoft LLC
- Accenture PLC
- DXC Technology
- RapidValue Solutions Private Limited
- HashiCorp, Inc.
- Wipro Limited
- Capgemini SE
- Cognizant Technology Solutions Corporation
- Progress Software Corporation
- Akamai Technologies, Inc.
第7章 市場機會與未來展望
According to Mordor Intelligence, the cloud microservices market size reached USD 2.31 billion in 2026 and is projected to climb to USD 5.38 billion by 2031, reflecting an 18.42% CAGR.
This report is Segmented by Component (Platform, and Services), Enterprise Size (Small and Medium Enterprises, and Large Enterprises), End-User Industry (BFSI, Retail and E-Commerce, Manufacturing, IT and Telecom, Healthcare and Life Sciences, and More), Cloud Type (Public Cloud, Private Cloud, and Hybrid and Multi-Cloud), and Geography. The Market Forecasts are Provided in Terms of Value (USD).
Global Cloud Microservices Market Trends and Insights
Rising Enterprise Transition From Monolith To Domain-Driven Design For Faster Release Cycles
Large organizations are segmenting monolithic codebases into bounded contexts that mirror business capabilities, which reduces coordination overhead and permits independent releases. A European retail bank disclosed that microservices migration cut deployment lead time from six weeks to three days, allowing rapid product launches tied to interest-rate shifts. Manufacturing firms have applied the same pattern to production scheduling so shop-floor changes no longer require multi-department coordination. Red Hat's 2025 survey showed 68% of IT leaders viewing microservices as critical for continuous delivery, up from 54% in 2024. These gains come with upfront costs, because teams must agree on service boundaries and enforce consistent API contracts.
Mainstream Adoption Of Kubernetes-Based Service Mesh Accelerators
Service meshes now package mTLS, traffic shaping and tracing into a reusable control plane that lifts operational burdens from developers. Google Cloud added automatic sidecar injection to Traffic Director in March 2025, removing manual YAML edits that once deterred adoption. Financial institutions are relying on meshes to meet zero-trust mandates embedded in the Digital Operational Resilience Act. The Linux Foundation found that 58% of enterprises running more than 50 services had a mesh in production in 2025, versus 41% a year earlier. Centralizing policy enforcement reduces configuration drift and improves incident response, which supports the broader growth of the cloud microservices market.
Service-To-Service Security, Observability And Data Sprawl Complexities
Each microservice introduces new east-west traffic paths that must be authenticated, authorized and encrypted. The Cloud Security Alliance found that 64% of organizations suffered at least one incident tied to misconfigured inter-service authentication in 2025. Tool sprawl worsens visibility because separate platforms collect logs, metrics and traces, hindering root-cause analysis. Only 38% of firms achieved unified observability across all services, according to the OpenTelemetry 2025 survey. Data replicas cached for latency reasons further complicate compliance with residency rules, especially for cloud microservices market vendors serving regulated sectors such as healthcare and finance.
Other drivers and restraints analyzed in the detailed report include:
- Cloud-Provider Managed Microservices Platforms Lowering Total Cost Of Ownership
- Rapid Proliferation Of Microservices-First Application Design Among Digital-Native Firms
- Skills Gap In Distributed Systems Engineering
For complete list of drivers and restraints, kindly check the Table Of Contents.
Segment Analysis
Platform products accounted for 55.46% of 2025 revenue, underscoring their role as the control plane for container orchestration, API management and serverless execution within the cloud microservices market. Kubernetes distributions from Red Hat, VMware and Rancher enforce workload scheduling and resource quotas, while gateways from Kong, MuleSoft and Apigee manage routing and throttling. The cloud microservices market size for platforms is anchored by subscription models that produce sticky recurring revenue and high switching costs. Services, which cover consulting, implementation and managed operations, are projected to rise at an 18.88% CAGR to 2031 as organizations seek help in decomposing monoliths and governing new service boundaries.
The services line benefits from outcome-based pricing and from the emergence of providers that shoulder day-to-day site-reliability tasks. Tata Consultancy Services reported 34% year-over-year growth in cloud-native application engagements during fiscal 2025. Platform vendors are bundling advisory and support offerings, blurring the divide between license and services income. Despite faster growth, services remain more exposed to economic cycles than platforms, yet long-term contracts tied to uptime and service-level objectives are improving predictability. Together, the two segments reinforce the structural expansion of the cloud microservices market by matching software capabilities with hands-on expertise.
Large organizations held 61.73% share in 2025, reflecting deep budgets and access to specialized engineering talent needed to run hundreds of services across multiple clouds. They deploy advanced observability and policy-driven security, which further enlarges the cloud microservices market. Small and medium enterprises are forecast to expand at a 20.53% CAGR through 2031 because managed Kubernetes and serverless offerings remove the need for in-house cluster operations.
Services such as AWS Elastic Container Service and Google Cloud Run automate scaling and patching, giving SMEs parity with larger rivals on deployment cadence. A study by the U.S. Small Business Administration found that cloud-native SMEs launched new features 40% faster than peers on traditional hosting. Barriers persist, including limited budgets for observability and higher exposure to egress fees, which can reach 15% of total cloud spend for multi-region designs. Open-source lightweight distributions like K3s appeal to cost-conscious firms but require more hands-on skills, revealing a spectrum of trade-offs that continue to shape cloud microservices market adoption patterns.
Complete Report Scope:
- By Component
- Platform
- Services
- By Enterprise Size
- Small and Medium Enterprises (SMEs)
- Large Enterprises
- By End-User Industry
- Banking, Financial Services and Insurance (BFSI)
- Retail and E-commerce
- Manufacturing
- IT and Telecom
- Healthcare and Life Sciences
- Government and Public Sector
- Other End-User Industries
- By Cloud Type
- Public Cloud
- Private Cloud
- Hybrid and Multi-Cloud
- By Geography
- North America
- United States
- Canada
- Mexico
- South America
- Brazil
- Argentina
- Rest of South America
- Europe
- Germany
- United Kingdom
- France
- Italy
- Spain
- Rest of Europe
- Asia-Pacific
- China
- Japan
- India
- South Korea
- ASEAN
- Rest of Asia-Pacific
- Middle East
- Saudi Arabia
- United Arab Emirates
- Rest of Middle East
- Africa
- South Africa
- Nigeria
- Rest of Africa
- North America
Geography Analysis
North America generated 41.33% of 2025 revenue, supported by dense hyperscaler footprints and experienced DevOps labor pools. Federal agencies allotted USD 8.2 billion to cloud modernization and required microservices architectures in new digital projects, which fortified regional demand. Canada saw momentum from digital banking upgrades, and Mexico leveraged microservices for near-shoring supply-chain visibility. Close proximity to vendor headquarters once gave early access to emerging features, yet that advantage is narrowing as global regions mature.
Asia-Pacific is projected to advance at a 22.12% CAGR through 2031, the highest regional pace in the cloud microservices market. India's Unified Payments Interface handles more than 10 billion monthly transactions on a microservices foundation, while China promotes indigenous Kubernetes distributions to meet data-localization law. Start-ups in Indonesia and Vietnam deploy microservices from inception, bypassing legacy constraints. Talent shortages and fragmented regulations pose headwinds, but sovereign-cloud mandates and 5G rollouts sustain long-run growth.
Europe adopts microservices under the rigor of the General Data Protection Regulation and the Digital Operational Resilience Act, driving interest in private and hybrid clouds tied to the Gaia-X framework. Germany, the United Kingdom and France spearhead spending, especially across automotive and banking. South America lags but gains traction as Brazilian banks unbundle cores for open-banking compliance, while Argentina pilots microservices in digital wallets. In the Middle East and Africa, Saudi Arabia and the United Arab Emirates enforce cloud-first policies to diversify economies, and Nigerian fintech firms leverage microservices to extend mobile money reach despite bandwidth constraints. Each region contributes distinct regulations and infrastructure profiles that collectively enlarge the global cloud microservices market.
- Amazon Web Services, Inc.
- Microsoft Corporation
- International Business Machines Corporation
- Google LLC
- Salesforce, Inc.
- Oracle Corporation
- Broadcom Inc. (incl. CA Technologies)
- VMware, Inc.
- Red Hat, Inc.
- Tata Consultancy Services Limited
- Infosys Limited
- NGINX, Inc. (F5 Networks)
- Docker, Inc.
- Kong Inc.
- MuleSoft LLC
- Accenture PLC
- DXC Technology
- RapidValue Solutions Private Limited
- HashiCorp, Inc.
- Wipro Limited
- Capgemini SE
- Cognizant Technology Solutions Corporation
- Progress Software Corporation
- Akamai Technologies, Inc.
Additional Benefits:
- The market estimate (ME) sheet in Excel format
- 3 months of analyst support
TABLE OF CONTENTS
1 INTRODUCTION
- 1.1 Study Assumptions and Market Definition
- 1.2 Scope of the Study
2 RESEARCH METHODOLOGY
3 EXECUTIVE SUMMARY
4 MARKET LANDSCAPE
- 4.1 Market Overview
- 4.2 Market Drivers
- 4.2.1 Rapid Proliferation of Microservices-first Application Design Among Digital-native Firms
- 4.2.2 Rising Enterprise Transition from Monolith to Domain-driven Design for Faster Release Cycles
- 4.2.3 Mainstream Adoption of Kubernetes-based Service Mesh Accelerators
- 4.2.4 Cloud-provider Managed Microservices Platforms Lowering Total Cost of Ownership
- 4.2.5 Edge-native Microservices for Low-latency IoT Workloads
- 4.2.6 Industry-specific Microservices Blueprints (e.g., banking cores) Driving Vertical Uptake
- 4.3 Market Restraints
- 4.3.1 Service-to-service Security, Observability and Data Sprawl Complexities
- 4.3.2 Skills Gap in Distributed Systems Engineering
- 4.3.3 Rising Egress Costs in Multi-cloud Service Meshes
- 4.3.4 Regulatory Uncertainty Over Cross-border Micro-transactions APIs
- 4.4 Industry Value Chain Analysis
- 4.5 Regulatory Landscape
- 4.6 Technological Outlook
- 4.7 Porter's Five Forces Analysis
- 4.7.1 Bargaining Power of Suppliers
- 4.7.2 Bargaining Power of Buyers
- 4.7.3 Threat of New Entrants
- 4.7.4 Threat of Substitutes
- 4.7.5 Intensity of Competitive Rivalry
5 MARKET SIZE AND GROWTH FORECASTS (VALUE)
- 5.1 By Component
- 5.1.1 Platform
- 5.1.2 Services
- 5.2 By Enterprise Size
- 5.2.1 Small and Medium Enterprises (SMEs)
- 5.2.2 Large Enterprises
- 5.3 By End-User Industry
- 5.3.1 Banking, Financial Services and Insurance (BFSI)
- 5.3.2 Retail and E-commerce
- 5.3.3 Manufacturing
- 5.3.4 IT and Telecom
- 5.3.5 Healthcare and Life Sciences
- 5.3.6 Government and Public Sector
- 5.3.7 Other End-User Industries
- 5.4 By Cloud Type
- 5.4.1 Public Cloud
- 5.4.2 Private Cloud
- 5.4.3 Hybrid and Multi-Cloud
- 5.5 By Geography
- 5.5.1 North America
- 5.5.1.1 United States
- 5.5.1.2 Canada
- 5.5.1.3 Mexico
- 5.5.2 South America
- 5.5.2.1 Brazil
- 5.5.2.2 Argentina
- 5.5.2.3 Rest of South America
- 5.5.3 Europe
- 5.5.3.1 Germany
- 5.5.3.2 United Kingdom
- 5.5.3.3 France
- 5.5.3.4 Italy
- 5.5.3.5 Spain
- 5.5.3.6 Rest of Europe
- 5.5.4 Asia-Pacific
- 5.5.4.1 China
- 5.5.4.2 Japan
- 5.5.4.3 India
- 5.5.4.4 South Korea
- 5.5.4.5 ASEAN
- 5.5.4.6 Rest of Asia-Pacific
- 5.5.5 Middle East
- 5.5.5.1 Saudi Arabia
- 5.5.5.2 United Arab Emirates
- 5.5.5.3 Rest of Middle East
- 5.5.6 Africa
- 5.5.6.1 South Africa
- 5.5.6.2 Nigeria
- 5.5.6.3 Rest of Africa
- 5.5.1 North America
6 COMPETITIVE LANDSCAPE
- 6.1 Market Concentration
- 6.2 Strategic Moves
- 6.3 Market Share Analysis
- 6.4 Company Profiles (includes Global level Overview, Market Level Overview, Core Segments, Financials as Available, Strategic Information, Market Rank/Share for Key Companies, Products and Services, and Recent Developments)
- 6.4.1 Amazon Web Services, Inc.
- 6.4.2 Microsoft Corporation
- 6.4.3 International Business Machines Corporation
- 6.4.4 Google LLC
- 6.4.5 Salesforce, Inc.
- 6.4.6 Oracle Corporation
- 6.4.7 Broadcom Inc. (incl. CA Technologies)
- 6.4.8 VMware, Inc.
- 6.4.9 Red Hat, Inc.
- 6.4.10 Tata Consultancy Services Limited
- 6.4.11 Infosys Limited
- 6.4.12 NGINX, Inc. (F5 Networks)
- 6.4.13 Docker, Inc.
- 6.4.14 Kong Inc.
- 6.4.15 MuleSoft LLC
- 6.4.16 Accenture PLC
- 6.4.17 DXC Technology
- 6.4.18 RapidValue Solutions Private Limited
- 6.4.19 HashiCorp, Inc.
- 6.4.20 Wipro Limited
- 6.4.21 Capgemini SE
- 6.4.22 Cognizant Technology Solutions Corporation
- 6.4.23 Progress Software Corporation
- 6.4.24 Akamai Technologies, Inc.
7 MARKET OPPORTUNITIES AND FUTURE OUTLOOK
- 7.1 White-space and Unmet-Need Assessment

 全球微服務目錄市場報告,2026 年
 雲端微服務市場:按組件、服務、企業規模、部署方式、最終用戶、國家和地區分類 - 全球產業分析、市場規模與佔有率及未來預測(2026-2033)
 雲端微服務全球市場規模、佔有率、趨勢和成長分析報告(2026-2034)
 服務搜尋軟體市場規模、佔有率和成長分析:按部署類型、組件、應用、最終用戶和地區分類-2026-2033年產業預測
 雲端微服務市場:按服務類型、組織規模、部署模式和產業分類 - 2026-2032 年全球預測2026年全球雲端微服務市場報告全球雲端微服務市場:市場規模、佔有率、成長率、產業分析、依類型、應用和地區劃分的分析以及未來預測(2026-2034)
 雲端微服務市場 - 全球產業規模、佔有率、趨勢、機會和預測,按組件、部署模式、企業類型、最終用戶、地區和競爭格局細分,2021-2031 年預測
 雲端微服務市場規模、佔有率和成長分析(按組件、組織規模、部署模式、垂直產業和地區分類)-2026-2033年產業預測