


 |
市場調查報告書
商品編碼
2122829
電容器:市場佔有率分析、產業趨勢與統計、成長預測(2026-2031)Capacitor - Market Share Analysis, Industry Trends & Statistics, Growth Forecasts (2026 - 2031) |
||||||

※ 本網頁內容可能與最新版本有所差異。詳細情況請與我們聯繫。
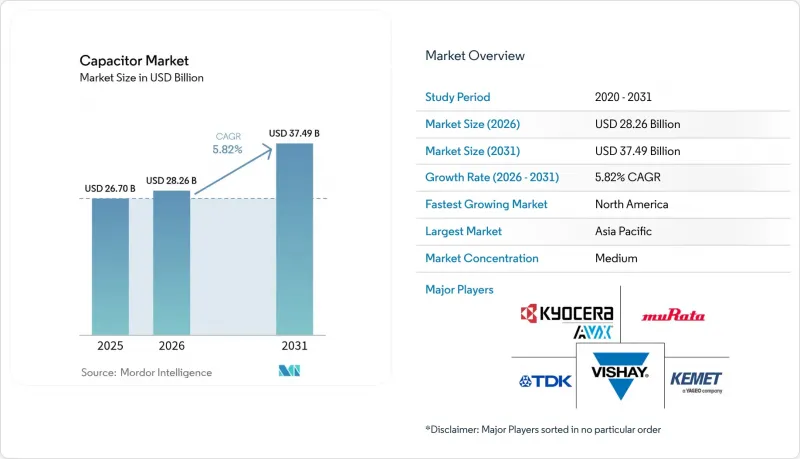
2025 年電容器市場價值為 267 億美元,預計到 2031 年將達到 374.9 億美元,而 2026 年為 282.6 億美元,預測期(2026-2031 年)複合年成長率為 5.82%。
本報告按類型(陶瓷、鉭等)、電壓範圍(低壓≤100V、中壓100V至1kV、高壓>1kV)、安裝方式(表面黏著技術、通孔)、終端用戶行業(汽車、工業、能源電力、家用電子電器等)和地區(北美、南美、歐洲、亞太等)進行細分。市場預測以美元計價。
全球電容器市場趨勢與洞察
電動車中電力電子技術的應用日益廣泛
預計到2024年,電動車(EV)產量將達到1,730萬輛,較去年同期成長25%。這將直接轉化為牽引逆變器用高壓薄膜電容器需求的成長。目前,單輛電池式電動車包含超過15,000個MLCC(多層陶瓷電容器),是傳統內燃機汽車基本數量的四倍。此外,高階800V驅動系統需要具有更高耐壓性和熱穩定性的裝置。獲得AEC-Q200認證的電容器供應商已實現多年的產品藍圖應用,使其不易受家用電子電器市場波動的影響。 TDK的3225封裝尺寸的100V、10µF MLCC就是一個典型的例子,它在不增加體積的情況下突破了性能極限。因此,其平均售價呈現結構性上漲,進一步強化了電氣化與電容器市場之間的良性循環。
5G/FTTx 的快速部署正在推動對高頻 MLCC 的需求。
預計到2024年底,將有超過300家電信公司推出商用5G服務,分析師預測,到2029年,全球75%的行動數據將透過5G基礎設施傳輸。大規模MIMO天線陣列需要頻率高於6GHz頻段且介電損耗極低的電容器,但傳統陶瓷材料難以滿足此規格要求。因此,三星電機正利用其最初為電信基地台開發的技術,力爭實現面向聯網汽車平台的汽車級MLCC(多層陶瓷電容器)1兆韓元的銷售額。村田製作所的006003吋MLCC比傳統產品小75%,體現了在維持電氣性能指標的同時,不斷追求小型化的競爭精神。每個基地台的無線基板都安裝了數萬個電容器,隨著5G部署的擴展,電容器市場必將繼續與全球頻寬消耗趨勢緊密相連。
高容量陶瓷MLCC供應鏈的波動
由於鈦酸鋇供不應求,預計到2024年,汽車用多層陶瓷電容器(MLCC)的前置作業時間將延長至六個月以上,凸顯了地域集中帶來的風險,因為中國壟斷了前驅體加工。符合AEC-Q200標準的電容器良率仍低於70%,每次供應緊張都會引發汽車和通訊業客戶之間的配額競爭。升級設備以實現更薄的介電層進一步加劇了供應限制,因為隨著介電層厚度接近物理極限,需要超高純度的原料。儘管歐美製造商宣布擴大產能,但新工廠的認證可能需要長達兩年的時間,這意味著短期供應失衡的情況可能會持續存在。
細分市場分析
陶瓷電容器憑藉其在體積效率和高耐熱性之間的平衡,預計到2025年將佔據電容器市場41.92%的佔有率,即使其他介質材料在細分市場站穩腳跟,陶瓷電容器仍將保持其銷售領先地位。這一領域的成長勢頭源於層數的不斷增加和控制精度的提高,例如村田製作所推出的006003英寸MLCC,在保持電容的同時,尺寸縮小了75%。未來的成長將取決於鎳阻擋端子的應用,鎳阻擋端子可以防止高溫下的遷移,同時降低與銀和鈀相關的成本風險。
超級電容和超電容器正推動混合總線線路的發展,將高壓鋰離子電池組與碳基電源緩衝器結合,其複合年成長率(CAGR)高達7.38%,位居所有類型電容器之首。鉭元件在醫療植入和航空電子模組領域仍佔據重要地位,其體積效率足以抵消成本溢價,但由於礦石採購問題,價格波動性日益加劇。電解電容器繼續應用於高壓電源插座,在這些應用中,突波電流處理能力比耐用性更為重要。薄膜電容器的需求呈現兩極化。聚丙烯薄膜電容器在可再生能源轉換器中的需求不斷成長,而聚四氟乙烯(PTFE)基產品則面臨著與全氟烷基和多氟烷基物質(PFAS)相關的逐步淘汰法規。
2025年,低壓設備(100V以下),主要包括智慧型手機、穿戴式裝置和資訊娛樂主機,將佔總銷售額的48.74%。同時,隨著800V電池式電動車和串聯電容器組的普及,高壓類產品(>1kV)預計將以6.33%的複合年成長率加速成長。這些因素正在擴大用於電力傳輸調節的電容器的市場規模。中壓元件(100V至1kV)也在穩步成長,因為機器人技術和工廠自動化維修正在向更高的直流母線電壓等級轉移,以提高效率。
設計人員對電阻控制型高壓疊層元件的需求日益成長,這種元件結合了陶瓷和薄膜技術,能夠抑制寬能隙半導體開關中的振鈴現象。提供混合模組的供應商正在搶佔高階市場,這充分證明了能夠同時應對高漣波電流和局部放電耐受性的解決方案的附加價值。由此帶來的產品差異化使得價格在銷售成長的同時依然保持較低水準。
區域分析
預計到2025年,亞太地區將佔全球銷售額的46.28%,主要得益於中國、日本和韓國垂直整合的供應鏈。成熟的陶瓷粉末燒結技術、自動化MLCC燒結製程以及接近性電子產品OEM叢集的優勢,正在推動規模經濟效益的實現,並幫助該地區在基礎生產領域保持強勁勢頭。儘管人事費用高昂,日本供應商仍利用小型化專利來確保更高的平均售價;而韓國的生產線則專注於生產符合AEC-Q200熱衝擊標準的汽車級產品。
預計到2031年,北美地區的複合年成長率將達到7.29%,在主要地區中成長最高。 《晶片與科學法案》下的聯邦激勵措施,以及對晶圓製造廠的投資,正推動被動元件回歸國內市場。此外,新建電動車組裝廠也正利用在地採購來獲得清潔能源汽車稅額扣抵。資料中心營運商的需求也在不斷成長,人工智慧加速器將基板級電容預算提高了約25%。預計未來幾年,對高可靠性陶瓷和聚合物鋁元件的需求將繼續保持上升趨勢。
在歐洲,工業自動化領域的需求穩定,但監管方面的阻力正在改變材料的選擇方式,兩者之間存在著一種平衡。 PFAS的逐步淘汰迫使聚丙烯和Polyethylene Naphthalate薄膜迅速取代PFAS,而電池法規2023/1542引入了生產者延伸責任(EPR)規則,該規則有利於能夠證明閉合迴路回收利用的供應商。
在南美、中東和非洲等新興市場,由於可再生能源競標和通訊網路的擴張,電容器需求偶爾會回升,但由於基礎設施不足,絕對需求量仍然小規模。總體而言,區域分散化有助於減輕單一區域的衝擊,並支持電容器市場的長期發展。
其他好處:
- Excel格式的市場預測(ME)表
- 3個月的分析師支持
目錄
第1章:引言
- 研究假設和市場定義
- 調查範圍
第2章:調查方法
第3章執行摘要
第4章 市場狀況
- 市場概覽
- 市場促進因素
- 電動車中電力電子技術的應用日益廣泛
- 5G/FTTx 的快速部署正在推動對高頻 MLCC 的需求。
- 電網級電池儲能部署
- 汽車區域電子電氣架構
- 需要超低ESR電容器的能源採集物聯網節點
- 市場限制因素
- 陶瓷用高容量MLCC供應鏈的變異性
- 固體超級電容器技術知識的差距
- 逐步淘汰聚四氟乙烯薄膜電容器中的全氟烷基和多氟烷基物質的壓力
- 鉭礦石原料成本上漲
- 宏觀經濟因素的影響
- 產業供應鏈分析
- 監理情勢
- 技術展望
- 波特五力分析
- 投資分析
第5章 市場規模與成長預測
- 按類型
- 陶瓷電容器
- 鉭電容器
- 電解電容器
- 薄膜電容器(紙質和塑膠)
- 超級/超強電容器
- 按電壓範圍
- 低電壓(100伏特或以下)
- 中壓(100伏至1千伏)
- 高壓(1千伏或更高)
- 透過安裝方法
- 表面黏著技術
- 通孔
- 按最終用戶行業分類
- 車
- 產業
- 能源與電力
- 通訊/伺服器/數據存儲
- 家用電子產品
- 航太/國防
- 醫療器材
- 按地區
- 北美洲
- 美國
- 加拿大
- 墨西哥
- 南美洲
- 巴西
- 阿根廷
- 其他南美國家
- 歐洲
- 德國
- 英國
- 法國
- 俄羅斯
- 其他歐洲國家
- 亞太地區
- 中國
- 日本
- 印度
- 韓國
- 東南亞
- 其他亞太國家
- 中東和非洲
- 中東
- 沙烏地阿拉伯
- 阿拉伯聯合大公國
- 其他中東國家
- 非洲
- 南非
- 埃及
- 其他非洲國家
- 中東
- 北美洲
第6章 競爭情勢
- 市場集中度
- 策略趨勢
- 市佔率分析
- 公司簡介
- Murata Manufacturing Co., Ltd.
- TDK Corporation
- KYOCERA AVX Components Corporation
- KEMET(Yageo Group)
- Vishay Intertechnology, Inc.
- Panasonic Holdings Corporation
- Samsung Electro-Mechanics Co., Ltd.
- Taiyo Yuden Co., Ltd.
- Walsin Technology Corporation
- Nippon Chemi-Con Corporation
- Rubycon Corporation
- Nichicon Corporation
- Cornell Dubilier Electronics, Inc.
- EPCOS AG(Infineon Technologies)
- Eaton Corporation plc(xEV capacitors)
- Maxwell Technologies, Inc.(UCAP)
- Skeleton Technologies Group OU
- LS Materials Co., Ltd.
- WIMA GmbH & Co KG
- Wurth Elektronik eiSos GmbH & Co KG
- Illinois Capacitor(Cornell Dubilier)
- Cap-XX Limited
- Lelon Electronics Corporation
- Samwha Electric Co., Ltd.
- Faratronic Co., Ltd.
- Elna Co., Ltd.
第7章 市場機會與未來展望
According to Mordor Intelligence, the capacitor market size was valued at USD 26.7 billion in 2025 and estimated to grow from USD 28.26 billion in 2026 to reach USD 37.49 billion by 2031, at a CAGR of 5.82% during the forecast period (2026-2031).
This report is Segmented by Type (Ceramic, Tantalum, and More), Voltage Range (Low <=100 V, Medium 100 V-1 KV, High - Above 1 KV), Mounting Style (Surface-Mount, and Through-Hole), End-User Industry (Automotive, Industrial, Energy and Power, Consumer Electronics, and More), and Geography (North America, South America, Europe, Asia-Pacific, and More). The Market Forecasts are Provided in Terms of Value (USD).
Global Capacitor Market Trends and Insights
Growing Adoption of EV Power-Electronics
Electric-vehicle output rose to 17.3 million units in 2024, a 25% year-on-year surge that translates directly into higher demand for high-voltage film capacitors in traction inverters. Each battery-electric car now integrates more than 15,000 MLCCs, quadrupling the baseline content found in traditional combustion models, while premium 800 V drivetrains require devices with enhanced voltage ratings and thermal stability. Capacitor suppliers able to pass AEC-Q200 qualifications enjoy multi-year design wins that shield them from consumer-electronics volatility. TDK's 100 V, 10 µF MLCC in the 3225 case size exemplifies how product roadmaps stretch performance envelopes without enlarging footprint. The result is a structural uplift in average selling price per vehicle, reinforcing the positive flywheel between electrification and the capacitor market.
Rapid 5G/FTTx Roll-Outs Driving High-Frequency MLCC Demand
More than 300 network operators will activate commercial 5G service by late 2024, and analysts forecast that 75% of global mobile data will traverse 5G infrastructure by 2029.Massive-MIMO antenna arrays require capacitors with ultra-low dielectric loss at frequencies above 6 GHz, a specification that legacy ceramic formulations struggle to meet. Samsung Electro-Mechanics, therefore, targets KRW 1 trillion in automotive MLCC revenue, leveraging know-how originally developed for telecommunication base stations to serve connected-vehicle platforms. Murata's 006003-inch MLCC, 75% smaller than its predecessor, embodies the perpetual miniaturization race while safeguarding electrical performance metrics. With each base-station radio board hosting tens of thousands of capacitors, the upward trajectory of 5G deployments ensures that the capacitor market remains tightly coupled to global bandwidth-consumption trends.
Volatility in MLCC Supply Chain for High-Capacitance Ceramics
Barium titanate shortages pushed lead times for automotive-grade MLCCs beyond six months in 2024, underlining geographic concentration risks because China dominates precursor processing. Yield rates for capacitors that meet AEC-Q200 standards remain below 70%, creating allocation battles between automotive and telecom customers whenever supply tightens. Equipment upgrades that enable thinner dielectric layers exacerbate constraints by requiring ultrapure raw materials as layer thickness nears physical limits. Western manufacturers have announced capacity expansions, yet fresh factories need up to two years to qualify, prolonging near-term supply imbalances.
Other drivers and restraints analyzed in the detailed report include:
- Grid-Scale Battery Storage Deployment
- Automotive Zonal E/E Architectures
- Technical Know-How Gap for Solid-State Ultracapacitors
For complete list of drivers and restraints, kindly check the Table Of Contents.
Segment Analysis
Ceramic capacitors captured 41.92% of the capacitor market share in 2025 by balancing volumetric efficiency with rugged temperature tolerance, maintaining revenue leadership even as alternative dielectrics gain niche footholds. The segment's momentum stems from relentless layer-count increases and finer-grain control, as demonstrated by Murata's release of a 006003-inch MLCC that maintains capacitance despite a 75% footprint reduction. Future growth hinges on incorporating nickel-barrier terminations that reduce silver-palladium cost exposure while preventing migration at high temperatures.
Super-/ultracapacitors register a 7.38% CAGR, the fastest across all types, propelled by hybrid bus lines that pair high-voltage lithium packs with carbon-based power buffers. Tantalum parts sustain relevance in medical implants and avionics modules where volumetric efficiency offsets cost premiums, though ore sourcing adds price volatility. Aluminum electrolytics retain high-voltage power-supply sockets where surge current capability trumps endurance concerns. Film capacitors experience bifurcated demand: polypropylene films grow in renewable-energy converters, whereas PTFE-based variants face PFAS-related phase-down mandates.
Low-voltage devices (<=100 V) delivered 48.74% of 2025 revenue, anchored by smartphones, wearables, and infotainment consoles. Yet the high-voltage class (>1 kV) is projected to accelerate at a 6.33% CAGR as 800 V battery-electric vehicles and series-capacitor banks proliferate; together they are expanding the capacitor market size devoted to power-transmission conditioning. Medium-voltage parts (100 V-1 kV) grow steadily because robotics and factory-automation retrofits migrate to higher DC-bus levels for efficiency gains.
Designers increasingly demand impedance-controlled, high-voltage stacks that combine ceramic and film technologies to tame ringing in wide-band-gap semiconductor switches. Suppliers responding with hybrid modules capture premium pricing, demonstrating that value accrues to solutions able to handle both high ripple current and partial-discharge endurance. The resulting product differentiation keeps price erosion modest even as unit volumes rise.
Complete Report Scope:
- By Type
- Ceramic Capacitors
- Tantalum Capacitors
- Aluminum Electrolytic Capacitors
- Film Capacitors (Paper and Plastic)
- Super-/Ultracapacitors
- By Voltage Range
- Low Voltage (<=100 V)
- Medium Voltage (100 V-1 kV)
- High Voltage (Above 1 kV)
- By Mounting Style
- Surface-Mount
- Through-Hole
- By End-user Industry
- Automotive
- Industrial
- Energy and Power
- Communications / Servers / Data Storage
- Consumer Electronics
- Aerospace and Defense
- Medical Devices
- By Geography
- North America
- United States
- Canada
- Mexico
- South America
- Brazil
- Argentina
- Rest of South America
- Europe
- Germany
- United Kingdom
- France
- Russia
- Rest of Europe
- Asia-Pacific
- China
- Japan
- India
- South Korea
- South-East Asia
- Rest of Asia-Pacific
- Middle East and Africa
- Middle East
- Saudi Arabia
- United Arab Emirates
- Rest of Middle East
- Africa
- South Africa
- Egypt
- Rest of Africa
- Middle East
- North America
Geography Analysis
Asia-Pacific commanded 46.28% of 2025 worldwide revenue thanks to vertically integrated supply chains in China, Japan, and South Korea. Mature ceramic-powder calcination, automated MLCC sintering, and proximity to electronics OEM clusters provide scale economies that reinforce the region's grip on baseline production. Japanese vendors leverage miniaturization patents to secure higher average selling prices despite labor-cost premiums, while South Korean lines specialize in automotive-grade lots that satisfy AEC-Q200 thermal-shock limits.
North America is forecast to record a 7.29% CAGR through 2031, the fastest across major regions. Federal incentives under the CHIPS and Science Act encourage passive-component reshoring adjacent to wafer-fab investments, and new EV assembly plants use localized sourcing to unlock clean-vehicle tax credits. Data-center operators also raise demand as AI accelerators inflate board-level capacitance budgets by about 25%, sustaining a multi-year uplift for high-reliability ceramic and polymer-aluminum devices.
Europe balances steady industrial-automation demand with regulatory headwinds that reshape material choices. PFAS phase-outs compel rapid substitution toward polypropylene and polyethylene naphthalate films, while Battery Regulation 2023/1542 introduces extended-producer-responsibility rules that favor suppliers able to document closed-loop recycling.
Emerging markets in South America and the Middle East & Africa add episodic upside via renewable-energy auctions and telecom network expansions, yet infrastructure gaps keep absolute volumes small. Altogether, geographic diversification mitigates single-region shocks and reinforces long-run expansion for the capacitor market.
- Murata Manufacturing Co., Ltd.
- TDK Corporation
- KYOCERA AVX Components Corporation
- KEMET (Yageo Group)
- Vishay Intertechnology, Inc.
- Panasonic Holdings Corporation
- Samsung Electro-Mechanics Co., Ltd.
- Taiyo Yuden Co., Ltd.
- Walsin Technology Corporation
- Nippon Chemi-Con Corporation
- Rubycon Corporation
- Nichicon Corporation
- Cornell Dubilier Electronics, Inc.
- EPCOS AG (Infineon Technologies)
- Eaton Corporation plc (xEV capacitors)
- Maxwell Technologies, Inc. (UCAP)
- Skeleton Technologies Group OU
- LS Materials Co., Ltd.
- WIMA GmbH & Co KG
- Wurth Elektronik eiSos GmbH & Co KG
- Illinois Capacitor (Cornell Dubilier)
- Cap-XX Limited
- Lelon Electronics Corporation
- Samwha Electric Co., Ltd.
- Faratronic Co., Ltd.
- Elna Co., Ltd.
Additional Benefits:
- The market estimate (ME) sheet in Excel format
- 3 months of analyst support
TABLE OF CONTENTS
1 INTRODUCTION
- 1.1 Study Assumptions and Market Definition
- 1.2 Scope of the Study
2 RESEARCH METHODOLOGY
3 EXECUTIVE SUMMARY
4 MARKET LANDSCAPE
- 4.1 Market Overview
- 4.2 Market Drivers
- 4.2.1 Growing adoption of EV power-electronics
- 4.2.2 Rapid 5G/FTTx roll-outs driving high-frequency MLCC demand
- 4.2.3 Grid-scale battery storage deployment
- 4.2.4 Automotive zonal E/E architectures
- 4.2.5 Energy harvesting IoT nodes needing ultra-low-ESR caps
- 4.3 Market Restraints
- 4.3.1 Volatility in MLCC supply chain for high-capacitance ceramics
- 4.3.2 Technical know-how gap for solid-state ultracapacitors
- 4.3.3 PFAS phase-out pressure on PTFE film capacitors
- 4.3.4 Rising raw-material cost of tantalum ore
- 4.4 Impact of Macroeconomic Factors
- 4.5 Industry Supply Chain Analysis
- 4.6 Regulatory Landscape
- 4.7 Technological Outlook
- 4.8 Porter's Five Forces Analysis
- 4.8.1 Bargaining Power of Buyers
- 4.8.2 Bargaining Power of Suppliers
- 4.8.3 Threat of New Entrants
- 4.8.4 Threat of Substitute Products
- 4.8.5 Intensity of Competitive Rivalry
- 4.9 Investment Analysis
5 MARKET SIZE AND GROWTH FORECASTS (VALUE)
- 5.1 By Type
- 5.1.1 Ceramic Capacitors
- 5.1.2 Tantalum Capacitors
- 5.1.3 Aluminum Electrolytic Capacitors
- 5.1.4 Film Capacitors (Paper and Plastic)
- 5.1.5 Super-/Ultracapacitors
- 5.2 By Voltage Range
- 5.2.1 Low Voltage (<=100 V)
- 5.2.2 Medium Voltage (100 V-1 kV)
- 5.2.3 High Voltage (Above 1 kV)
- 5.3 By Mounting Style
- 5.3.1 Surface-Mount
- 5.3.2 Through-Hole
- 5.4 By End-user Industry
- 5.4.1 Automotive
- 5.4.2 Industrial
- 5.4.3 Energy and Power
- 5.4.4 Communications / Servers / Data Storage
- 5.4.5 Consumer Electronics
- 5.4.6 Aerospace and Defense
- 5.4.7 Medical Devices
- 5.5 By Geography
- 5.5.1 North America
- 5.5.1.1 United States
- 5.5.1.2 Canada
- 5.5.1.3 Mexico
- 5.5.2 South America
- 5.5.2.1 Brazil
- 5.5.2.2 Argentina
- 5.5.2.3 Rest of South America
- 5.5.3 Europe
- 5.5.3.1 Germany
- 5.5.3.2 United Kingdom
- 5.5.3.3 France
- 5.5.3.4 Russia
- 5.5.3.5 Rest of Europe
- 5.5.4 Asia-Pacific
- 5.5.4.1 China
- 5.5.4.2 Japan
- 5.5.4.3 India
- 5.5.4.4 South Korea
- 5.5.4.5 South-East Asia
- 5.5.4.6 Rest of Asia-Pacific
- 5.5.5 Middle East and Africa
- 5.5.5.1 Middle East
- 5.5.5.1.1 Saudi Arabia
- 5.5.5.1.2 United Arab Emirates
- 5.5.5.1.3 Rest of Middle East
- 5.5.5.2 Africa
- 5.5.5.2.1 South Africa
- 5.5.5.2.2 Egypt
- 5.5.5.2.3 Rest of Africa
- 5.5.5.1 Middle East
- 5.5.1 North America
6 COMPETITIVE LANDSCAPE
- 6.1 Market Concentration
- 6.2 Strategic Moves
- 6.3 Market Share Analysis
- 6.4 Company Profiles (includes Global level Overview, Market level overview, Core Segments, Financials as available, Strategic Information, Market Rank/Share for key companies, Products & Services, and Recent Developments)
- 6.4.1 Murata Manufacturing Co., Ltd.
- 6.4.2 TDK Corporation
- 6.4.3 KYOCERA AVX Components Corporation
- 6.4.4 KEMET (Yageo Group)
- 6.4.5 Vishay Intertechnology, Inc.
- 6.4.6 Panasonic Holdings Corporation
- 6.4.7 Samsung Electro-Mechanics Co., Ltd.
- 6.4.8 Taiyo Yuden Co., Ltd.
- 6.4.9 Walsin Technology Corporation
- 6.4.10 Nippon Chemi-Con Corporation
- 6.4.11 Rubycon Corporation
- 6.4.12 Nichicon Corporation
- 6.4.13 Cornell Dubilier Electronics, Inc.
- 6.4.14 EPCOS AG (Infineon Technologies)
- 6.4.15 Eaton Corporation plc (xEV capacitors)
- 6.4.16 Maxwell Technologies, Inc. (UCAP)
- 6.4.17 Skeleton Technologies Group OU
- 6.4.18 LS Materials Co., Ltd.
- 6.4.19 WIMA GmbH & Co KG
- 6.4.20 Wurth Elektronik eiSos GmbH & Co KG
- 6.4.21 Illinois Capacitor (Cornell Dubilier)
- 6.4.22 Cap-XX Limited
- 6.4.23 Lelon Electronics Corporation
- 6.4.24 Samwha Electric Co., Ltd.
- 6.4.25 Faratronic Co., Ltd.
- 6.4.26 Elna Co., Ltd.
7 MARKET OPPORTUNITIES AND FUTURE OUTLOOK
- 7.1 White-space and Unmet-need Assessment

 2034年電力電容器市場預測-全球分析(依電容器類型、介質材料、電壓範圍、終端用戶產業、應用、銷售管道和地區分類)電容器市場預測至2034年-全球分析(以電容器類型、額定電壓、電容、安裝方式、應用、終端用戶產業、銷售管道和地區分類)
 電容器市場報告:趨勢、預測和競爭分析(至2035年)
 插入式電解電容器市場規模、佔有率和成長分析:按電壓範圍、電容範圍、終端用戶產業、溫度等級、安裝方式和地區分類-2026-2033年產業預測
 三相電力電容器市場-全球產業規模、佔有率、趨勢、機會、預測:依產品類型、終端用戶產業、電壓等級、區域和競爭格局分類,2021-2031年單相電力電容器市場-全球產業規模、佔有率、趨勢、機會、預測:依產品類型、應用、電壓、地區和競爭格局分類,2021-2031年晶片陶瓷微調電容器市場報告:趨勢、預測和競爭分析(至2035年)
 2026年全球金屬絕緣半導體(MIS)電容器市場報告發燒級電容器市場報告:趨勢、預測及競爭分析(至2035年)
 分立電容器市場報告:按類型、應用和地區分類 2026-2034 年