


 |
市場調查報告書
商品編碼
2122652
電動車電源逆變器:市場佔有率分析、產業趨勢與統計及成長預測(2026-2031)Electric Vehicle Power Inverter - Market Share Analysis, Industry Trends & Statistics, Growth Forecasts (2026 - 2031) |
||||||

※ 本網頁內容可能與最新版本有所差異。詳細情況請與我們聯繫。
根據 Mordor Intelligence 預測,電動車電源逆變器的市場規模預計將從 2025 年的 89.7 億美元和 2026 年的 106.7 億美元成長到 2031 年的 254.1 億美元,2026 年至 2031 年的年複合成長率(CAGR)為 18.95%。
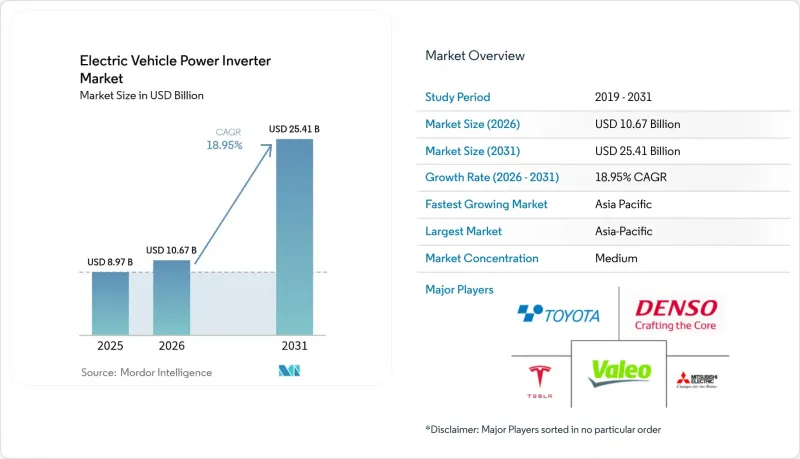
本報告按動力類型(混合動力汽車、插電式混合動力汽車、純電動車、燃料電池電動車)、車輛類型(乘用車、輕型商用車等)、電壓架構(400V以下和400V以上)、半導體材料(矽IGBT等)、整合式(獨立式、電驅動橋、CIDD)和地區進行細分。市場預測以美元計價。
全球電動車電源逆變器市場趨勢與洞察
SiC 和 GaN 功率半導體技術的快速發展
與矽IGBT的150 度C結溫相比,碳化矽(SiC)MOSFET和氮化鎵(GaN)HEMT的結溫可承受高達175 度C,從而減少散熱器質量並提高功率密度。 Wolfspeed投資65億美元擴建莫霍克谷工廠產能,英飛凌投資50億歐元(約65億美元)擴大德勒斯登工廠,顯示晶圓供應正在擴大,以滿足汽車生產規模的需求。雖然氮化鎵仍主要應用於汽車充電器,但SiC無疑是逆變器主流發展藍圖的核心,尤其是在800V以上的平台上,其開關損耗的降低幅度可達兩倍。傳統IGBT仍保持著一定的市場佔有率,因為其成本結構適合對價格敏感的400V級汽車,但隨著車型年份的增加,效率差距正在擴大,加速了向寬能隙的轉變。雖然基於 ISO 26262 的功能安全檢驗在初期階段增加了測試負擔,但領先公司收集的長期可靠性數據降低了後進企業的准入門檻。
整車廠商向800V汽車平臺過渡
汽車製造商正在採用800V或更高電壓的系統,以將直流快速充電時間縮短一半,並將銅線束的重量減少近三分之一。保時捷Taycan和現代Ionic 5等早期車型已展示了這一概念,而寶馬的Neue Klasse平台計劃於2027年將高壓電池組引入高階量產車型領域。逆變器設計必須能夠承受更高的阻斷電壓和更快的dv/dt變化率。此規格範圍對擁有先進封裝隔離技術和低電感佈局的供應商有利。公共充電樁的轉型速度較慢,因為需要雙電壓相容性,而目前大多數安裝地點的電壓為400V,且逆變器控制迴路複雜。儘管如此,其性能優勢已引起買家的共鳴,原始設備製造商(OEM)正努力在量產開始前敲定800V的供貨合約。
SiC裝置高成本且供應不穩定
碳化矽 (SiC) 晶圓的成本是矽晶圓的數倍,且產能集中在五家晶圓代工廠,這意味著當需求激增時,整車製造商 (OEM) 會面臨現貨價格波動的風險。汽車零件的認證流程需要 18 至 24 個月,因此,在新的工廠運作緩解供不應求之前,存在相當長的延遲時間。一些汽車製造商透過同時採購碳化矽和傳統 IGBT 零件來對沖風險,以犧牲效率為代價來確保供應穩定。此外,出口限制的不確定性,加上坩堝和晶體生長設備的供應商有限,也增加了風險因素。作為權宜之計,一些一級供應商持有策略性庫存,但倉儲成本正在擠壓利潤空間。
細分市場分析
預計到2025年,電池式電動車(BEV)將在電動車電源逆變器市場維持54.12%的市場佔有率,這主要得益於中國和歐洲高密度充電網路的建設。相較之下,插電式混合動力汽車(PHEV)在電網發展落後的地區扮演著過渡角色。燃料電池電動車(FCEV)預計將呈現最高的成長率,到2031年將以19.35%的複合年成長率成長,這主要得益於日本、韓國和歐洲部分地區氫能走廊的建設降低了加氫基礎設施的風險。不具備外部充電功能的混合動力汽車正在穩步下降,因為法規現在更重視「零排放」而非部分電氣化。
由於燃料電池堆的直流輸出電壓低於鋰離子電池組,其逆變器結合了降壓直流-直流轉換器和低電感匯流排,以控制駕駛員請求扭矩時產生的瞬時電流浪湧。這使得燃料電池堆能夠持續供電,且不受電池溫度限制,因此適用於電池重量超過貨物負載容量的長途客車和卡車。推動燃料電池發展的關鍵因素是綠色氫氣的成本趨勢和加氫站密度,而這兩項因素都因可再生能源過剩背景下電解槽的廣泛應用而得到改善。
預計到2025年,乘用車將佔電動車電源逆變器市場63.91%的佔有率,這反映了主要汽車市場消費者對電動車的接受度。同時,由於零排放區的引入,柴油車正逐步退出都市區,重型商用車和巴士的複合年成長率最高,達到19.42%。輕型商用車也能受惠於車庫充電,但由於其對價格較為敏感,在電池成本曲線趨於平緩之前,其普及速度將落後於乘用車。
用於40噸卡車的逆變器必須能夠承受超過300千瓦的持續功率輸出,並能承受遠超乘用車的振動循環。因此,該設計強調採用加強型匯流排、冗餘電流感測器,並支援符合CharIN規範的兆瓦級充電。乘用車逆變器優先考慮靜音運行和緊湊的機殼,而城市公車逆變器則優先考慮可維護性和散熱裕度,以換取更大的外殼空間。
區域分析
預計到2025年,亞太地區將佔據電動車電源逆變器市場39.19%的佔有率,並將以19.36%的複合年成長率持續成長至2031年。中國憑藉其垂直整合的供應鏈主導著該地區的電動車電源逆變器市場,該供應鏈涵蓋了從碳化矽晶圓製造到最終車輛組裝的所有環節,均由同一家公司統一運營。日本憑藉其數十年的電力電子技術經驗,電裝和三菱電機在國內OEM生態系統中佔據重要的供應商地位。韓國現代摩比斯與LG能源解決方案公司合作,部署了一套800V系統,該系統擁有目前市售產品中最高的充電速度。
儘管歐洲在絕對產量上落後於其他地區,但其受益於嚴格的碳排放法規,這些法規提供了清晰的需求預測。德國、法國和斯堪地那維亞的汽車製造商正在實現逆變器本地化採購,以滿足國內含量要求並降低長供應鏈帶來的風險。德勒斯登和卡塔尼亞的半導體製造廠正在獲得公共資金,以確保即使在2035年後禁止銷售內燃機汽車的禁令生效後,碳化矽的供應仍能保持在單一市場內。
北美地區的成長得益於《通膨控制法案》,該法案將7,500美元的消費者稅額扣抵與最終組裝和礦產來源等規定掛鉤,而這一趨勢也波及到了逆變器採購領域。儘管Wolfspeed位於北卡羅來納州的大型工廠以及中西部地區新興的一級電驅動橋工廠正在將關鍵製程轉移到國內,但充電基礎設施的部署卻落後於沿海地區。因此,為了因應兩極化的市場局面,該地區的供應商正優先考慮模組化設計,以同時支援傳統的400V車輛和下一代800V車輛。
其他好處:
- Excel格式的市場預測(ME)表
- 3個月的分析師支持
目錄
第1章:引言
- 研究假設和市場定義
- 調查範圍
第2章:調查方法
第3章執行摘要
第4章 市場狀況
- 市場概覽
- 市場促進因素
- SiC 和 GaN 功率半導體技術的快速發展
- 整車廠商向800V汽車平臺過渡
- 電動車需求不斷成長
- 政府獎勵和排放法規
- 雙向V2G相容逆變器架構
- 利用一級技術實現規模經濟,降低成本
- 市場限制因素
- SiC裝置高成本且供應不穩定
- 當功率超過 300 千瓦時,溫度控管將變得非常複雜。
- 充電基礎設施瓶頸
- V2G相容逆變器的網路安全風險
- 價值供應鏈分析
- 監理情勢
- 技術展望
- 波特五力模型
第5章 市場規模與成長預測
- 依推進類型
- 混合動力電動車(HEV)
- 插電式混合動力車(PHEV)
- 電池式電動車(BEV)
- 燃料電池電動車(FCEV)
- 車輛類型
- 搭乘用車
- 輕型商用車
- 大型商用車輛和巴士
- 電壓架構
- 低於 400 伏特的系統
- 401-799伏特系統
- 電壓為 800 伏特或以上的系統
- 透過半導體材料
- 矽IGBT
- 碳化矽 MOSFET
- 氮化鎵(GaN)高電子遷移率電晶體(HEMT)
- 依整合程度
- 獨立式逆變器
- 整合式電力驅動橋(馬達+逆變器+變速箱)
- 逆變器 + DC/DC 整合 (CIDD)
- 按地區
- 北美洲
- 美國
- 加拿大
- 其他北美國家
- 南美洲
- 巴西
- 阿根廷
- 其他南美國家
- 歐洲
- 德國
- 英國
- 法國
- 義大利
- 西班牙
- 俄羅斯
- 其他歐洲國家
- 亞太地區
- 中國
- 日本
- 印度
- 韓國
- 其他亞太國家
- 中東和非洲
- 沙烏地阿拉伯
- 阿拉伯聯合大公國
- 土耳其
- 南非
- 埃及
- 奈及利亞
- 其他中東和非洲國家
- 北美洲
第6章 競爭情勢
- 市場集中度
- 策略趨勢
- 市佔率分析
- 公司簡介
- Robert Bosch GmbH
- DENSO Corporation
- Toyota Industries Corporation
- Hitachi Astemo Ltd
- Meidensha Corporation
- BorgWarner Inc.
- Mitsubishi Electric Corp.
- Tesla Inc.
- Marelli Holdings
- Valeo SA
- Lear Corporation
- Infineon Technologies AG
- Eaton Corporation
- STMicroelectronics NV
- ON Semiconductor Corp.
- Wolfspeed Inc.
- ROHM Semiconductor
- Continental AG
- ZF Friedrichshafen AG
- Dana Incorporated
第7章 市場機會與未來展望
According to Mordor Intelligence, the electric vehicle power inverter market size is projected to expand from USD 8.97 billion in 2025 and USD 10.67 billion in 2026 to USD 25.41 billion by 2031, registering an 18.95% CAGR between 2026 and 2031.
This report is Segmented by Propulsion Type (HEV, PHEV, BEV, and FCEV), Vehicle Type (Passenger Cars, Light Commercial Vehicles, and More), Voltage Architecture (Less Than or Equal To 400V and More), Semiconductor Material (Silicon IGBT and More), Integration Level (Stand-Alone, E-Axle, and CIDD), and Geography. Market Forecasts are Provided in Terms of Value (USD).
Global Electric Vehicle Power Inverter Market Trends and Insights
Rapid Advances in SiC & GaN Power Semiconductors
Silicon-carbide MOSFETs and gallium-nitride HEMTs allow junction temperatures up to 175 °C, compared with 150 °C for silicon IGBTs, which reduces heat-sink mass and increases power density . Wolfspeed's USD 6.5 billion Mohawk Valley capacity build, and Infineon's EUR 5 billion (~USD 6.5 billion) Dresden expansion illustrate how wafer supply is scaling to automotive volumes. Gallium-nitride still skews toward onboard chargers, yet the mainstream inverter roadmap is firmly SiC, especially for >=800-V platforms where switching-loss savings are multiplied. Legacy IGBTs hold share because their cost profile suits price-sensitive 400-V cars, but the efficiency delta widens each model year, accelerating the migration to wide-bandgap. Functional-safety validation under ISO 26262 adds up-front testing, but the long-term reliability data collected by early movers lowers the barrier for fast followers.
OEM Transition to 800-V Vehicle Platforms
Automakers adopt >=800-V systems to halve DC-fast-charge times and trim copper harness mass by nearly one-third. Early showcases such as the Porsche Taycan and Hyundai Ioniq 5 proved the concept, and BMW's Neue Klasse platform will bring high-voltage stacks into the premium-volume segment in 2027. Inverter designs must now withstand higher blocking voltages and faster dv/dt, a specification window that plays to suppliers with advanced package insulation and low-inductance layouts. Public chargers lag because most existing sites are 400 V, forcing dual-voltage compatibility that complicates inverter control loops. Even so, the performance narrative resonates with buyers, prompting OEMs to lock in 800-V supply contracts well before mass production kicks off.
High SiC Device Cost & Supply Volatility
Silicon-carbide wafers cost multiples of silicon, and capacity is concentrated among five foundries, leaving OEMs exposed to spot-price swings when demand spikes. Automotive qualification runs 18-24 months, so new fabs only ease shortages with a significant lag. Some automakers hedge by dual-sourcing SiC and legacy IGBT parts, trading efficiency for supply security. Export-control uncertainty adds further risk because crucible and crystal-growth tools come from a narrow supplier base. As a stopgap, several tier-1s hold strategic inventory, but carrying costs erode margin.
Other drivers and restraints analyzed in the detailed report include:
- Rising Demand for Electric Vehicles
- Government Incentives & Emission Mandates
- Thermal-Management Complexity >=300 kW
For complete list of drivers and restraints, kindly check the Table Of Contents.
Segment Analysis
Battery-electric cars retain 54.12% of the electric-vehicle power inverter market share in 2025, driven by dense charging networks in China and Europe. In contrast, plug-in hybrids serve as transitional solutions in regions where grid upgrades lag. Fuel-cell electric vehicles are projected to post the fastest 19.35% CAGR through 2031, as hydrogen corridors in Japan, South Korea, and parts of Europe reduce the risk of refueling infrastructure. Hybrid electrics without external charging contracts steadily because regulatory rules now credit zero tailpipe emissions rather than partial electrification.
Fuel-cell stacks output lower DC voltages than lithium-ion packs, so their inverters pair with step-down DC-DC converters and low-inductance busbars that manage rapid current rise when drivers demand torque. Continuous power delivery without battery-temperature limits favors long-haul buses and trucks where battery mass would otherwise exceed freight payload. Growth hinges on green-hydrogen cost trajectories and station density, both of which are trending positively as electrolyzer deployments piggyback on renewable overcapacity.
Passenger cars commanded 63.91% of the electric vehicle power inverter market size in 2025, reflecting consumer uptake in the core auto markets, while heavy commercial vehicles and buses posted the strongest 19.42% CAGR as zero-emission zones lock diesel fleets out of cities. Light commercial vans also benefit from depot charging but are more price-sensitive, so adoption lags passenger cars until battery cost curves flatten.
Inverters for 40-ton trucks must handle continuous ratings above 300 kW and withstand vibration cycles far beyond those of passenger cars. Designs therefore emphasize reinforced busbars, redundant current sensors, and megawatt charging compatibility per CharIN's specification. Passenger-car units focus on acoustic comfort and compact housings, while city-bus variants allow more envelope space in exchange for serviceability and thermal headroom.
Complete Report Scope:
- By Propulsion Type
- Hybrid Electric Vehicle (HEV)
- Plug-in Hybrid Electric Vehicle (PHEV)
- Battery Electric Vehicle (BEV)
- Fuel Cell Electric Vehicle (FCEV)
- By Vehicle Type
- Passenger Cars
- Light Commercial Vehicles
- Heavy Commercial Vehicles & Buses
- By Voltage Architecture
- Less than or equal to 400 V Systems
- 401-799 V Systems
- More than or equal to 800 V Systems
- By Semiconductor Material
- Silicon IGBT
- Silicon-Carbide MOSFET
- Gallium-Nitride HEMT
- By Integration Level
- Stand-alone Inverter
- Integrated e-Axle (Motor + Inverter + Gearbox)
- Combined Inverter + DC/DC (CIDD)
- By Geography
- North America
- United States
- Canada
- Rest of North America
- South America
- Brazil
- Argentina
- Rest of South America
- Europe
- Germany
- United Kingdom
- France
- Italy
- Spain
- Russia
- Rest of Europe
- Asia Pacific
- China
- Japan
- India
- South Korea
- Rest of Asia Pacific
- Middle East and Africa
- Saudi Arabia
- United Arab Emirates
- Turkey
- South Africa
- Egypt
- Nigeria
- Rest of Middle East and Africa
- North America
Geography Analysis
Asia Pacific held a 39.19% of the electric-vehicle power inverter market share in 2025 and is forecasted to expand at a 19.36% CAGR through 2031. China dominates the regional electric-vehicle power-inverter market owing to vertically integrated supply chains that span from SiC wafer growth to final vehicle assembly under one corporate umbrella. Japan leverages decades of power-electronics know-how, with Denso and Mitsubishi Electric holding preferred-supplier status within local OEM ecosystems. South Korea's Hyundai Mobis partners with LG Energy Solution to roll out 800-V systems that rank among the highest-charging-speed models on sale.
Europe trails in absolute volume but benefits from tight carbon legislation that provides visibility into demand. German, French, and Scandinavian automakers localize inverter sourcing to meet domestic-content thresholds and de-risk long supply lines. Semiconductor fabs in Dresden and Catania receive public funding packages to ensure that SiC volumes remain within the single market once combustion bans take effect after 2035.
North America's growth rests on the Inflation Reduction Act, which ties a USD 7,500 consumer credit to final-assembly and mineral-origin rules that ripple through inverter sourcing. Wolfspeed's North Carolina mega-fab and emerging tier-1 e-Axle plants in the Midwest bring critical stages stateside, but the rollout of charging infrastructure lags coastal adoption. The region's suppliers, therefore, prioritize modular designs that support both 400-V legacy and 800-V next-gen vehicles to address a bifurcated market landscape.
- Robert Bosch GmbH
- DENSO Corporation
- Toyota Industries Corporation
- Hitachi Astemo Ltd
- Meidensha Corporation
- BorgWarner Inc.
- Mitsubishi Electric Corp.
- Tesla Inc.
- Marelli Holdings
- Valeo SA
- Lear Corporation
- Infineon Technologies AG
- Eaton Corporation
- STMicroelectronics N.V.
- ON Semiconductor Corp.
- Wolfspeed Inc.
- ROHM Semiconductor
- Continental AG
- ZF Friedrichshafen AG
- Dana Incorporated
Additional Benefits:
- The market estimate (ME) sheet in Excel format
- 3 months of analyst support
TABLE OF CONTENTS
1 Introduction
- 1.1 Study Assumptions & Market Definition
- 1.2 Scope of the Study
2 Research Methodology
3 Executive Summary
4 Market Landscape
- 4.1 Market Overview
- 4.2 Market Drivers
- 4.2.1 Rapid Advances in SiC & GaN Power Semiconductors
- 4.2.2 OEM Transition to 800V Vehicle Platforms
- 4.2.3 Rising Demand for Electric Vehicles
- 4.2.4 Government Incentives & Emission Mandates
- 4.2.5 Bidirectional V2G-Ready Inverter Architectures
- 4.2.6 Tier-1 Scale-Driven Cost Reductions
- 4.3 Market Restraints
- 4.3.1 High SiC Device Cost & Supply Volatility
- 4.3.2 Thermal-Management Complexity at More than 300 kW
- 4.3.3 Charging-Infrastructure Bottlenecks
- 4.3.4 Cyber-Security Risk in V2G-Enabled Inverters
- 4.4 Value / Supply-Chain Analysis
- 4.5 Regulatory Landscape
- 4.6 Technological Outlook
- 4.7 Porter's Five Forces
- 4.7.1 Bargaining Power of Suppliers
- 4.7.2 Bargaining Power of Buyers
- 4.7.3 Threat of New Entrants
- 4.7.4 Threat of Substitutes
- 4.7.5 Intensity of Rivalry
5 Market Size & Growth Forecasts (Value (USD))
- 5.1 By Propulsion Type
- 5.1.1 Hybrid Electric Vehicle (HEV)
- 5.1.2 Plug-in Hybrid Electric Vehicle (PHEV)
- 5.1.3 Battery Electric Vehicle (BEV)
- 5.1.4 Fuel Cell Electric Vehicle (FCEV)
- 5.2 By Vehicle Type
- 5.2.1 Passenger Cars
- 5.2.2 Light Commercial Vehicles
- 5.2.3 Heavy Commercial Vehicles & Buses
- 5.3 By Voltage Architecture
- 5.3.1 Less than or equal to 400 V Systems
- 5.3.2 401-799 V Systems
- 5.3.3 More than or equal to 800 V Systems
- 5.4 By Semiconductor Material
- 5.4.1 Silicon IGBT
- 5.4.2 Silicon-Carbide MOSFET
- 5.4.3 Gallium-Nitride HEMT
- 5.5 By Integration Level
- 5.5.1 Stand-alone Inverter
- 5.5.2 Integrated e-Axle (Motor + Inverter + Gearbox)
- 5.5.3 Combined Inverter + DC/DC (CIDD)
- 5.6 By Geography
- 5.6.1 North America
- 5.6.1.1 United States
- 5.6.1.2 Canada
- 5.6.1.3 Rest of North America
- 5.6.2 South America
- 5.6.2.1 Brazil
- 5.6.2.2 Argentina
- 5.6.2.3 Rest of South America
- 5.6.3 Europe
- 5.6.3.1 Germany
- 5.6.3.2 United Kingdom
- 5.6.3.3 France
- 5.6.3.4 Italy
- 5.6.3.5 Spain
- 5.6.3.6 Russia
- 5.6.3.7 Rest of Europe
- 5.6.4 Asia Pacific
- 5.6.4.1 China
- 5.6.4.2 Japan
- 5.6.4.3 India
- 5.6.4.4 South Korea
- 5.6.4.5 Rest of Asia Pacific
- 5.6.5 Middle East and Africa
- 5.6.5.1 Saudi Arabia
- 5.6.5.2 United Arab Emirates
- 5.6.5.3 Turkey
- 5.6.5.4 South Africa
- 5.6.5.5 Egypt
- 5.6.5.6 Nigeria
- 5.6.5.7 Rest of Middle East and Africa
- 5.6.1 North America
6 Competitive Landscape
- 6.1 Market Concentration
- 6.2 Strategic Moves
- 6.3 Market Share Analysis
- 6.4 Company Profiles (Includes Global Level Overview, Market Level Overview, Core Segments, Financials as Available, Strategic Information, Market Rank/Share for Key Companies, Products and Services, SWOT Analysis, and Recent Developments)
- 6.4.1 Robert Bosch GmbH
- 6.4.2 DENSO Corporation
- 6.4.3 Toyota Industries Corporation
- 6.4.4 Hitachi Astemo Ltd
- 6.4.5 Meidensha Corporation
- 6.4.6 BorgWarner Inc.
- 6.4.7 Mitsubishi Electric Corp.
- 6.4.8 Tesla Inc.
- 6.4.9 Marelli Holdings
- 6.4.10 Valeo SA
- 6.4.11 Lear Corporation
- 6.4.12 Infineon Technologies AG
- 6.4.13 Eaton Corporation
- 6.4.14 STMicroelectronics N.V.
- 6.4.15 ON Semiconductor Corp.
- 6.4.16 Wolfspeed Inc.
- 6.4.17 ROHM Semiconductor
- 6.4.18 Continental AG
- 6.4.19 ZF Friedrichshafen AG
- 6.4.20 Dana Incorporated
7 Market Opportunities & Future Outlook
- 7.1 White-space & Unmet-need Assessment

 2026-2034年全球電動車電源逆變器市場規模、佔有率、趨勢與成長分析報告
 電動車電源逆變器市場:按電力電子技術、車輛電氣化類型、車輛等級、驅動系統、功率輸出、銷售管道和應用分類-全球市場預測(2026-2032 年)
 電動車電源逆變器市場:按車輛類型、應用、銷售管道和地區分類電動車電源逆變器市場:策略性洞察與預測(2026-2031年)電動汽車電源逆變器市場規模、佔有率、成長及全球產業分析:按類型、應用和地區的洞察,2026-2034年預測
 2026年全球電動車電源逆變器市場報告
 電動車電源逆變器市場規模、趨勢、分析報告:按推進類型、輸出、車輛類型、地區和細分市場預測,2025 年至 2030 年
 電動車電源逆變器市場,按逆變器類型、按推進類型、按功率輸出、按電壓類型、按車輛類型、按國家/地區分類 - 2025 年至 2032 年全球產業分析、市場規模、市場佔有率及預測
 電動車電源逆變器市場規模、佔有率及成長分析(按推進類型、車輛類型、逆變器類型、整合度和地區)-2025-2032 年產業預測