


 |
市場調查報告書
商品編碼
2122638
狀態監測設備:市場佔有率分析、產業趨勢與統計、成長預測(2026-2031)Condition Monitoring Equipment - Market Share Analysis, Industry Trends & Statistics, Growth Forecasts (2026 - 2031) |
||||||

※ 本網頁內容可能與最新版本有所差異。詳細情況請與我們聯繫。
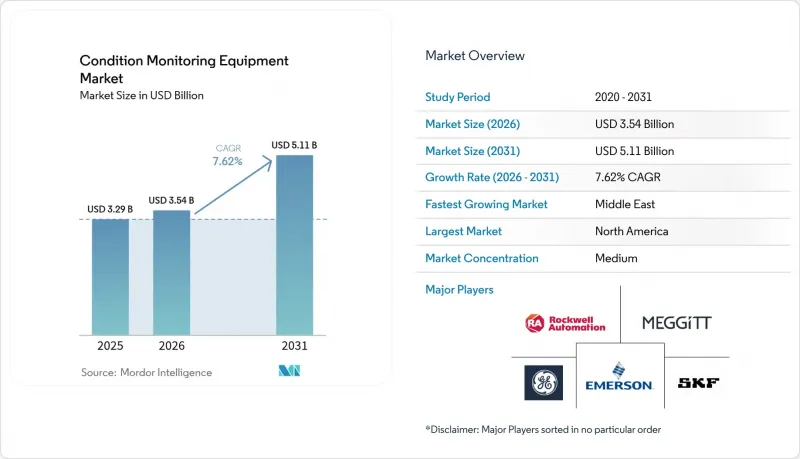
據 Mordor Intelligence 稱,2025 年狀態監測設備的市場規模為 32.9 億美元,預計到 2031 年將從 2026 年的 35.4 億美元成長至 51.1 億美元,預測期(2026-2031 年)的複合年成長率為 7.62%。
本報告按類型(硬體、軟體、服務)、最終用戶產業(石油天然氣、發電、流程製造及其他)、監控方法(可攜式/離線監控、線上/連續監控、遠端/無線監控)、部署模式(本地部署、雲端部署)和地區細分。市場預測以美元計價。
全球狀態監測設備市場趨勢與洞察
智慧工廠的需求日益成長
建構智慧工廠的製造商正在整合資產健康數據和生產指標,以實現全面最佳化。由於狀態監測平台需要與製造執行系統 (MES) 和企業資源計劃 (ERP) 系統整合,供應商正著重強調開放協議和互通架構。邊緣運算能夠即時偵測現場異常,從而降低雲端頻寬成本並縮短回應時間。操作人員正在利用直覺的儀錶板,將振動和熱模式轉化為具體的工作指令。據報道,當這些系統全面實施後,停機時間可減少 15% 至 25%。隨著企業將可靠性結果與整體設備效率 (OEE) 目標掛鉤,對跨多個工廠網路的可擴展解決方案的需求日益成長。因此,對智慧營運的日益重視正在推動狀態監測設備市場的長期成長。
人們越來越關注預測性保護計劃
如今,企業維護策略優先考慮數據驅動的干預措施,而非統一的預防性保養計畫。預測性維護能夠在二次損壞發生之前偵測到故障,從而降低緊急維修成本和生產停機時間,通常可帶來三位數的投資報酬率 (ROI)。機器學習模型整合振動、溫度和潤滑數據,計算出單一資產健康的評分,維護負責人據此制定維護計畫。集中式雲端儀表板使團隊能夠從指揮中心監控分散的工廠,而共用的故障模式資料庫則持續提高診斷準確性。這些經濟效益和高度的營運透明度不斷吸引新的用戶進入狀態監測設備市場。
互聯監控系統中的網路安全問題
針對操作技術(OT) 的高調網路安全事件,使得資產所有者在將機械設備連接到外部網路時格外謹慎。美國國家標準與技術研究院 (NIST) 於 2024 年更新的指南指出,感測器閘道和資料歷史記錄器是潛在的攻擊途徑。許多老舊工廠缺乏分段式架構,因此在維修時需要對防火牆、入侵偵測和身分管理進行大量投資。關鍵基礎設施監管法規要求進行嚴格的合規性審計,這可能會延長專案工期。因此,一些營運商傾向於空氣間隙或本地部署,這阻礙了雲端解決方案在狀態監測設備市場的短期成長。
細分市場分析
到2025年,硬體部分將佔狀態監測設備市場的60.78%。振動探頭、熱像儀和油液滲漏感測器仍然整體旋轉機械、電氣系統和液壓系統的核心診斷工具。供應商不斷提升感測器的頻寬和耐溫性能,以應對嚴苛的運作環境,這加快了硬體的更換週期。服務部分是成長最快的類別,年複合成長率高達8.99%,用戶將數據解讀和維修計畫外包。在基於績效的合約下,供應商利用雲端分析來確保運轉率目標,並將付款與績效而非設備銷售掛鉤。這種模式促進了預測性維護計劃的實施,而無需大量資本投資,從而推動了狀態監控設備市場的整體擴張。
軟體的進步正在彌合硬體和服務之間的鴻溝,將原始波形轉化為可執行的洞察。供應商正在將人工智慧整合到邊緣閘道器中,以進行降噪、壓縮相關事件,並將優先警報推送給維護團隊。儘管隨著買家更傾向於整合式解決方案,獨立軟體的銷售正在放緩,但軟體仍然是關鍵的差異化因素,能夠將通用感測器轉化為高價值解決方案。因此,將硬體、分析和專家審核整合到單一訂閱中的狀態監測即服務 (CMaaS) 正在推動整個狀態監測設備行業的持續收入成長和客戶留存率提升。
石油和天然氣產業是狀態監測設備市場的主要驅動力,預計2025年將佔市場規模的25.21%。在鑽井、煉油和液化等嚴苛環境下,泵浦、渦輪機和壓縮機承受著巨大的磨損,因此振動和熱成像系統在多年運作中都至關重要。受風能、太陽能和火力發電廠延壽計畫的推動,發電業預計到2031年將以8.05%的複合年成長率成長。可再生能源業者計劃對海上設施進行巡檢,並依靠持續監測來防止高峰需求期間出現兆瓦時損失。此外,電力公司正在將資產健康評分納入電網運行模型,以平衡成本和可靠性,從而擴大了應用範圍。
在流程製造和離散製造工廠中,預測性維護計劃正被廣泛實施,以支援精益庫存和準時生產,尤其是在運作至關重要的環境中。航太、國防和交通運輸產業對專業認證和高耐環境性能的設備需求旺盛,為高利潤產品創造了盈利的細分市場。同時,採礦、海洋和民用基礎設施市場也透過應用在石油和天然氣產業中行之有效的調查方法,實現了需求的逐步成長。這種多元化發展正在穩定需求,並為狀態監測設備市場保持良好的發展前景。
區域分析
北美在狀態監測設備市場佔據領先地位,預計2025年將佔據33.21%的市場。在美國,預測性維護正被用於解決技術純熟勞工短缺問題,並延長老舊製程裝置的使用壽命。聯邦安全法規和企業永續性目標進一步要求對資產健康狀況進行監測。在加拿大,類似的技術正應用於油砂作業和偏遠地區的水力發電設施;而在墨西哥,不斷發展的汽車產業走廊需要經濟高效的無線解決方案來維持精益生產的目標。這些因素共同推動了全部區域強勁的更新和升級週期。
中東是成長最快的地區,預計到2031年將以7.88%的複合年成長率成長。各國經濟多元化政策旨在透過大規模項目實現石化聯合企業的現代化,並建造先進製造地。新的智慧城市和交通項目進一步增加了對資產健康狀況持續檢驗的需求。惡劣的環境溫度、沙漠塵埃和腐蝕性大氣環境增加了對專用感測器的需求,而本地服務中心正在湧現,以支援現場診斷數據的解讀。
亞太地區憑藉其龐大的工業基礎緊隨其後。中國正透過工業網際網路計畫推動國內創新,透過將狀態數據與供應鏈平台整合,提升其品質競爭力。在日本,成熟工廠正在進行大規模維修,以保持汽車和電子製造企業的競爭力;而印度的「印度製造」舉措正在加速中小製造商採用相關技術。在全部區域,可再生能源計畫的激增催生了遠端監控的需求,以保護風能和太陽能資產的投資。這些因素共同推動了狀態監測設備市場的發展。
其他好處:
- Excel格式的市場預測(ME)表
- 3個月的分析師支持
目錄
第1章:引言
- 研究假設和市場定義
- 調查範圍
第2章:調查方法
第3章執行摘要
第4章 市場狀況
- 市場促進因素
- 智慧工廠的需求日益成長
- 人們對預測性保護項目越來越感興趣。
- 人們越來越關注可再生能源資產的可靠性。
- 將工業物聯網和雲分析整合到狀態監測中
- 無線感測器節點的微型化
- 向服務型經營模式轉型
- 市場限制因素
- 不可預測的維護計劃
- 熟練可靠性工程師短缺
- 互聯監控系統中的網路安全問題
- 對先進監測設備進行大量資本投資
- 產業價值鏈分析
- 監理情勢
- 技術展望
- 波特五力分析
- 宏觀經濟因素的影響
第5章 市場規模與成長預測
- 按類型
- 硬體
- 振動監測裝置
- 熱成像設備
- 潤滑油分析儀
- 軟體
- 服務
- 硬體
- 按最終用戶行業分類
- 石油和天然氣
- 發電
- 工藝和製造
- 航太/國防
- 汽車和運輸業
- 其他終端用戶產業
- 透過監測方法
- 可攜式/離線監測
- 在線/連續監測
- 遠端/無線監控
- 部署模式
- 現場
- 基於雲端的
- 按地區
- 北美洲
- 美國
- 加拿大
- 墨西哥
- 歐洲
- 德國
- 英國
- 法國
- 俄羅斯
- 其他歐洲國家
- 亞太地區
- 中國
- 日本
- 印度
- 韓國
- 澳洲
- 其他亞太國家
- 中東和非洲
- 中東
- 沙烏地阿拉伯
- 阿拉伯聯合大公國
- 其他中東國家
- 非洲
- 南非
- 埃及
- 其他非洲國家
- 中東
- 南美洲
- 巴西
- 阿根廷
- 其他南美國家
- 北美洲
第6章 競爭情勢
- 市場集中度
- 策略趨勢
- 市佔率分析
- 公司簡介
- Rockwell Automation Inc.
- Emerson Electric Co.
- Meggitt PLC
- General Electric Company
- SKF AB
- Bruel and Kjaer Vibro GmbH
- Teledyne FLIR LLC
- Fluke Corporation
- Nippon Avionics Co., Ltd.
- Thermo Fisher Scientific Inc.
- PerkinElmer Inc.
- Spectro Scientific Inc.(AMETEK Inc.)
- Parker Hannifin Corporation
- Gastops Ltd.
- Siemens AG
- Honeywell International Inc.
- ABB Ltd.
- Baker Hughes Company
- National Instruments Corporation
- Schaeffler AG
- PRUFTECHNIK Dieter Busch AG
- Wilcoxon Sensing Technologies(ITT Inc.)
- Connection Technology Center Inc.
第7章 市場機會與未來展望
According to Mordor Intelligence, the condition monitoring equipment market size was valued at USD 3.29 billion in 2025 and estimated to grow from USD 3.54 billion in 2026 to reach USD 5.11 billion by 2031, at a CAGR of 7.62% during the forecast period (2026-2031).
This report is Segmented by Type (Hardware, Software, and Services), End-User Vertical (Oil and Gas, Power Generation, Process and Manufacturing, and More), Monitoring Technique (Portable/Offline Monitoring, Online/Continuous Monitoring, and Remote/Wireless Monitoring), Deployment Mode (On-Premise, and Cloud-Based), and Geography. The Market Forecasts are Provided in Terms of Value (USD).
Global Condition Monitoring Equipment Market Trends and Insights
Rise in Demand for Smart Factories
Manufacturers building smart factories integrate asset health data with production metrics to drive holistic optimization. Condition monitoring platforms must interface with manufacturing execution and enterprise resource planning systems, so vendors emphasize open protocols and interoperable architectures. Edge computing enables immediate anomaly detection on the shop floor, reducing cloud bandwidth costs and response times. Operators use intuitive dashboards that translate vibration and thermal patterns into actionable tasks, and reported downtime reductions range from 15% to 25% when such systems are fully deployed. As enterprises link reliability outcomes to overall equipment effectiveness targets, demand rises for solutions scalable across multi-plant networks. The heightened focus on smart operations thus feeds long-term growth for the condition monitoring equipment market.
Growing Emphasis on Predictive Maintenance Programs
Corporate maintenance policies now prioritize data-driven interventions instead of rigid preventive schedules. Predictive maintenance often yields triple-digit returns on investment because failures are detected before secondary damage occurs, thereby reducing emergency repair costs and lost production hours. Machine-learning models synthesize vibration, temperature, and lubricant data into a single asset health score that maintenance planners trust for scheduling. Centralized cloud dashboards enable teams to oversee distributed plants from command centers, while shared databases of failure modes continually refine diagnostic accuracy. The positive economics and operational clarity continue to draw new adopters into the condition monitoring equipment market.
Cybersecurity Concerns in Connected Monitoring Systems
High-profile cyber incidents targeting operational technology make asset owners cautious about connecting machines to external networks. Updated 2024 NIST guidelines highlight sensor gateways and data historians as potential attack vectors. Many legacy plants lack segmented architectures, so retrofits require significant investments in firewall, intrusion detection, and identity management. Regulations governing critical infrastructure require strict compliance audits, which can lengthen project timelines. As a result, some operators favor air-gapped or on-premise deployments, tempering the near-term growth of cloud-centric solutions within the condition monitoring equipment market.
Other drivers and restraints analyzed in the detailed report include:
- Increasing Focus on Renewable Energy Asset Reliability
- Integration of IIoT and Cloud Analytics in Condition Monitoring
- High Capital Outlay for Advanced Monitoring Equipment
For complete list of drivers and restraints, kindly check the Table Of Contents.
Segment Analysis
The hardware segment accounted for 60.78% of the condition monitoring equipment market in 2025. Vibration probes, thermal cameras, and oil debris sensors remain the core diagnostic tools across rotating machinery, electrical systems, and hydraulics. Vendors continually raise sensor bandwidth and temperature ratings to match harsher service environments, reinforcing hardware replacement cycles. The services segment is the fastest-growing category, progressing at a 8.99% CAGR as users outsource data interpretation and repair planning. Under outcome-based contracts, providers leverage cloud analytics to guarantee uptime targets, aligning payment with performance rather than equipment sales. This model encourages wider adoption of predictive programs without major capital outlays, expanding the total condition monitoring equipment market.
Software advances bridge the gap between hardware and services by converting raw waveforms into actionable insights. Vendors embed artificial intelligence inside edge gateways to filter noise, compress relevant events, and push prioritized alerts to maintenance teams. Stand-alone software sales have slowed because buyers prefer integrated stacks, but software remains the differentiator that turns generic sensors into high-value solutions. Condition monitoring as a service, therefore, bundles hardware, analytics, and expert review into one subscription, driving recurring revenue and deeper customer lock-in across the condition monitoring equipment industry.
Oil and gas operations dominated the condition monitoring equipment market, accounting for 25.21% of the market size in 2025. Harsh drilling, refining, and liquefaction environments expose pumps, turbines, and compressors to severe wear, so vibration and thermography systems are long-standing requirements. The power generation segment, led by wind, solar, and life-extension projects for thermal plants, is forecast to grow at an 8.05% CAGR through 2031. Renewable operators depend on continuous monitoring to plan offshore service visits and avoid lost megawatt-hours during peak demand periods. Utilities also integrate asset health scores into grid dispatch models to balance cost and reliability, broadening application scope.
Process and discrete manufacturing plants adopt predictive programs to support lean inventory and just-in-time production, where uptime is paramount. Aerospace, defense, and transportation sectors seek specialized certifications and ruggedized devices, creating profitable niches for high-margin products. Meanwhile, mining, marine, and civil infrastructure markets add incremental volume by applying proven methodologies from the oil and gas sector. This diversification stabilizes demand and sustains healthy prospects for the condition monitoring equipment market.
Complete Report Scope:
- By Type
- Hardware
- Vibration Monitoring Equipment
- Thermography Equipment
- Lubricating Oil Analysis Equipment
- Software
- Services
- Hardware
- By End-User vertical
- Oil and Gas
- Power Generation
- Process and Manufacturing
- Aerospace and Defence
- Automotive and Transportation
- Other End-user Verticals
- By Monitoring Technique
- Portable/Offline Monitoring
- Online/Continuous Monitoring
- Remote/Wireless Monitoring
- By Deployment Mode
- On-Premise
- Cloud-Based
- By Geography
- North America
- United States
- Canada
- Mexico
- Europe
- Germany
- United Kingdom
- France
- Russia
- Rest of Europe
- Asia-Pacific
- China
- Japan
- India
- South Korea
- Australia
- Rest of Asia-Pacific
- Middle East and Africa
- Middle East
- Saudi Arabia
- United Arab Emirates
- Rest of Middle East
- Africa
- South Africa
- Egypt
- Rest of Africa
- Middle East
- South America
- Brazil
- Argentina
- Rest of South America
- North America
Geography Analysis
North America led the condition monitoring equipment market, accounting for a 33.21% share in 2025. The United States relies on predictive maintenance to counter skilled-labor shortages and extend the life of aging process plants. Federal safety regulations and corporate sustainability goals further mandate the monitoring of asset integrity. Canada applies similar technologies in oil sands operations and remote hydroelectric facilities, whereas Mexico's expanding automotive corridor demands cost-effective wireless solutions to uphold lean production targets. Together, these factors sustain strong replacement and upgrade cycles across the region.
The Middle East is the fastest-growing region, projected to grow at a 7.88% CAGR through 2031. National diversification agendas aim to modernize petrochemical complexes and create advanced manufacturing hubs through large-scale programs. New smart city and transportation projects generate additional demand for continuous verification of asset health. Harsh ambient temperatures, desert dust, and corrosive atmospheres drive the need for specialized sensors, and regional service hubs are emerging to support the local interpretation of diagnostic data.
Asia-Pacific follows closely due to its massive industrial base. China pushes domestic innovation through industrial internet initiatives, linking condition data with supply-chain platforms to boost quality competitiveness. Japan's mature plants undertake large-scale retrofits to keep their automotive and electronics facilities competitive, while India's 'Make in India' initiative stimulates adoption among small and mid-sized manufacturers. Across the region, a surge in renewable power projects requires remote monitoring to protect investments in wind and solar assets. Collectively, these factors widen the scope of the condition monitoring equipment market.
- Rockwell Automation Inc.
- Emerson Electric Co.
- Meggitt PLC
- General Electric Company
- SKF AB
- Bruel and Kjaer Vibro GmbH
- Teledyne FLIR LLC
- Fluke Corporation
- Nippon Avionics Co., Ltd.
- Thermo Fisher Scientific Inc.
- PerkinElmer Inc.
- Spectro Scientific Inc. (AMETEK Inc.)
- Parker Hannifin Corporation
- Gastops Ltd.
- Siemens AG
- Honeywell International Inc.
- ABB Ltd.
- Baker Hughes Company
- National Instruments Corporation
- Schaeffler AG
- PRUFTECHNIK Dieter Busch AG
- Wilcoxon Sensing Technologies (ITT Inc.)
- Connection Technology Center Inc.
Additional Benefits:
- The market estimate (ME) sheet in Excel format
- 3 months of analyst support
TABLE OF CONTENTS
1 INTRODUCTION
- 1.1 Study Assumptions and Market Definition
- 1.2 Scope of the Study
2 RESEARCH METHODOLOGY
3 EXECUTIVE SUMMARY
4 MARKET LANDSCAPE
- 4.1 Market Drivers
- 4.1.1 Rise in Demand for Smart Factories
- 4.1.2 Growing Emphasis on Predictive Maintenance Programs
- 4.1.3 Increasing Focus on Renewable Energy Asset Reliability
- 4.1.4 Integration of IIoT and Cloud Analytics in Condition Monitoring
- 4.1.5 Miniaturisation of Wireless Sensor Nodes
- 4.1.6 Shift Toward Servitisation Business Models
- 4.2 Market Restraints
- 4.2.1 Unpredictable Maintenance Scheduling Windows
- 4.2.2 Shortage of Skilled Reliability Engineers
- 4.2.3 Cybersecurity Concerns in Connected Monitoring Systems
- 4.2.4 High Capital Outlay for Advanced Monitoring Equipment
- 4.3 Industry Value Chain Analysis
- 4.4 Regulatory Landscape
- 4.5 Technological Outlook
- 4.6 Porter's Five Forces Analysis
- 4.6.1 Bargaining Power of Suppliers
- 4.6.2 Bargaining Power of Buyers
- 4.6.3 Threat of New Entrants
- 4.6.4 Threat of Substitute Products
- 4.6.5 Intensity of Competitive Rivalry
- 4.7 Impact of Macroeconomic Factors
5 MARKET SIZE AND GROWTH FORECASTS (VALUE)
- 5.1 By Type
- 5.1.1 Hardware
- 5.1.1.1 Vibration Monitoring Equipment
- 5.1.1.2 Thermography Equipment
- 5.1.1.3 Lubricating Oil Analysis Equipment
- 5.1.2 Software
- 5.1.3 Services
- 5.1.1 Hardware
- 5.2 By End-User vertical
- 5.2.1 Oil and Gas
- 5.2.2 Power Generation
- 5.2.3 Process and Manufacturing
- 5.2.4 Aerospace and Defence
- 5.2.5 Automotive and Transportation
- 5.2.6 Other End-user Verticals
- 5.3 By Monitoring Technique
- 5.3.1 Portable/Offline Monitoring
- 5.3.2 Online/Continuous Monitoring
- 5.3.3 Remote/Wireless Monitoring
- 5.4 By Deployment Mode
- 5.4.1 On-Premise
- 5.4.2 Cloud-Based
- 5.5 By Geography
- 5.5.1 North America
- 5.5.1.1 United States
- 5.5.1.2 Canada
- 5.5.1.3 Mexico
- 5.5.2 Europe
- 5.5.2.1 Germany
- 5.5.2.2 United Kingdom
- 5.5.2.3 France
- 5.5.2.4 Russia
- 5.5.2.5 Rest of Europe
- 5.5.3 Asia-Pacific
- 5.5.3.1 China
- 5.5.3.2 Japan
- 5.5.3.3 India
- 5.5.3.4 South Korea
- 5.5.3.5 Australia
- 5.5.3.6 Rest of Asia-Pacific
- 5.5.4 Middle East and Africa
- 5.5.4.1 Middle East
- 5.5.4.1.1 Saudi Arabia
- 5.5.4.1.2 United Arab Emirates
- 5.5.4.1.3 Rest of Middle East
- 5.5.4.2 Africa
- 5.5.4.2.1 South Africa
- 5.5.4.2.2 Egypt
- 5.5.4.2.3 Rest of Africa
- 5.5.4.1 Middle East
- 5.5.5 South America
- 5.5.5.1 Brazil
- 5.5.5.2 Argentina
- 5.5.5.3 Rest of South America
- 5.5.1 North America
6 COMPETITIVE LANDSCAPE
- 6.1 Market Concentration
- 6.2 Strategic Moves
- 6.3 Market Share Analysis
- 6.4 Company Profiles (includes Global level Overview, Market level overview, Core Segments, Financials as available, Strategic Information, Market Rank/Share for key companies, Products and Services, and Recent Developments)
- 6.4.1 Rockwell Automation Inc.
- 6.4.2 Emerson Electric Co.
- 6.4.3 Meggitt PLC
- 6.4.4 General Electric Company
- 6.4.5 SKF AB
- 6.4.6 Bruel and Kjaer Vibro GmbH
- 6.4.7 Teledyne FLIR LLC
- 6.4.8 Fluke Corporation
- 6.4.9 Nippon Avionics Co., Ltd.
- 6.4.10 Thermo Fisher Scientific Inc.
- 6.4.11 PerkinElmer Inc.
- 6.4.12 Spectro Scientific Inc. (AMETEK Inc.)
- 6.4.13 Parker Hannifin Corporation
- 6.4.14 Gastops Ltd.
- 6.4.15 Siemens AG
- 6.4.16 Honeywell International Inc.
- 6.4.17 ABB Ltd.
- 6.4.18 Baker Hughes Company
- 6.4.19 National Instruments Corporation
- 6.4.20 Schaeffler AG
- 6.4.21 PRUFTECHNIK Dieter Busch AG
- 6.4.22 Wilcoxon Sensing Technologies (ITT Inc.)
- 6.4.23 Connection Technology Center Inc.
7 MARKET OPPORTUNITIES AND FUTURE OUTLOOK
- 7.1 White-Space and Unmet-Need Assessment

 2026年全球軸承狀態監測市場報告
 工業超音波狀態監測與檢測解決方案市場規模、佔有率及趨勢分析報告:按組件、監測技術、部署方式、最終用戶、地區及細分市場預測(2026-2033 年)
 機械振動監測系統的市場機會、成長要素、產業趨勢分析及 2026-2035 年預測。2026年全球鐵路線路監測系統市場報告
 邊坡穩定性監測服務市場預測至2034年-按服務類型、技術、應用和區域分類的全球分析
 船舶狀態監測工具:2026-2032年全球市佔率及排名、總收入及需求預測
 狀態監測設備市場:依產品類型、應用、最終用戶和地區分類
 皮帶狀態監測系統市場:按組件、部署方式、監測類型、安裝類型、皮帶類型、最終用戶分類,全球預測,2026-2032年離線分板設備市場:依基板類型、自動化程度、處理能力、設備技術及終端用戶產業分類-全球預測,2026-2032年面板拆卸設備市場:依技術、PCB材料、終端用戶產業、應用與銷售管道,全球預測,2026-2032年