


 |
市場調查報告書
商品編碼
2122613
社群媒體中的人工智慧:市場佔有率分析、產業趨勢與統計數據及成長預測(2026-2031 年)AI In Social Media - Market Share Analysis, Industry Trends & Statistics, Growth Forecasts (2026 - 2031) |
||||||

※ 本網頁內容可能與最新版本有所差異。詳細情況請與我們聯繫。
根據 Mordor Intelligence 預測,社群媒體領域的人工智慧市場規模預計將從 2025 年的 26.9 億美元成長到 2026 年的 34.2 億美元,然後從 2026 年到 2031 年以 27.15% 的複合年成長率成長,到 20317 億美元。
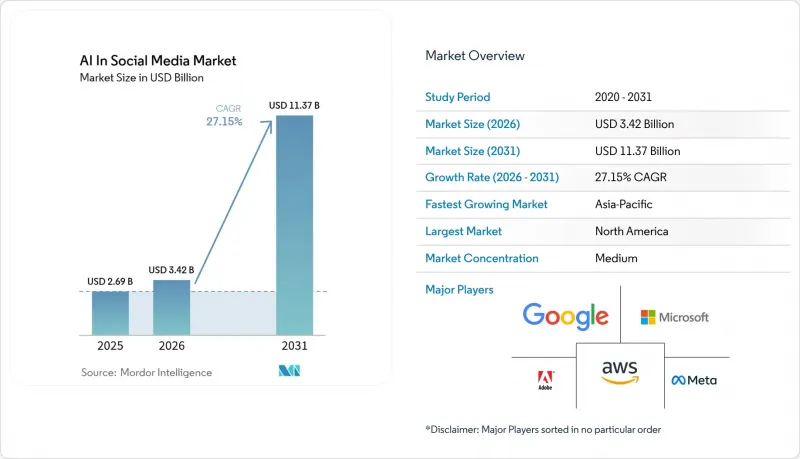
本報告按技術(機器學習、深度學習、自然語言處理 (NLP))、應用(客戶體驗管理、銷售和行銷等)、服務(託管服務、專業服務)、組織規模(中小企業、大型企業)、最終用戶行業(零售、電子商務等)和地區進行細分。市場預測以價值(美元)表示。
全球人工智慧市場趨勢及社群媒體洞察
將人工智慧融入高度精準的社群媒體廣告
目前,社群媒體領域的人工智慧市場正見證著生成式引擎不斷最佳化受眾細分,使廣告主能夠即時最佳化文案、圖片和行動號召(CTA)文字。 Meta 的報告顯示,當宣傳活動融入人工智慧驅動的建議時,廣告支出增加了 40%,這表明收入有所成長。 TikTok 正在試行虛擬銷售主持人,將娛樂與結帳指導結合,從而提升用戶參與度和串流內購買率。雖然 Z 世代用戶歡迎這些個人化資訊流,但 88% 的用戶呼籲加強人工智慧管治,凸顯了隱私與效果之間的衝突。因此,隨著監管提案的逐步成形,每個平台都需要在績效目標和透明的使用者許可流程之間取得平衡。
社交平臺向「行動優先」模式的轉變以及用戶使用時間的增加。
由於大多數日常會話都是透過智慧型手機進行的,開發者正盡可能地將推理工作負載轉移到設備端。邊緣處理可以降低延遲、減少雲端使用成本,並支援建議提示,例如基於位置的建議。歐洲資料保護監管機構 (EDPS) 指出,在裝置上運行符合歐洲嚴格的資料本地化法規。發表在 arXiv 上的一項研究發現,行動裝置模型仍面臨刻板印像外洩的風險,這推動了對差分隱私技術的投資。供應商也在嘗試混合架構,僅將部分向量傳送到雲端,以平衡速度和合規性。
社交圖譜最佳化領域人工智慧人才短缺
用於好友提案和資訊流排名的圖神經網路需要專業的知識和技能。 Meta公司為了招攬人才,開出了高達1億美元的契約,這加劇了人才短缺的局面。新興市場的公司尤其面臨困境,許多公司將模型調優外包或採用自動化機器學習流程,這可能會影響邊緣運算的品質。與大學和開放課程平台的合作旨在擴大人才庫,但未來三年的招募速度仍低於預期成長速度。
細分市場分析
到2025年,機器學習和深度學習引擎將佔據社群媒體人工智慧市場佔有率的61.35%,凸顯了這些技術在資訊流排名和違規檢測方面發揮的關鍵作用。社群媒體人工智慧市場正不斷擴展這些模型,以處理視訊格式和新興的多模態貼文。自2020年以來的歷史資料集顯示,以變壓器取代傳統的CNN-RNN混合模型,顯著提高了模型的準確率。
自然語言處理 (NLP) 的發展速度更快,預計在 2026 年至 2031 年間將以 29.10% 的複合年成長率成長,這主要得益於聊天助理和自動文案撰寫技術的推動。大規模語言模型 (LLM) 在偵測有害內容方面,其效能比基於規則的過濾器高出 73%,不僅擴展了安全層級,還增強了品牌語調控制能力。隨著資源高效的語言包商業性實用化,面向社群媒體的 NLP 驅動型人工智慧工具市場預計將進一步擴大。同時,電腦視覺技術堆疊與語音和文字編碼器的融合,正為更深入地理解內容鋪平道路。
2025年,銷售和行銷引領市場,佔47.85%的收入佔有率,這主要得益於人工智慧驅動的廣告最佳化提升了早期採用者的投資報酬率(ROAS)。這代表了社群媒體人工智慧市場最大的佔有率,並有望透過訂閱式創新套件保持其主導地位。預測性案源計分和預算分配演算法實現了以往繁瑣的手動電子表格工作自動化,使行銷人員能夠專注於故事講述,而非競標調整。
受用戶轉向短影片的推動,影像和影片識別預計將以 27.95% 的複合年成長率成長。在社群媒體人工智慧市場,即時場景標註、產品標記和擴增實境疊加等技術正被廣泛應用,以促進衝動消費。這些流程現在都融入了深度造假檢測功能,以確保內容的真實性。結合新興的影片轉文本字幕技術,平台在簡化無障礙標準合規流程的同時,也提高了搜尋的可發現性。
區域分析
預計到2025年,北美將佔全球收入的37.75%,主要得益於Meta、Alphabet、微軟以及矽谷周邊蓬勃發展的新創公司。該地區的雲端運算巨頭為基礎模型的訓練提供支持,其風險投資生態系統則為內容技術提供資金,從而推動了社交媒體領域人工智慧市場的擴張。政府津貼重點關注可信賴的人工智慧,鼓勵進行偏見審計和開發用於提高透明度的應用程式介面(API),以完善聯邦隱私提案。
亞太地區是成長最快的地區,預計到2031年複合年成長率將達到29.75%。中國在生成式人工智慧領域資金籌措、印度蓬勃發展的開發者群體以及韓國5G網路的擴張,預計將推動社群媒體用戶數量突破10億。本地網路整合支援印地語、馬來語和泰語等多語言的本地語言學習平台(LLM),正在擴大人工智慧在社群媒體上的市場佔有率,並覆蓋西方平台服務不足的使用者群體。
歐洲在適應更嚴格的監管的同時,以隱私為中心的設計正在推動設備內研究的發展。雖然社群媒體上的人工智慧市場成長速度有所放緩,但隨著企業為符合合規要求的工具包支付溢價,用戶人均支出卻不斷成長。行動裝置在中東和非洲的使用量正在迅速擴大。營運商提供的資料通訊套餐和金融科技錢包正在促進斯瓦希里語、阿拉伯語和豪薩語的內容創作。在拉丁美洲,社群電商插件的整合,結合網紅文化和跨境支付,正在創造新的機會。
其他好處:
- Excel格式的市場預測(ME)表
- 3個月的分析師支持
目錄
第1章:引言
- 研究假設和市場定義
- 調查範圍
第2章:調查方法
第3章執行摘要
第4章 市場狀況
- 市場概覽
- 市場促進因素
- 整合人工智慧驅動的、高度精準的社群媒體廣告(主流)
- 用戶在社交平臺(行動優先、主流平台)上花費的時間增加
- 人工智慧驅動的社群電商引擎正在提高轉換率(主流)。
- 基礎模型 API 旨在降低資訊流產生內容的准入門檻
- 透過設備內推理實現受隱私保護的個人化。
- 透過引入“虛擬網紅”,品牌可以低成本地擴大影響力。
- 市場限制因素
- 負責最佳化社交圖譜的人工智慧(主流)人才短缺
- 新興市場(主流)中小企業缺乏人工智慧預算
- 加強對用戶生成數據管道的監管
- 模特兒出現幻覺可能損害品牌信譽的風險
- 價值鏈分析
- 監理情勢
- 技術展望(人工智慧工具鏈藍圖)
- 波特五力分析
- 投資分析
- 評估新冠疫情和經濟放緩的影響
第5章 市場規模與成長預測
- 透過技術
- 機器學習和深度學習
- 自然語言處理(NLP)
- 透過使用
- 客戶體驗管理
- 銷售與行銷
- 圖像和影片識別
- 預測性風險評估
- 其他用途
- 按服務
- 託管服務
- 專業服務
- 按組織規模
- 小型企業
- 大公司
- 按最終用戶行業分類
- 零售
- 電子商務
- 銀行、金融服務和保險(BFSI)
- 媒體與廣告
- 教育
- 其他行業
- 按地區
- 北美洲
- 美國
- 加拿大
- 墨西哥
- 南美洲
- 巴西
- 阿根廷
- 其他南美國家
- 歐洲
- 英國
- 德國
- 法國
- 西班牙
- 俄羅斯
- 其他歐洲國家
- 亞太地區
- 中國
- 日本
- 印度
- 韓國
- 澳洲和紐西蘭
- 其他亞太國家
- 中東和非洲
- 中東
- 沙烏地阿拉伯
- UAE
- 土耳其
- 其他中東國家
- 非洲
- 南非
- 奈及利亞
- 其他非洲國家
- 中東
- 北美洲
第6章 競爭情勢
- 市場集中度
- 策略趨勢
- 市佔率分析
- 公司簡介
- Google LLC
- Microsoft Corporation
- Meta Platforms Inc.
- Amazon Web Services Inc.
- IBM Corporation
- Adobe Inc.
- Salesforce Inc.
- Baidu Inc.
- Snap Inc.
- Hootsuite Media Inc.
- Meltwater ASA
- Sprout Social Inc.
- Sprinklr Inc.
- HubSpot Inc.
- ByteDance Ltd.
- Tencent Holdings Ltd.
- X Corp.(formerly Twitter)
- Snapchat Inc.
- TikTok(ByteDance)
- Discord Inc.
- Talkwalker SA
第7章 市場機會與未來展望
According to Mordor Intelligence, the AI in social media market size is expected to grow from USD 2.69 billion in 2025 to USD 3.42 billion in 2026 and is forecast to reach USD 11.37 billion by 2031 at 27.15% CAGR over 2026-2031.
This report is Segmented by Technology (Machine Learning and Deep Learning and Natural Language Processing (NLP)), Application (Customer Experience Management, Sales and Marketing, and More), Service (Managed Service and Professional Service), Organization Size (SMEs, Large Enterprises), End-User Industry (Retail, E-Commerce, and More), and Geography. The Market Forecasts are Provided in Terms of Value (USD).
Global AI In Social Media Market Trends and Insights
Integration of AI for Hyper-Targeted Social Media Advertising
Generative engines now refine audience segmentation in the AI in social media market, letting advertisers tailor copy, imagery, and call-to-action wording on the fly. Meta reports a 40% spending uplift when campaigns deploy AI-driven recommendations, confirming the revenue upside. TikTok pilots virtual sales hosts that both entertain and guide checkout, raising engagement and in-stream purchase rates. Gen-Z users welcome these bespoke feeds, yet 88% also seek tighter AI governance, illustrating the privacy-effectiveness tension. Networks must therefore blend performance objectives with transparent consent flows as regulatory drafts take shape.
Mobile-First Rise in Time Spent on Social Platforms
Smartphones account for most daily sessions, so developers shift inference workloads onto devices where possible. Edge processing cuts latency, trims cloud fees, and enables contextual prompts, such as location-aware recommendations. The EDPS notes that on-device execution aligns with strict data localization rules across Europe. Research on arXiv finds handheld models still risk stereotype leakage, spurring investment in differential-privacy techniques. Vendors also experiment with mixed architectures that send only partial vectors to the cloud, balancing speed and compliance.
Scarcity of AI Talent for Social-Graph Optimization
Graph neural networks powering friend suggestions and feed ranking demand niche expertise. Meta has offered signing bonuses up to USD 100 million to attract staff, intensifying the squeeze. Emerging-market firms struggle most, so many outsource model tuning or adopt auto-ML pipelines, which can reduce quality in edge cases. University partnerships and open-curriculum platforms aim to widen the talent pool, yet hiring lags growth projections over the next three years.
Other drivers and restraints analyzed in the detailed report include:
- AI-Powered Social-Commerce Engines Boosting Conversion
- Foundation-Model APIs Lowering Entry Barriers for In-Feed Generative Content
- Limited AI Budgets Among SMEs in Emerging Economies
For complete list of drivers and restraints, kindly check the Table Of Contents.
Segment Analysis
Machine learning and deep learning engines held 61.35% of AI in social media market share in 2025, underlining their critical role in ranking feeds and spotting policy violations.The AI in social media market keeps scaling these models to manage video formats and emerging multimodal posts. Historic datasets stretching back to 2020 show steady accuracy improvements as transformers replaced older CNN-RNN hybrids.
Natural language processing is advancing even faster, posting a 29.10% CAGR for 2026-2031 on the back of chat assistants and automatic copywriting. LLMs, now outperforming rule-based filters by 73% in toxicity detection, expand safety layers while adding brand-tone control. The AI in social media market size for NLP-driven tools is poised to widen as low-resource language packs reach commercial viability. Concurrently, computer vision stacks integrate with audio-text encoders, paving paths for unified content understanding.
Sales and marketing dominated 2025 with 47.85% of revenue, riding AI ad-optimization that lifted return on spend for early adopters. That slice equates to the largest portion of the AI in social media market size and will retain precedence through subscription-based creative suites. Predictive lead-scoring and budget pacing algorithms automate once manual spreadsheets, freeing marketers to focus on narrative arcs instead of bid toggles.
Image and video recognition, forecast to grow at 27.95% CAGR, benefits from user migration to short-form clips. The AI in social media market leverages real-time scene labeling, product tagging, and AR overlays that spur impulse buys. Deepfake detectors now accompany these pipelines to maintain authenticity gates. Paired with emerging video-to-text captioning, platforms streamline accessibility compliance while improving search discoverability.
Complete Report Scope:
- By Technology
- Machine Learning and Deep Learning
- Natural Language Processing (NLP)
- By Application
- Customer Experience Management
- Sales and Marketing
- Image and Video Recognition
- Predictive Risk Assessment
- Other Applications
- By Service
- Managed Service
- Professional Service
- By Organization Size
- Small and Medium Enterprises
- Large Enterprises
- By End-User Industry
- Retail
- E-commerce
- Banking, Financial Services and Insurance (BFSI)
- Media and Advertising
- Education
- Other Industries
- By Geography
- North America
- United States
- Canada
- Mexico
- South America
- Brazil
- Argentina
- Rest of South America
- Europe
- United Kingdom
- Germany
- France
- Spain
- Russia
- Rest of Europe
- Asia Pacific
- China
- Japan
- India
- South Korea
- Australia and New Zealand
- Rest of Asia Pacific
- Middle East and Africa
- Middle East
- Saudi Arabia
- UAE
- Turkey
- Rest of Middle East
- Africa
- South Africa
- Nigeria
- Rest of Africa
- Middle East
- North America
Geography Analysis
North America held 37.75% revenue in 2025, driven by Meta, Alphabet, Microsoft, and a dense start-up pipeline around Silicon Valley. The region's cloud incumbents anchor foundational model training, and its venture ecosystem funds content-tech verticals that expand the AI in social media market. Government grants focus on trustworthy AI, encouraging bias audits and transparency APIs that complement federal privacy proposals.
Asia Pacific is the fastest-advancing territory with a 29.75% CAGR through 2031. China's USD 2.1 billion in generative-AI funding, India's thriving developer base, and Korea's 5G coverage combine to scale user adoption beyond 1 billion social-media accounts. The AI in social media market share grows as local networks integrate multilingual LLMs tuned to Hindi, Bahasa, and Thai dialects, capturing cohorts under-served by Western platforms.
Europe navigates stricter oversight, but privacy-led design spurs on-device research. The AI in social media market size reflects slower headline growth yet higher spend per user because enterprises pay premiums for compliant toolkits. The Middle East and Africa witness rising mobile uptake; telco-bundled data and fintech wallets fuel content creation across Swahili, Arabic, and Hausa. Latin America integrates social-commerce plug-ins, aligning influencer culture with cross-border payments to unlock fresh opportunities.
- Google LLC
- Microsoft Corporation
- Meta Platforms Inc.
- Amazon Web Services Inc.
- IBM Corporation
- Adobe Inc.
- Salesforce Inc.
- Baidu Inc.
- Snap Inc.
- Hootsuite Media Inc.
- Meltwater ASA
- Sprout Social Inc.
- Sprinklr Inc.
- HubSpot Inc.
- ByteDance Ltd.
- Tencent Holdings Ltd.
- X Corp. (formerly Twitter)
- Snapchat Inc.
- TikTok (ByteDance)
- Discord Inc.
- Talkwalker SA
Additional Benefits:
- The market estimate (ME) sheet in Excel format
- 3 months of analyst support
TABLE OF CONTENTS
1 INTRODUCTION
- 1.1 Study Assumptions and Market Definition
- 1.2 Scope of the Study
2 RESEARCH METHODOLOGY
3 EXECUTIVE SUMMARY
4 MARKET LANDSCAPE
- 4.1 Market Overview
- 4.2 Market Drivers
- 4.2.1 Integration of AI for hyper-targeted social-media advertising (mainstream)
- 4.2.2 Mobile-first rise in time-spent on social platforms (mainstream)
- 4.2.3 AI-powered social-commerce engines boosting conversion (mainstream)
- 4.2.4 Foundation-model APIs lowering entry barriers for in-feed generative content (under-the-radar)
- 4.2.5 On-device inference unlocking privacy-preserving personalization (under-the-radar)
- 4.2.6 Synthetic-influencer adoption amplifying brand reach at lower cost (under-the-radar)
- 4.3 Market Restraints
- 4.3.1 Scarcity of AI talent for social-graph optimisation (mainstream)
- 4.3.2 Limited AI budgets among SMEs in emerging economies (mainstream)
- 4.3.3 Heightened regulatory scrutiny on user-generated data pipelines (under-the-radar)
- 4.3.4 Model hallucination risks eroding brand trust (under-the-radar)
- 4.4 Value Chain Analysis
- 4.5 Regulatory Landscape
- 4.6 Technological Outlook (AI Toolchain Roadmap)
- 4.7 Porter's Five Forces Analysis
- 4.7.1 Threat of New Entrants
- 4.7.2 Bargaining Power of Buyers
- 4.7.3 Bargaining Power of Suppliers
- 4.7.4 Threat of Substitutes
- 4.7.5 Intensity of Competitive Rivalry
- 4.8 Investment Analysis
- 4.9 Assessment of Impact of COVID-19 and Economic Slowdown
5 MARKET SIZE AND GROWTH FORECASTS (VALUE)
- 5.1 By Technology
- 5.1.1 Machine Learning and Deep Learning
- 5.1.2 Natural Language Processing (NLP)
- 5.2 By Application
- 5.2.1 Customer Experience Management
- 5.2.2 Sales and Marketing
- 5.2.3 Image and Video Recognition
- 5.2.4 Predictive Risk Assessment
- 5.2.5 Other Applications
- 5.3 By Service
- 5.3.1 Managed Service
- 5.3.2 Professional Service
- 5.4 By Organization Size
- 5.4.1 Small and Medium Enterprises
- 5.4.2 Large Enterprises
- 5.5 By End-User Industry
- 5.5.1 Retail
- 5.5.2 E-commerce
- 5.5.3 Banking, Financial Services and Insurance (BFSI)
- 5.5.4 Media and Advertising
- 5.5.5 Education
- 5.5.6 Other Industries
- 5.6 By Geography
- 5.6.1 North America
- 5.6.1.1 United States
- 5.6.1.2 Canada
- 5.6.1.3 Mexico
- 5.6.2 South America
- 5.6.2.1 Brazil
- 5.6.2.2 Argentina
- 5.6.2.3 Rest of South America
- 5.6.3 Europe
- 5.6.3.1 United Kingdom
- 5.6.3.2 Germany
- 5.6.3.3 France
- 5.6.3.4 Spain
- 5.6.3.5 Russia
- 5.6.3.6 Rest of Europe
- 5.6.4 Asia Pacific
- 5.6.4.1 China
- 5.6.4.2 Japan
- 5.6.4.3 India
- 5.6.4.4 South Korea
- 5.6.4.5 Australia and New Zealand
- 5.6.4.6 Rest of Asia Pacific
- 5.6.5 Middle East and Africa
- 5.6.5.1 Middle East
- 5.6.5.1.1 Saudi Arabia
- 5.6.5.1.2 UAE
- 5.6.5.1.3 Turkey
- 5.6.5.1.4 Rest of Middle East
- 5.6.5.2 Africa
- 5.6.5.2.1 South Africa
- 5.6.5.2.2 Nigeria
- 5.6.5.2.3 Rest of Africa
- 5.6.5.1 Middle East
- 5.6.1 North America
6 COMPETITIVE LANDSCAPE
- 6.1 Market Concentration
- 6.2 Strategic Moves
- 6.3 Market Share Analysis
- 6.4 Company Profiles (includes Global level Overview, Market level overview, Core Segments, Financials as available, Strategic Information, Market Rank/Share for key companies, Products and Services, and Recent Developments)
- 6.4.1 Google LLC
- 6.4.2 Microsoft Corporation
- 6.4.3 Meta Platforms Inc.
- 6.4.4 Amazon Web Services Inc.
- 6.4.5 IBM Corporation
- 6.4.6 Adobe Inc.
- 6.4.7 Salesforce Inc.
- 6.4.8 Baidu Inc.
- 6.4.9 Snap Inc.
- 6.4.10 Hootsuite Media Inc.
- 6.4.11 Meltwater ASA
- 6.4.12 Sprout Social Inc.
- 6.4.13 Sprinklr Inc.
- 6.4.14 HubSpot Inc.
- 6.4.15 ByteDance Ltd.
- 6.4.16 Tencent Holdings Ltd.
- 6.4.17 X Corp. (formerly Twitter)
- 6.4.18 Snapchat Inc.
- 6.4.19 TikTok (ByteDance)
- 6.4.20 Discord Inc.
- 6.4.21 Talkwalker SA
7 MARKET OPPORTUNITIES AND FUTURE OUTLOOK
- 7.1 White-space and Unmet-need Assessment

 2026年人工智慧(AI)產生短影片腳本全球市場報告
 社群媒體市場中的人工智慧 (AI) - 全球市場預測 2026-20322026年全球人工智慧驅動的社群媒體危機偵測市場報告
 社群媒體市場的人工智慧:按技術、應用和地區分類2026年全球社群媒體人工智慧市場報告2026年全球人工智慧(AI)生成網紅腳本市場報告
 社群媒體人工智慧(AI)市場分析及預測(至2035年):按類型、產品類型、服務、技術、組件、應用、部署類型、最終用戶和功能分類
 2026-2034年全球社群媒體人工智慧(AI)市場規模、佔有率、趨勢和成長分析報告
 社群媒體人工智慧市場-全球產業規模、佔有率、趨勢、機會及預測(按應用、服務、最終用戶、地區和競爭格局分類,2021-2031年)
 社群媒體人工智慧市場規模、佔有率和趨勢分析報告(按最終用途、類型、應用、部署、行業、地區和細分趨勢):2025 年至 2033 年